Collaborative Culture Jobs with Hybrid/Remote/WFH Options

Culture of Collaboration
UK > Work from Home

The table below provides summary statistics for permanent remote or hybrid work requiring Collaborative Culture skills. It includes a benchmarking guide to the annual salaries offered in vacancies that cited Collaborative Culture over the 6 months leading up to 19 May 2025, comparing them to the same period in the previous two years.

6 months to
19 May 2025
Same period 2024 Same period 2023
Rank 111 190 213
Rank change year-on-year +79 +23 +80
Permanent jobs citing Collaborative Culture 611 576 663
As % of all permanent jobs with a WFH option 3.28% 1.70% 1.64%
As % of the Processes & Methodologies category 3.48% 1.87% 1.71%
Number of salaries quoted 239 393 233
10th Percentile £35,000 £40,702 £37,879
25th Percentile £44,000 £46,250 £52,500
Median annual salary (50th Percentile) £58,000 £66,000 £65,000
Median % change year-on-year -12.12% +1.54% +8.33%
75th Percentile £76,875 £87,500 £78,750
90th Percentile £94,000 £117,500 £89,750
UK median annual salary £61,000 £65,000 £65,000
% change year-on-year -6.15% - +8.33%

All Process and Methodology Skills
Work from Home

Collaborative Culture falls under the Processes and Methodologies category. For comparison with the information above, the following table provides summary statistics for all permanent job vacancies with remote or hybrid options requiring process or methodology skills.

Permanent vacancies with a requirement for process or methodology skills 17,536 30,883 38,813
As % of all permanent jobs with a WFH option 94.19% 91.21% 96.05%
Number of salaries quoted 9,778 23,380 26,991
10th Percentile £28,500 £33,750 £37,500
25th Percentile £42,500 £42,500 £47,500
Median annual salary (50th Percentile) £59,450 £57,500 £62,500
Median % change year-on-year +3.39% -8.00% +4.17%
75th Percentile £77,500 £75,000 £82,500
90th Percentile £101,250 £95,000 £100,000
UK median annual salary £57,500 £55,000 £61,180
% change year-on-year +4.55% -10.10% +1.97%

Collaborative Culture
Trend for Jobs with a WFH Option

Job vacancies with remote working options citing Collaborative Culture as a proportion of all IT jobs advertised.
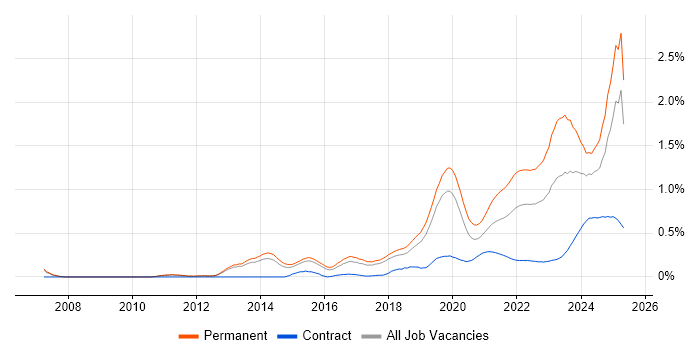
Collaborative Culture trend for jobs with Hybrid/Remote/WFH options

Collaborative Culture
Salary Trend for Jobs with a WFH Option

3-month moving average salary quoted in job vacancies with remote working options citing Collaborative Culture.

Collaborative Culture salary trend for jobs with a WFH option

Collaborative Culture
Salary Histogram for Jobs with a WFH Option

Salary distribution for jobs with remote working options citing Collaborative Culture over the 6 months to 19 May 2025.

Collaborative Culture salary histogram for jobs with a WFH option

Collaborative Culture
Co-occurring Skills and Capabilities with WFH Options by Category

The follow tables expand on the table above by listing co-occurrences grouped by category. The same employment type, locality and period is covered with up to 20 co-occurrences shown in each of the following categories:

Application Platforms
1 18 (2.95%) SharePoint
2 14 (2.29%) Microsoft Exchange
3 12 (1.96%) Confluence
4 10 (1.64%) CMS
5 8 (1.31%) Apache Spark
6 7 (1.15%) IIS
7 5 (0.82%) Jupyter
8 4 (0.65%) Apache
8 4 (0.65%) Headless CMS
9 3 (0.49%) Apache Airflow
10 2 (0.33%) Skype for Business
10 2 (0.33%) Umbraco
11 1 (0.16%) SAS
11 1 (0.16%) SharePoint Server
11 1 (0.16%) WordPress
Applications
1 14 (2.29%) Microsoft Excel
2 7 (1.15%) Chatbot
2 7 (1.15%) Microsoft Office
2 7 (1.15%) Microsoft Project
3 5 (0.82%) Trello
4 3 (0.49%) AutoCAD
5 2 (0.33%) Adobe Creative Suite
5 2 (0.33%) Photoshop
6 1 (0.16%) Adobe Illustrator
6 1 (0.16%) Adobe Premiere
6 1 (0.16%) InDesign
6 1 (0.16%) InVision
6 1 (0.16%) MS Visio
6 1 (0.16%) Sketch
Business Applications
1 7 (1.15%) Dynamics CRM
2 4 (0.65%) SAP S/4HANA
2 4 (0.65%) Shopify
3 3 (0.49%) Maximo
3 3 (0.49%) Sage 50
4 2 (0.33%) Infor M3
4 2 (0.33%) Magento
5 1 (0.16%) Elite 3E
5 1 (0.16%) Payment Gateway
Cloud Services
1 106 (17.35%) Azure
2 88 (14.40%) AWS
3 32 (5.24%) SaaS
4 29 (4.75%) GCP
5 25 (4.09%) Power Platform
6 22 (3.60%) Microsoft 365
7 16 (2.62%) Serverless
8 15 (2.45%) Cloud Computing
8 15 (2.45%) Entra ID
8 15 (2.45%) GitHub
9 13 (2.13%) Azure DevOps
10 11 (1.80%) PaaS
11 9 (1.47%) Amazon EC2
12 8 (1.31%) Adobe Analytics
12 8 (1.31%) Amazon S3
12 8 (1.31%) Azure Data Factory
12 8 (1.31%) Datadog
13 7 (1.15%) AWS Lambda
13 7 (1.15%) Snowflake
13 7 (1.15%) Virtual Private Cloud
Communications & Networking
1 21 (3.44%) Firewall
2 12 (1.96%) VPN
3 11 (1.80%) DNS
4 9 (1.47%) DHCP
4 9 (1.47%) Internet
5 7 (1.15%) Broadband
6 6 (0.98%) WAN
7 5 (0.82%) VoIP
8 4 (0.65%) 5G
8 4 (0.65%) Bluetooth
8 4 (0.65%) Cisco ASA
8 4 (0.65%) Cisco Firepower
8 4 (0.65%) HTTPS
8 4 (0.65%) Network Security
8 4 (0.65%) SD-WAN
8 4 (0.65%) TCP/IP
8 4 (0.65%) VLAN
9 2 (0.33%) LAN
9 2 (0.33%) SAN
9 2 (0.33%) Skype
Database & Business Intelligence
1 31 (5.07%) SQL Server
2 20 (3.27%) Power BI
3 14 (2.29%) Data Lake
4 13 (2.13%) Data Warehouse
4 13 (2.13%) Tableau
5 9 (1.47%) GIS
5 9 (1.47%) MySQL
5 9 (1.47%) Relational Database
6 8 (1.31%) Hadoop
7 6 (0.98%) Data Hub
7 6 (0.98%) PostgreSQL
7 6 (0.98%) SQL CLR
8 5 (0.82%) Amazon RDS
8 5 (0.82%) Big Data
9 4 (0.65%) Azure SQL Database
9 4 (0.65%) Power Query
9 4 (0.65%) RDBMS
9 4 (0.65%) SAP HANA
10 3 (0.49%) Amazon Redshift
10 3 (0.49%) MongoDB
Development Applications
1 31 (5.07%) JIRA
2 11 (1.80%) Visual Studio
3 10 (1.64%) Git
4 4 (0.65%) CppUnit
4 4 (0.65%) Rational DOORS
5 3 (0.49%) GitLab
5 3 (0.49%) Postman
5 3 (0.49%) Selenium
5 3 (0.49%) SoapUI
6 2 (0.33%) Appium
6 2 (0.33%) Jenkins
6 2 (0.33%) Katalon Studio
7 1 (0.16%) Log4Net
7 1 (0.16%) Subversion
7 1 (0.16%) Team Foundation Server
General
1 435 (71.19%) Social Skills
2 328 (53.68%) Finance
3 301 (49.26%) Marketing
4 284 (46.48%) Public Sector
5 55 (9.00%) Analytical Skills
6 31 (5.07%) Inclusion and Diversity
7 28 (4.58%) Law
8 20 (3.27%) Presentation Skills
9 12 (1.96%) Legal
10 11 (1.80%) Health Technology
10 11 (1.80%) Retail
11 10 (1.64%) Back Office
12 9 (1.47%) Manufacturing
13 8 (1.31%) Banking
13 8 (1.31%) Organisational Skills
14 5 (0.82%) Electronics
15 4 (0.65%) Advertising
15 4 (0.65%) Influencing Skills
15 4 (0.65%) Pharmaceutical
15 4 (0.65%) Telecoms
Job Titles
1 272 (44.52%) Business Manager
2 270 (44.19%) Business Development Manager
2 270 (44.19%) Development Manager
3 67 (10.97%) Lead
4 39 (6.38%) Senior
5 35 (5.73%) Developer
6 24 (3.93%) Team Leader
7 23 (3.76%) Analyst
8 16 (2.62%) Project Manager
9 14 (2.29%) Data Engineer
10 13 (2.13%) Consultant
10 13 (2.13%) IT Manager
11 12 (1.96%) Engineering Manager
11 12 (1.96%) Infrastructure Engineer
11 12 (1.96%) Software Engineer
12 11 (1.80%) Insight Analyst
12 11 (1.80%) Technical Leader
13 10 (1.64%) Data Analyst
13 10 (1.64%) Trainer
14 9 (1.47%) Azure Engineer
Libraries, Frameworks & Software Standards
1 33 (5.40%) .NET
2 14 (2.29%) REST
3 13 (2.13%) React
4 12 (1.96%) Web Services
5 10 (1.64%) .NET Framework
5 10 (1.64%) Kafka
5 10 (1.64%) Spring
6 9 (1.47%) AngularJS
6 9 (1.47%) Flutter
6 9 (1.47%) React Native
6 9 (1.47%) Spring Boot
7 8 (1.31%) JSON
7 8 (1.31%) RESTful
8 7 (1.15%) .NET Core
8 7 (1.15%) ASP.NET
8 7 (1.15%) Entity Framework
8 7 (1.15%) SOAP
9 6 (0.98%) Dapper ORM
9 6 (0.98%) Elastic Stack
9 6 (0.98%) NLTK
Miscellaneous
1 20 (3.27%) Cloud Native
2 16 (2.62%) Management Information System
3 14 (2.29%) Enterprise Software
3 14 (2.29%) Team-Oriented Environment
4 12 (1.96%) Data Centre
4 12 (1.96%) Product Ownership
4 12 (1.96%) Social Media
5 9 (1.47%) Algorithms
5 9 (1.47%) Private Cloud
5 9 (1.47%) Public Cloud
6 8 (1.31%) Virtual Team
7 6 (0.98%) Cyber Threat
7 6 (0.98%) Data Structures
8 5 (0.82%) Embedded Systems
8 5 (0.82%) Life Science
8 5 (0.82%) Microsoft Licensing
8 5 (0.82%) NHS
8 5 (0.82%) Replication
9 4 (0.65%) Clustering
9 4 (0.65%) Greenfield Project
Operating Systems
1 49 (8.02%) Windows
2 31 (5.07%) Linux
3 27 (4.42%) Windows Server
4 7 (1.15%) Android
4 7 (1.15%) Apple iOS
5 4 (0.65%) Ubuntu
5 4 (0.65%) Unix
6 3 (0.49%) CentOS
7 2 (0.33%) Red Hat Enterprise Linux
7 2 (0.33%) Windows Server 2003
7 2 (0.33%) Windows Server 2019
Processes & Methodologies
1 294 (48.12%) Collaborative Working
2 276 (45.17%) Business Development
3 270 (44.19%) Marketing Strategy
4 266 (43.54%) Facilities Management
5 140 (22.91%) Problem-Solving
6 130 (21.28%) Agile
7 96 (15.71%) Continuous Improvement
8 78 (12.77%) Mentoring
9 64 (10.47%) DevOps
10 56 (9.17%) Computer Science
10 56 (9.17%) Software Engineering
11 45 (7.36%) Project Management
12 42 (6.87%) Analytics
13 37 (6.06%) Artificial Intelligence
13 37 (6.06%) CI/CD
13 37 (6.06%) Roadmaps
14 36 (5.89%) Stakeholder Management
15 32 (5.24%) Strategic Thinking
16 29 (4.75%) Full-Stack Development
16 29 (4.75%) Machine Learning
Programming Languages
1 67 (10.97%) SQL
2 66 (10.80%) Python
3 29 (4.75%) C#
4 28 (4.58%) JavaScript
4 28 (4.58%) PowerShell
5 22 (3.60%) Java
6 16 (2.62%) Bash
7 12 (1.96%) TypeScript
8 11 (1.80%) PHP
9 9 (1.47%) C
10 5 (0.82%) C++
11 4 (0.65%) T-SQL
12 2 (0.33%) MATLAB
12 2 (0.33%) Perl
12 2 (0.33%) PL/SQL
12 2 (0.33%) R
12 2 (0.33%) Ruby
12 2 (0.33%) Scala
13 1 (0.16%) JCL
13 1 (0.16%) Shell Script
Qualifications
1 97 (15.88%) Degree
2 29 (4.75%) Master's Degree
3 26 (4.26%) Computer Science Degree
4 19 (3.11%) AWS Certification
5 17 (2.78%) DBS Check
6 15 (2.45%) Microsoft Certification
7 12 (1.96%) Azure Certification
8 11 (1.80%) Security Cleared
9 8 (1.31%) DV Cleared
9 8 (1.31%) PMI Certification
9 8 (1.31%) SAP Certification
10 7 (1.15%) PMP
11 6 (0.98%) Numerate Degree
12 5 (0.82%) ISTQB
13 4 (0.65%) BPSS Clearance
13 4 (0.65%) CCNA
13 4 (0.65%) Cisco Certification
13 4 (0.65%) CompTIA Security+
13 4 (0.65%) Network+ Certification
13 4 (0.65%) PhD
Quality Assurance & Compliance
1 22 (3.60%) QA
2 15 (2.45%) Data Quality
3 14 (2.29%) GDPR
4 11 (1.80%) Accessibility
5 7 (1.15%) ISO/IEC 27001
5 7 (1.15%) WCAG
6 5 (0.82%) HIPAA
7 3 (0.49%) 21 CFR Part 11
7 3 (0.49%) Good Clinical Practice
7 3 (0.49%) NIST
7 3 (0.49%) SLA
8 2 (0.33%) Actionable Recommendations
8 2 (0.33%) NCSC
8 2 (0.33%) PMO
9 1 (0.16%) Cyber Essentials
9 1 (0.16%) ECSS
9 1 (0.16%) SOC 2
9 1 (0.16%) Software Quality Assurance
System Software
1 32 (5.24%) Active Directory
2 26 (4.26%) Docker
3 16 (2.62%) VMware Infrastructure
4 13 (2.13%) Hyper-V
5 6 (0.98%) Virtual Machines
6 4 (0.65%) Embedded Firmware
6 4 (0.65%) Firmware
7 3 (0.49%) Dovecot
7 3 (0.49%) Postfix
8 2 (0.33%) vSphere
9 1 (0.16%) NFS
9 1 (0.16%) Virtual Desktop
9 1 (0.16%) VMware ESXi
Systems Management
1 25 (4.09%) Terraform
2 22 (3.60%) Kubernetes
3 8 (1.31%) Ansible
3 8 (1.31%) Prometheus
4 7 (1.15%) Microsoft Intune
5 4 (0.65%) Failover Clustering
5 4 (0.65%) SCOM
6 3 (0.49%) Progress Chef
6 3 (0.49%) Puppet
6 3 (0.49%) SCCM
7 2 (0.33%) Argo
7 2 (0.33%) Grafana
7 2 (0.33%) SCOrch
7 2 (0.33%) SCSM
8 1 (0.16%) Panaseer
Vendors
1 76 (12.44%) Microsoft
2 24 (3.93%) Google
3 22 (3.60%) VMware
4 15 (2.45%) Salesforce
5 14 (2.29%) Databricks
6 13 (2.13%) SAP
7 12 (1.96%) Adobe
8 10 (1.64%) Cisco
9 7 (1.15%) Omniture
10 6 (0.98%) ServiceNow
11 5 (0.82%) HubSpot
11 5 (0.82%) iManage
11 5 (0.82%) Red Hat
11 5 (0.82%) Teradata
12 4 (0.65%) CheckPoint
12 4 (0.65%) Intapp
13 3 (0.49%) Meraki
13 3 (0.49%) Okta
13 3 (0.49%) Ping Identity
13 3 (0.49%) Sage