Linux Jobs with Hybrid/Remote/WFH Options

Linux
UK > Work from Home

The table below provides summary statistics for permanent remote or hybrid work requiring Linux skills. It includes a benchmarking guide to the annual salaries offered in vacancies that cited Linux over the 6 months leading up to 6 May 2025, comparing them to the same period in the previous two years.

6 months to
6 May 2025
Same period 2024 Same period 2023
Rank 45 33 32
Rank change year-on-year -12 -1 +3
Permanent jobs citing Linux 927 2,228 3,304
As % of all permanent jobs with a WFH option 5.90% 6.59% 7.80%
As % of the Operating Systems category 47.81% 47.40% 50.30%
Number of salaries quoted 570 1,456 2,257
10th Percentile £32,500 £37,500 £37,731
25th Percentile £46,250 £45,000 £47,500
Median annual salary (50th Percentile) £60,000 £58,250 £62,500
Median % change year-on-year +3.00% -6.80% +8.70%
75th Percentile £73,886 £77,500 £82,500
90th Percentile £90,000 £91,934 £100,000
UK median annual salary £60,000 £55,000 £62,500
% change year-on-year +9.09% -12.00% +4.17%

All Operating Systems
Work from Home

Linux falls under the Operating Systems category. For comparison with the information above, the following table provides summary statistics for all permanent job vacancies with remote or hybrid options requiring operating system skills.

Permanent vacancies with a requirement for operating system skills 1,939 4,700 6,568
As % of all permanent jobs with a WFH option 12.34% 13.91% 15.50%
Number of salaries quoted 1,383 3,657 4,814
10th Percentile £29,000 £30,000 £30,666
25th Percentile £36,250 £38,750 £41,250
Median annual salary (50th Percentile) £55,000 £52,500 £55,000
Median % change year-on-year +4.76% -4.55% -
75th Percentile £70,000 £67,500 £75,000
90th Percentile £85,000 £82,500 £92,500
UK median annual salary £47,500 £45,000 £52,500
% change year-on-year +5.56% -14.29% -

Linux
Trend for Jobs with a WFH Option

Job vacancies with remote working options citing Linux as a proportion of all IT jobs advertised.
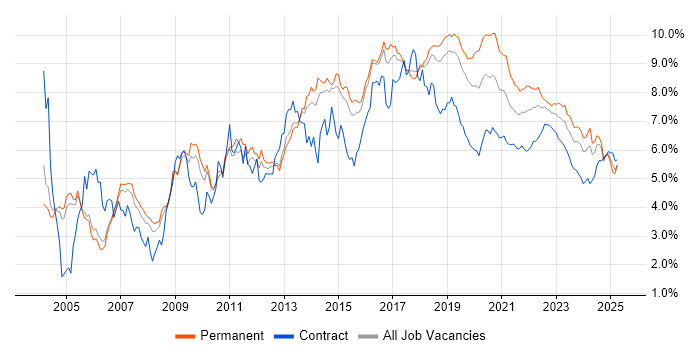
Linux trend for jobs with Hybrid/Remote/WFH options

Linux
Salary Trend for Jobs with a WFH Option

3-month moving average salary quoted in job vacancies with remote working options citing Linux.

Linux salary trend for jobs with a WFH option

Linux
Salary Histogram for Jobs with a WFH Option

Salary distribution for jobs with remote working options citing Linux over the 6 months to 6 May 2025.

Linux salary histogram for jobs with a WFH option

Linux
Co-occurring Skills and Capabilities with WFH Options by Category

The follow tables expand on the table above by listing co-occurrences grouped by category. The same employment type, locality and period is covered with up to 20 co-occurrences shown in each of the following categories:

Application Platforms
1 20 (2.16%) Apache
2 19 (2.05%) IIS
2 19 (2.05%) Microsoft Exchange
3 16 (1.73%) Confluence
4 15 (1.62%) nginx
4 15 (1.62%) Tomcat
5 10 (1.08%) SharePoint
6 9 (0.97%) Apache Airflow
7 7 (0.76%) Apache Spark
8 6 (0.65%) NetWeaver
9 5 (0.54%) Apache Solr
9 5 (0.54%) CMS
10 4 (0.43%) WebSphere
11 3 (0.32%) GemFire
12 2 (0.22%) Drupal
12 2 (0.22%) Oracle SOA Suite
12 2 (0.22%) SAS
12 2 (0.22%) WebSphere Application Server
12 2 (0.22%) WordPress
13 1 (0.11%) ColdFusion
Applications
1 16 (1.73%) Microsoft Excel
2 13 (1.40%) Microsoft Office
3 2 (0.22%) Photoshop
3 2 (0.22%) Simulink
4 1 (0.11%) Microsoft PowerPoint
4 1 (0.11%) Trello
4 1 (0.11%) Weka
Business Applications
1 6 (0.65%) Oracle EBS
2 5 (0.54%) Oracle Subledger Accounting
3 4 (0.43%) Oracle Applications
4 3 (0.32%) Remedy ITSM
4 3 (0.32%) Sage 50
5 2 (0.22%) Oracle ERP
5 2 (0.22%) PeopleSoft HCM
5 2 (0.22%) SAP Oil and Gas
6 1 (0.11%) Oracle Payables
6 1 (0.11%) SAP HCM
Cloud Services
1 436 (47.03%) AWS
2 428 (46.17%) Azure
3 203 (21.90%) GCP
4 82 (8.85%) SaaS
5 73 (7.87%) AWS CloudFormation
5 73 (7.87%) Microsoft 365
6 71 (7.66%) Amazon EKS
7 53 (5.72%) GitHub
8 42 (4.53%) Serverless
9 36 (3.88%) AWS Lambda
10 35 (3.78%) Amazon EC2
11 34 (3.67%) Amazon S3
12 33 (3.56%) PaaS
13 31 (3.34%) Cloud Computing
14 27 (2.91%) Entra ID
15 19 (2.05%) Datadog
16 17 (1.83%) Amazon ECS
16 17 (1.83%) Azure DevOps
17 14 (1.51%) Amazon ECR
17 14 (1.51%) AWS CodeBuild
Communications & Networking
1 92 (9.92%) Firewall
2 78 (8.41%) TCP/IP
3 67 (7.23%) DNS
4 42 (4.53%) DHCP
5 39 (4.21%) VPN
5 39 (4.21%) WAN
6 26 (2.80%) VLAN
7 24 (2.59%) HTTP
8 23 (2.48%) SD-WAN
9 17 (1.83%) Wi-Fi
10 16 (1.73%) Wireless
11 13 (1.40%) 5G
11 13 (1.40%) Network Security
11 13 (1.40%) VSAN
12 12 (1.29%) Bluetooth
12 12 (1.29%) LAN
13 11 (1.19%) Internet
13 11 (1.19%) SAN
14 10 (1.08%) SSH
14 10 (1.08%) VoIP
Database & Business Intelligence
1 84 (9.06%) SQL Server
2 72 (7.77%) Elasticsearch
3 71 (7.66%) PostgreSQL
4 59 (6.36%) NoSQL
5 31 (3.34%) MySQL
6 30 (3.24%) Relational Database
7 25 (2.70%) Amazon RDS
8 24 (2.59%) MongoDB
9 17 (1.83%) Redis
10 15 (1.62%) RDBMS
11 12 (1.29%) Power BI
12 9 (0.97%) Oracle Database
13 8 (0.86%) Big Data
13 8 (0.86%) Metadata
14 7 (0.76%) Oracle Reports
14 7 (0.76%) Tableau
15 5 (0.54%) BusinessObjects
15 5 (0.54%) SAP BW
15 5 (0.54%) SAP Data Services
15 5 (0.54%) SAP HANA
Development Applications
1 139 (14.99%) Git
2 91 (9.82%) Jenkins
3 56 (6.04%) JUnit
4 36 (3.88%) IntelliJ
4 36 (3.88%) Mockito
5 34 (3.67%) JIRA
6 33 (3.56%) GitLab
7 27 (2.91%) Maven
8 22 (2.37%) Eclipse
8 22 (2.37%) Jasmine
8 22 (2.37%) Karma Test Runner
8 22 (2.37%) Protractor
9 17 (1.83%) Cucumber
9 17 (1.83%) SonarQube
9 17 (1.83%) Sonatype Nexus
10 12 (1.29%) Oracle Forms
11 10 (1.08%) Subversion
12 9 (0.97%) Visual Studio
13 7 (0.76%) Artifactory
14 5 (0.54%) IBM UrbanCode
General
1 222 (23.95%) Inclusion and Diversity
2 199 (21.47%) Social Skills
3 196 (21.14%) Finance
4 134 (14.46%) Analytical Skills
5 95 (10.25%) Banking
6 44 (4.75%) Law
7 37 (3.99%) Telecoms
8 29 (3.13%) Presentation Skills
9 28 (3.02%) Manufacturing
10 23 (2.48%) Investment Banking
11 22 (2.37%) Games
12 21 (2.27%) Electronics
12 21 (2.27%) Public Sector
13 18 (1.94%) Legal
14 17 (1.83%) Retail
15 12 (1.29%) Back Office
16 11 (1.19%) Marketing
17 9 (0.97%) Front Office
18 7 (0.76%) Aerospace
18 7 (0.76%) Organisational Skills
Job Titles
1 306 (33.01%) Senior
2 208 (22.44%) Software Engineer
3 181 (19.53%) Developer
4 160 (17.26%) Senior Software Engineer
5 59 (6.36%) Software Developer
6 55 (5.93%) Infrastructure Engineer
7 51 (5.50%) Lead
8 49 (5.29%) Analyst
8 49 (5.29%) Cloud Engineer
8 49 (5.29%) Java Developer
9 46 (4.96%) Administrator
10 42 (4.53%) IT Support
11 34 (3.67%) DevOps Engineer
11 34 (3.67%) Support Analyst
12 32 (3.45%) Embedded Engineer
13 28 (3.02%) Systems Administrator
14 27 (2.91%) C++ Developer
14 27 (2.91%) Senior Developer
15 26 (2.80%) Support Engineer
15 26 (2.80%) Systems Engineer
Libraries, Frameworks & Software Standards
1 191 (20.60%) .NET
2 190 (20.50%) Node.js
3 59 (6.36%) Pandas
4 43 (4.64%) REST
5 37 (3.99%) React
6 35 (3.78%) Hibernate
7 34 (3.67%) RabbitMQ
8 33 (3.56%) AngularJS
8 33 (3.56%) Middleware
9 31 (3.34%) HTML
9 31 (3.34%) Spring
10 27 (2.91%) JPA
10 27 (2.91%) Spring Boot
11 25 (2.70%) CSS
11 25 (2.70%) Web Services
12 21 (2.27%) Django
13 19 (2.05%) Elastic Stack
14 18 (1.94%) JSON
15 16 (1.73%) XML
16 14 (1.51%) JMS
Miscellaneous
1 164 (17.69%) Cyberattack
2 157 (16.94%) Self-Motivation
3 148 (15.97%) Linux Command Line
4 91 (9.82%) Management Information System
5 75 (8.09%) Algorithms
6 57 (6.15%) Data Centre
7 43 (4.64%) Public Cloud
8 26 (2.80%) FPGA
9 24 (2.59%) Hybrid Cloud
10 22 (2.37%) Embedded Systems
10 22 (2.37%) Enterprise Software
11 21 (2.27%) Product Ownership
12 20 (2.16%) Clustering
12 20 (2.16%) Security Posture
13 19 (2.05%) Distributed Systems
14 18 (1.94%) Cloud Native
14 18 (1.94%) Device Driver
14 18 (1.94%) Mobile App
15 17 (1.83%) Credit Derivative
16 16 (1.73%) IoT
Operating Systems
1 302 (32.58%) Windows
2 146 (15.75%) Unix
3 96 (10.36%) Windows Server
4 63 (6.80%) Android
5 58 (6.26%) Red Hat Enterprise Linux
6 28 (3.02%) Ubuntu
7 26 (2.80%) Embedded Linux
8 22 (2.37%) AIX
8 22 (2.37%) CentOS
9 18 (1.94%) Mac OS
10 14 (1.51%) Solaris
11 13 (1.40%) Debian
11 13 (1.40%) Windows Server 2016
12 12 (1.29%) Apple iOS
13 11 (1.19%) Windows 10
14 8 (0.86%) VMS
15 7 (0.76%) Rocky
16 6 (0.65%) Oracle Linux
16 6 (0.65%) Windows Server 2019
17 4 (0.43%) SUSE
Processes & Methodologies
1 316 (34.09%) Agile
2 292 (31.50%) Software Engineering
3 206 (22.22%) CI/CD
3 206 (22.22%) DevOps
4 197 (21.25%) Mentoring
5 192 (20.71%) Problem-Solving
6 180 (19.42%) Microservices
7 156 (16.83%) Cloud Security
8 138 (14.89%) User Experience
9 137 (14.78%) Machine Learning
10 134 (14.46%) Site Reliability Engineering
11 128 (13.81%) Scrum
12 125 (13.48%) Containerisation
13 124 (13.38%) Data Engineering
14 108 (11.65%) Infrastructure as Code
15 101 (10.90%) Computer Science
16 88 (9.49%) ITIL
17 79 (8.52%) Collaborative Working
18 77 (8.31%) OO
19 75 (8.09%) Mathematics
Programming Languages
1 437 (47.14%) Python
2 301 (32.47%) Java
3 293 (31.61%) C++
4 258 (27.83%) JavaScript
5 239 (25.78%) SQL
6 192 (20.71%) Go
7 171 (18.45%) Rust
8 113 (12.19%) C
9 110 (11.87%) Bash
10 94 (10.14%) PowerShell
11 37 (3.99%) Shell Script
12 28 (3.02%) Perl
13 24 (2.59%) PHP
14 22 (2.37%) TypeScript
15 17 (1.83%) C#
16 16 (1.73%) T-SQL
17 14 (1.51%) PL/SQL
18 12 (1.29%) R
19 10 (1.08%) Kotlin
19 10 (1.08%) Swift
Qualifications
1 250 (26.97%) Security Cleared
2 192 (20.71%) DV Cleared
3 150 (16.18%) AWS Certification
4 144 (15.53%) Degree
5 122 (13.16%) AWS Certified Solutions Architect
6 117 (12.62%) AWS Certified Developer
7 57 (6.15%) SC Cleared
8 35 (3.78%) Computer Science Degree
8 35 (3.78%) Microsoft Certification
9 30 (3.24%) Cisco Certification
10 22 (2.37%) PhD
11 20 (2.16%) MCSA
12 17 (1.83%) CCNA
12 17 (1.83%) MCSE
13 16 (1.73%) CCNP
13 16 (1.73%) Master's Degree
14 15 (1.62%) MCP
14 15 (1.62%) Network+ Certification
15 12 (1.29%) CISSP
16 11 (1.19%) ITIL Certification
Quality Assurance & Compliance
1 42 (4.53%) QA
2 23 (2.48%) SLA
3 16 (1.73%) ISO 9001
4 14 (1.51%) GDPR
4 14 (1.51%) ISO/IEC 27001
5 9 (0.97%) Accessibility
5 9 (0.97%) PMO
5 9 (0.97%) Sarbanes-Oxley
6 5 (0.54%) Data Quality
6 5 (0.54%) FINRA
7 3 (0.32%) HIPAA
7 3 (0.32%) JTAG
8 2 (0.22%) Cyber Essentials
8 2 (0.22%) NIST
9 1 (0.11%) ECSS
9 1 (0.11%) ISO 15022
9 1 (0.11%) ISO 20022
System Software
1 194 (20.93%) Docker
2 91 (9.82%) Active Directory
3 76 (8.20%) VMware Infrastructure
4 34 (3.67%) VMware ESXi
5 31 (3.34%) Hyper-V
6 27 (2.91%) Firmware
7 19 (2.05%) Embedded Firmware
8 17 (1.83%) vSphere
9 15 (1.62%) Virtual Machines
10 9 (0.97%) VMware NSX
11 8 (0.86%) Virtual Servers
12 7 (0.76%) Veritas Cluster Server
13 5 (0.54%) Postfix
14 4 (0.43%) KVM
14 4 (0.43%) pfSense
15 3 (0.32%) Dovecot
15 3 (0.32%) EMC RecoverPoint
15 3 (0.32%) Squid
16 2 (0.22%) SRDF
16 2 (0.22%) Xen
Systems Management
1 192 (20.71%) Terraform
2 166 (17.91%) Ansible
3 158 (17.04%) Kubernetes
4 45 (4.85%) Microsoft Intune
5 27 (2.91%) Puppet
6 22 (2.37%) SCCM
7 21 (2.27%) Grafana
8 19 (2.05%) Prometheus
9 17 (1.83%) Progress Chef
10 13 (1.40%) Istio
11 12 (1.29%) Nagios
12 11 (1.19%) AWS Copilot
13 10 (1.08%) SCOM
13 10 (1.08%) Single Sign-On
14 7 (0.76%) CA Endevor
14 7 (0.76%) Failover Clustering
14 7 (0.76%) PaperCut
14 7 (0.76%) vCenter Server
15 6 (0.65%) Kibana
15 6 (0.65%) Red Hat Satellite
Vendors
1 152 (16.40%) Microsoft
2 122 (13.16%) VMware
3 78 (8.41%) Oracle
4 64 (6.90%) Red Hat
5 58 (6.26%) IBM
6 36 (3.88%) Cisco
7 24 (2.59%) Google
8 22 (2.37%) ServiceNow
9 12 (1.29%) Meraki
10 11 (1.19%) Citrix
10 11 (1.19%) Dell
10 11 (1.19%) Fortinet
10 11 (1.19%) SAP
11 10 (1.08%) SolarWinds
12 9 (0.97%) EMC
12 9 (0.97%) HP
12 9 (0.97%) Splunk
13 7 (0.76%) Symantec
13 7 (0.76%) Veeam
14 6 (0.65%) Dynatrace