Data Analysis Jobs

Data Analysis
UK

The table below provides summary statistics for permanent job vacancies requiring Data Analysis skills. It includes a benchmarking guide to the annual salaries offered in vacancies that cited Data Analysis over the 6 months leading up to 30 May 2025, comparing them to the same period in the previous two years.

6 months to
30 May 2025
Same period 2024 Same period 2023
Rank 127 96 128
Rank change year-on-year -31 +32 -5
Permanent jobs citing Data Analysis 1,367 2,772 2,710
As % of all permanent jobs advertised in the UK 2.47% 2.68% 2.79%
As % of the Processes & Methodologies category 2.63% 3.19% 2.92%
Number of salaries quoted 746 1,547 1,300
10th Percentile £31,250 £30,500 £30,500
25th Percentile £41,843 £39,000 £36,250
Median annual salary (50th Percentile) £55,000 £52,500 £52,500
Median % change year-on-year +4.76% - -2.78%
75th Percentile £72,500 £70,000 £72,500
90th Percentile £87,500 £85,000 £86,250
UK excluding London median annual salary £50,055 £50,000 £42,500
% change year-on-year +0.11% +17.65% -7.61%

All Process and Methodology Skills
UK

Data Analysis falls under the Processes and Methodologies category. For comparison with the information above, the following table provides summary statistics for all permanent job vacancies requiring process or methodology skills.

Permanent vacancies with a requirement for process or methodology skills 51,902 86,889 92,846
As % of all permanent jobs advertised in the UK 93.67% 84.13% 95.56%
Number of salaries quoted 25,611 60,763 54,796
10th Percentile £28,822 £29,250 £34,000
25th Percentile £41,250 £40,000 £45,000
Median annual salary (50th Percentile) £57,443 £55,000 £60,899
Median % change year-on-year +4.44% -9.69% +1.50%
75th Percentile £75,000 £72,500 £81,250
90th Percentile £97,500 £92,500 £100,000
UK excluding London median annual salary £51,574 £50,000 £55,000
% change year-on-year +3.15% -9.09% +4.76%

Data Analysis
Job Vacancy Trend

Job postings citing Data Analysis as a proportion of all IT jobs advertised.
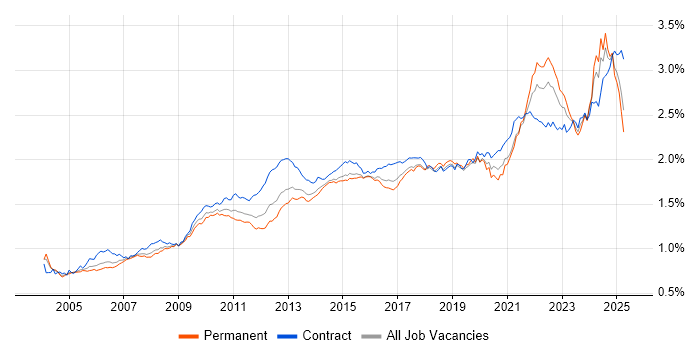
Job vacancy trend for Data Analysis in the UK

Data Analysis
Salary Trend

3-month moving average salary quoted in jobs citing Data Analysis.

Salary trend for Data Analysis in the UK

Data Analysis
Salary Histogram

Salary distribution for jobs citing Data Analysis over the 6 months to 30 May 2025.

Salary histogram for Data Analysis in the UK

Data Analysis
Top 18 Job Locations

The table below looks at the demand and provides a guide to the median salaries quoted in IT jobs citing Data Analysis within the UK over the 6 months to 30 May 2025. The 'Rank Change' column provides an indication of the change in demand within each location based on the same 6 month period last year.

Location Rank Change
on Same Period
Last Year
Matching
Permanent
IT Job Ads
Median Salary
Past 6 Months
Median Salary
% Change
on Same Period
Last Year
Live
Jobs
England -44 1,188 £55,000 +4.76% 3,753
UK excluding London -38 860 £50,055 +0.11% 3,710
Work from Home -32 471 £50,500 -3.81% 1,368
London -11 406 £70,000 +16.67% 582
South East -14 239 £70,000 +40.00% 1,160
North of England -31 228 £50,055 -8.99% 785
North West -33 183 £50,055 -14.80% 356
Midlands -44 176 £46,750 -6.50% 673
West Midlands -59 101 £53,450 +6.90% 365
South West +27 87 £42,500 -22.02% 399
East Midlands +2 75 £39,919 -11.29% 268
Scotland +23 68 £52,500 -4.55% 176
East of England -56 43 £47,500 -5.00% 513
Yorkshire -2 31 £40,000 -20.00% 327
North East +17 14 £60,000 +50.00% 105
Wales +39 13 £75,000 +41.51% 91
Northern Ireland +40 5 £32,500 -43.48% 53
Isle of Man - 1 - - 1

Data Analysis
Co-occurring Skills and Capabilities by Category

The follow tables expand on the table above by listing co-occurrences grouped by category. The same employment type, locality and period is covered with up to 20 co-occurrences shown in each of the following categories:

Application Platforms
1 56 (4.10%) SharePoint
2 29 (2.12%) Jupyter
3 18 (1.32%) Confluence
4 14 (1.02%) CMS
4 14 (1.02%) SAS
5 10 (0.73%) Microsoft Exchange
6 7 (0.51%) ArcGIS
7 6 (0.44%) Apache Spark
8 5 (0.37%) WordPress
9 3 (0.22%) IBM Domino
9 3 (0.22%) nginx
10 2 (0.15%) Apache Airflow
10 2 (0.15%) Drupal
11 1 (0.073%) Sitecore CMS
Applications
1 278 (20.34%) Microsoft Excel
2 69 (5.05%) Microsoft Office
3 44 (3.22%) Microsoft PowerPoint
4 16 (1.17%) Photoshop
4 16 (1.17%) Spreadsheet
5 15 (1.10%) SPSS
6 14 (1.02%) MS Visio
7 8 (0.59%) Blender
8 6 (0.44%) Chatbot
9 5 (0.37%) Microsoft Project
9 5 (0.37%) Revit
9 5 (0.37%) Sketch
10 4 (0.29%) Adobe Creative Suite
11 3 (0.22%) Adobe XD
11 3 (0.22%) AutoCAD
11 3 (0.22%) ProjectWise
12 2 (0.15%) Adobe Illustrator
12 2 (0.15%) Trello
13 1 (0.073%) Oracle Smart View
13 1 (0.073%) SPSS Modeler
Business Applications
1 17 (1.24%) Dynamics CRM
2 14 (1.02%) Raiser’s Edge
3 12 (0.88%) Oracle EBS
4 7 (0.51%) Q-Pulse
5 4 (0.29%) Dynamics AX
5 4 (0.29%) Maximo
5 4 (0.29%) Sage X3
5 4 (0.29%) SAP BPC
5 4 (0.29%) SAP S/4HANA
6 3 (0.22%) Markit EDM
6 3 (0.22%) Oracle ERP
6 3 (0.22%) Workday HCM
7 2 (0.15%) IBM Planning Analytics
7 2 (0.15%) Infor M3
7 2 (0.15%) Infor SunSystems
7 2 (0.15%) iTrent
7 2 (0.15%) NetSuite
7 2 (0.15%) SAP CO
7 2 (0.15%) SAP FI
7 2 (0.15%) SAP Oil and Gas
Cloud Services
1 389 (28.46%) Power Platform
2 239 (17.48%) Azure
3 105 (7.68%) AWS
4 66 (4.83%) Google Analytics
5 58 (4.24%) PowerApps
6 50 (3.66%) Microsoft 365
6 50 (3.66%) Power Automate
7 40 (2.93%) GCP
8 36 (2.63%) SaaS
9 32 (2.34%) Adobe Analytics
9 32 (2.34%) Azure Data Factory
9 32 (2.34%) Azure Synapse Analytics
10 26 (1.90%) Azure DevOps
11 21 (1.54%) Snowflake
12 19 (1.39%) Dynamics 365
12 19 (1.39%) Google Ads
13 18 (1.32%) Microsoft Purview
14 14 (1.02%) Figma
15 13 (0.95%) Canva
15 13 (0.95%) Serverless
Communications & Networking
1 23 (1.68%) Wireshark
2 15 (1.10%) Internet
3 14 (1.02%) Broadband
4 10 (0.73%) Wi-Fi
5 8 (0.59%) Firewall
5 8 (0.59%) Intranet
6 7 (0.51%) DHCP
6 7 (0.51%) DNS
7 6 (0.44%) Network Security
7 6 (0.44%) WAN
8 5 (0.37%) 5G
8 5 (0.37%) SD-WAN
9 4 (0.29%) LoRaWAN
10 3 (0.22%) Ethernet
11 2 (0.15%) ADSL2
12 1 (0.073%) Kerberos
12 1 (0.073%) LAN
12 1 (0.073%) PuTTY
12 1 (0.073%) WPA
Database & Business Intelligence
1 381 (27.87%) Power BI
2 166 (12.14%) Tableau
3 86 (6.29%) Big Data
4 72 (5.27%) Data Warehouse
5 61 (4.46%) Data Lake
6 51 (3.73%) SQL Server
7 36 (2.63%) SQL Server Reporting Services
8 35 (2.56%) Relational Database
9 34 (2.49%) Power Query
10 31 (2.27%) Data Mining
11 29 (2.12%) BusinessObjects
12 25 (1.83%) SQL Server Integration Services
13 19 (1.39%) Metadata
14 17 (1.24%) Azure SQL Database
15 16 (1.17%) NoSQL
15 16 (1.17%) Oracle Reports
16 15 (1.10%) MySQL
17 13 (0.95%) Looker
18 12 (0.88%) BigQuery
19 11 (0.80%) Hadoop
Development Applications
1 55 (4.02%) Rational DOORS
2 34 (2.49%) JIRA
3 15 (1.10%) Git
4 8 (0.59%) GitLab
5 4 (0.29%) SonarQube
5 4 (0.29%) Sonatype Nexus
6 3 (0.22%) ER Studio
6 3 (0.22%) Jenkins
6 3 (0.22%) WaveMaker
7 2 (0.15%) Selenium
7 2 (0.15%) Spinnaker
7 2 (0.15%) Visual Studio Team System
7 2 (0.15%) Visual Website Optimizer
8 1 (0.073%) Axure RP
8 1 (0.073%) Bitbucket
8 1 (0.073%) Katalon Studio
8 1 (0.073%) LabVIEW
8 1 (0.073%) Storybook
General
1 529 (38.70%) Social Skills
2 453 (33.14%) Finance
3 390 (28.53%) Analytical Skills
4 147 (10.75%) Marketing
5 138 (10.10%) Law
6 112 (8.19%) Inclusion and Diversity
7 73 (5.34%) Banking
8 69 (5.05%) Manufacturing
9 64 (4.68%) Electronics
9 64 (4.68%) Retail
10 57 (4.17%) Presentation Skills
11 44 (3.22%) Legal
12 42 (3.07%) Public Sector
13 36 (2.63%) Advertising
14 31 (2.27%) Organisational Skills
15 30 (2.19%) Influencing Skills
16 27 (1.98%) Telecoms
17 17 (1.24%) Automotive
18 15 (1.10%) Billing
18 15 (1.10%) Games
Job Titles
1 501 (36.65%) Analyst
2 191 (13.97%) Lead
3 181 (13.24%) Data Analyst
4 165 (12.07%) Senior
5 127 (9.29%) Business Analyst
6 105 (7.68%) Systems Engineer
7 86 (6.29%) Data Scientist
8 81 (5.93%) Senior Analyst
9 79 (5.78%) Developer
10 63 (4.61%) Data Engineer
11 56 (4.10%) Electronics Engineer
12 39 (2.85%) Financial Analyst
12 39 (2.85%) Senior Data Scientist
13 32 (2.34%) Support Analyst
14 31 (2.27%) Systems Analyst
15 30 (2.19%) Business Intelligence Analyst
16 29 (2.12%) Insight Analyst
17 28 (2.05%) Junior
18 26 (1.90%) Procurement Analyst
19 25 (1.83%) Administrator
Libraries, Frameworks & Software Standards
1 32 (2.34%) PySpark
2 17 (1.24%) CSS
3 16 (1.17%) HTML
4 14 (1.02%) REST
5 13 (0.95%) .NET
5 13 (0.95%) JSON
6 12 (0.88%) XML
7 11 (0.80%) Pandas
7 11 (0.80%) PyTorch
8 10 (0.73%) EDI
8 10 (0.73%) TensorFlow
8 10 (0.73%) Web Services
9 9 (0.66%) NumPy
9 9 (0.66%) Oracle Fusion
9 9 (0.66%) scikit-learn
10 8 (0.59%) Flask
10 8 (0.59%) React
11 7 (0.51%) Django
12 6 (0.44%) RESTful
13 5 (0.37%) Middleware
Miscellaneous
1 110 (8.05%) Management Information System
2 86 (6.29%) Algorithms
3 52 (3.80%) Self-Motivation
4 47 (3.44%) Social Media
5 46 (3.37%) Cyberattack
6 44 (3.22%) Data Structures
7 32 (2.34%) Product Ownership
8 22 (1.61%) Analytical Mindset
9 21 (1.54%) Onboarding
10 18 (1.32%) Legacy Systems
11 15 (1.10%) Driving Licence
11 15 (1.10%) Pricing Data
12 14 (1.02%) Derivative
13 13 (0.95%) FMCG
14 12 (0.88%) IoT
14 12 (0.88%) Reference Data
15 10 (0.73%) NHS
16 9 (0.66%) Security Posture
17 8 (0.59%) Renewable Energy
17 8 (0.59%) Virtual Team
Operating Systems
1 64 (4.68%) Windows
2 43 (3.15%) Linux
3 11 (0.80%) Unix
4 8 (0.59%) Windows Server
5 6 (0.44%) Windows 7
6 5 (0.37%) Windows Vista
7 3 (0.22%) Debian
7 3 (0.22%) Ubuntu
8 2 (0.15%) AIX
8 2 (0.15%) Solaris
Processes & Methodologies
1 429 (31.38%) Analytics
2 376 (27.51%) Problem-Solving
3 345 (25.24%) Business Intelligence
4 300 (21.95%) Visualisation
5 285 (20.85%) Decision-Making
6 227 (16.61%) Agile
7 198 (14.48%) Data Analytics
8 189 (13.83%) Data Management
9 175 (12.80%) Computer Science
10 172 (12.58%) Data Science
11 170 (12.44%) Artificial Intelligence
12 168 (12.29%) Continuous Improvement
13 162 (11.85%) Project Management
14 148 (10.83%) Requirements Gathering
14 148 (10.83%) Stakeholder Management
15 145 (10.61%) Actionable Insight
15 145 (10.61%) Mathematics
16 142 (10.39%) Process Improvement
17 141 (10.31%) Data Visualisation
18 132 (9.66%) Statistics
Programming Languages
1 444 (32.48%) SQL
2 270 (19.75%) Python
3 68 (4.97%) MATLAB
4 61 (4.46%) Java
4 61 (4.46%) JavaScript
5 55 (4.02%) R
6 40 (2.93%) Data Analysis Expressions
7 32 (2.34%) C#
8 31 (2.27%) T-SQL
9 28 (2.05%) VBA
10 26 (1.90%) PowerShell
11 19 (1.39%) C++
12 15 (1.10%) C
13 14 (1.02%) PL/SQL
14 9 (0.66%) TypeScript
15 8 (0.59%) Scala
16 7 (0.51%) Perl
17 6 (0.44%) PHP
18 5 (0.37%) Kusto Query Language
19 3 (0.22%) Bash
Qualifications
1 573 (41.92%) Degree
2 113 (8.27%) BPSS Clearance
3 106 (7.75%) Master's Degree
4 86 (6.29%) Security Cleared
5 75 (5.49%) HND
6 64 (4.68%) HNC
7 58 (4.24%) DBS Check
8 56 (4.10%) DV Cleared
9 47 (3.44%) Computer Science Degree
10 37 (2.71%) Azure Certification
11 32 (2.34%) Numerate Degree
12 26 (1.90%) PMI Certification
13 24 (1.76%) PhD
13 24 (1.76%) PMP
14 23 (1.68%) Chartered Engineer
15 20 (1.46%) MBA
16 18 (1.32%) SC Cleared
17 14 (1.02%) Microsoft Certification
18 12 (0.88%) CBAP
19 11 (0.80%) CIMA
Quality Assurance & Compliance
1 200 (14.63%) Data Quality
2 53 (3.88%) GDPR
3 37 (2.71%) Accessibility
4 28 (2.05%) QA
5 19 (1.39%) Actionable Recommendations
6 14 (1.02%) ISO/IEC 27001
7 12 (0.88%) SLA
8 11 (0.80%) NIST
9 10 (0.73%) GRC
10 7 (0.51%) SOC 1
10 7 (0.51%) SOC 2
11 6 (0.44%) NIST 800
11 6 (0.44%) PMO
12 4 (0.29%) COBIT
12 4 (0.29%) COREP
13 3 (0.22%) EMIR
13 3 (0.22%) IFRS
13 3 (0.22%) MiFID
14 2 (0.15%) California Consumer Privacy Act
14 2 (0.15%) Solvency II
System Software
1 45 (3.29%) Docker
2 15 (1.10%) Virtual Machines
3 8 (0.59%) Active Directory
4 6 (0.44%) Hyper-V
5 4 (0.29%) VMware Infrastructure
6 3 (0.22%) Samba
7 1 (0.073%) Apache Flume
7 1 (0.073%) HDFS
7 1 (0.073%) Virtual Desktop
7 1 (0.073%) vSphere
Systems Management
1 43 (3.15%) Kubernetes
2 19 (1.39%) Terraform
3 9 (0.66%) Ansible
4 8 (0.59%) RSA Archer
5 3 (0.22%) Prometheus
6 2 (0.15%) Grafana
6 2 (0.15%) Oracle RMAN
6 2 (0.15%) Single Sign-On
7 1 (0.073%) Active Directory Federation Services
7 1 (0.073%) Kibana
7 1 (0.073%) logstash
7 1 (0.073%) NetBackup
7 1 (0.073%) Oozie
7 1 (0.073%) Puppet
7 1 (0.073%) vRealize
Vendors
1 295 (21.58%) Microsoft
2 108 (7.90%) Google
3 102 (7.46%) SAP
4 54 (3.95%) Databricks
5 44 (3.22%) Adobe
6 36 (2.63%) Salesforce
7 35 (2.56%) Oracle
8 33 (2.41%) ServiceNow
8 33 (2.41%) Workday
9 24 (1.76%) Facebook
10 22 (1.61%) Concur
11 18 (1.32%) IBM
12 17 (1.24%) Informatica
13 14 (1.02%) Marketo
13 14 (1.02%) Salesforce Marketing Cloud
14 13 (0.95%) Capita
15 8 (0.59%) Alteryx
15 8 (0.59%) VMware
16 7 (0.51%) Splunk
16 7 (0.51%) Zoho