Object-Oriented (OO)
UK

The following table provides summary statistics for permanent job vacancies with a requirement for OO skills. Included is a benchmarking guide to the salaries offered in vacancies that have cited OO over the 6 months to 7 May 2024 with a comparison to the same period in the previous 2 years.

6 months to
7 May 2024
Same period 2023 Same period 2022
Rank 207 118 89
Rank change year-on-year -89 -29 0
Permanent jobs citing OO 1,463 2,980 6,051
As % of all permanent jobs advertised in the UK 1.49% 2.93% 3.84%
As % of the Processes & Methodologies category 1.73% 3.07% 4.02%
Number of salaries quoted 815 1,657 2,267
10th Percentile £35,000 £43,750 £37,500
25th Percentile £41,250 £50,000 £45,000
Median annual salary (50th Percentile) £52,500 £62,500 £60,000
Median % change year-on-year -16.00% +4.17% +9.09%
75th Percentile £69,375 £82,500 £80,000
90th Percentile £93,750 £105,000 £96,250
UK excluding London median annual salary £50,000 £57,500 £52,500
% change year-on-year -13.04% +9.52% +10.53%

All Process and Methodology Skills
UK

OO is in the Processes and Methodologies category. The following table is for comparison with the above and provides summary statistics for all permanent job vacancies with a requirement for process or methodology skills.

Permanent vacancies with a requirement for process or methodology skills 84,403 97,101 150,579
As % of all permanent jobs advertised in the UK 85.70% 95.61% 95.65%
Number of salaries quoted 59,565 57,006 82,680
10th Percentile £29,000 £34,000 £33,515
25th Percentile £40,000 £45,000 £43,750
Median annual salary (50th Percentile) £55,000 £61,180 £60,000
Median % change year-on-year -10.10% +1.97% +9.09%
75th Percentile £72,500 £81,250 £80,000
90th Percentile £92,500 £100,000 £96,750
UK excluding London median annual salary £50,000 £55,000 £52,500
% change year-on-year -9.09% +4.76% +9.38%

OO
Job Vacancy Trend

Job postings citing OO as a proportion of all IT jobs advertised.
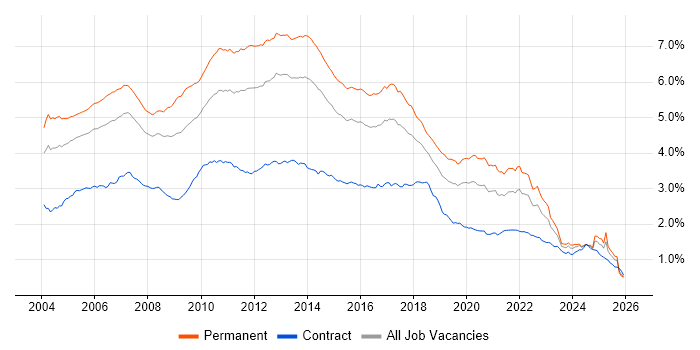
Job vacancy trend for OO in the UK

OO
Salary Trend

3-month moving average salary quoted in jobs citing OO.

Salary trend for OO in the UK

OO
Salary Histogram

Salary distribution for jobs citing OO over the 6 months to 7 May 2024.

Salary histogram for OO in the UK

OO
Top 17 Job Locations

The table below looks at the demand and provides a guide to the median salaries quoted in IT jobs citing OO within the UK over the 6 months to 7 May 2024. The 'Rank Change' column provides an indication of the change in demand within each location based on the same 6 month period last year.

Location Rank Change
on Same Period
Last Year
Matching
Permanent
IT Job Ads
Median Salary
Past 6 Months
Median Salary
% Change
on Same Period
Last Year
Live
Jobs
England -90 1,218 £55,000 -15.38% 330
UK excluding London -67 1,129 £50,000 -13.04% 246
Work from Home -84 550 £50,000 -16.67% 242
London -103 303 £85,000 +6.25% 112
North of England -44 281 £47,500 -17.39% 66
South East -35 278 £52,500 -12.50% 48
North West 0 192 £45,000 -21.74% 33
Scotland -41 189 £55,000 -4.35% 18
Midlands -57 179 £47,500 -17.39% 47
East Midlands -12 111 £45,000 -21.74% 21
South West -108 91 £47,500 -20.83% 20
Yorkshire -40 75 £55,000 -4.35% 26
East of England -55 74 £47,500 -13.64% 34
West Midlands -68 67 £47,500 -17.39% 26
Northern Ireland -21 20 £40,000 -23.81% 8
Wales -33 17 £45,000 -47.06% 10
North East -57 14 £42,500 -22.73% 7

OO
Co-occurring Skills and Capabilities by Category

The follow tables expand on the table above by listing co-occurrences grouped by category. The same employment type, locality and period is covered with up to 20 co-occurrences shown in each of the following categories:

Application Platforms
1 33 (2.26%) Apache
2 23 (1.57%) SharePoint
3 21 (1.44%) CMS
4 16 (1.09%) Confluence
5 15 (1.03%) Apache Spark
6 14 (0.96%) ArcGIS
7 11 (0.75%) NServiceBus
8 8 (0.55%) Apache Pig
8 8 (0.55%) IIS
8 8 (0.55%) nginx
9 7 (0.48%) Apache Airflow
10 6 (0.41%) JBoss
10 6 (0.41%) Oracle Workflow
11 5 (0.34%) Drupal
11 5 (0.34%) WebSphere
12 3 (0.21%) Microsoft Exchange
12 3 (0.21%) SAS
12 3 (0.21%) Tomcat
13 2 (0.14%) Umbraco
14 1 (0.068%) Sitecore CMS
Applications
1 17 (1.16%) Microsoft Excel
2 14 (0.96%) Photoshop
3 11 (0.75%) Microsoft PowerPoint
4 9 (0.62%) Trello
5 8 (0.55%) InfoPath
5 8 (0.55%) Microsoft Office
6 2 (0.14%) MS Visio
6 2 (0.14%) Simulink
Business Applications
1 15 (1.03%) SDL Web 8
2 4 (0.27%) Dynamics CRM
2 4 (0.27%) SAP S/4HANA
3 3 (0.21%) Dynamics AX
3 3 (0.21%) Salesforce CRM
4 2 (0.14%) CiviCRM
4 2 (0.14%) Magento
5 1 (0.068%) Shopify
Cloud Services
1 663 (45.32%) Azure
2 301 (20.57%) AWS
3 248 (16.95%) IBM Cloud
4 190 (12.99%) Azure DevOps
5 175 (11.96%) Serverless
6 166 (11.35%) Azure Service Bus
7 141 (9.64%) Azure Functions
8 137 (9.36%) Azure API Management
8 137 (9.36%) Azure Logic Apps
9 78 (5.33%) GCP
10 42 (2.87%) SaaS
11 34 (2.32%) GitHub
12 24 (1.64%) Amazon S3
12 24 (1.64%) AWS Lambda
13 18 (1.23%) Azure Cosmos DB
13 18 (1.23%) Azure Monitor
14 16 (1.09%) Cloud Computing
15 14 (0.96%) Adobe Creative Cloud
15 14 (0.96%) NuGet
16 12 (0.82%) Azure Data Factory
Communications & Networking
1 28 (1.91%) TCP/IP
2 24 (1.64%) Internet
3 20 (1.37%) Wi-Fi
4 18 (1.23%) HTTP
5 17 (1.16%) MQTT
5 17 (1.16%) SSH
6 13 (0.89%) SNMP
6 13 (0.89%) Wireless
7 12 (0.82%) 3G
7 12 (0.82%) 4G
7 12 (0.82%) FTP
7 12 (0.82%) RS-485
8 5 (0.34%) Bluetooth
9 4 (0.27%) RS-232
9 4 (0.27%) WAN
10 3 (0.21%) 5G
10 3 (0.21%) Kerberos
10 3 (0.21%) SD-WAN
11 2 (0.14%) Firewall
11 2 (0.14%) Modbus
Database & Business Intelligence
1 346 (23.65%) SQL Server
2 331 (22.62%) NoSQL
3 311 (21.26%) MongoDB
3 311 (21.26%) PostgreSQL
4 246 (16.81%) Relational Database
5 238 (16.27%) DB2
6 156 (10.66%) MySQL
7 42 (2.87%) Data Lake
8 39 (2.67%) Qlik Sense
9 28 (1.91%) Elasticsearch
10 27 (1.85%) Azure SQL Database
11 23 (1.57%) GIS
12 20 (1.37%) NonStop SQL
13 19 (1.30%) Geospatial Data
14 18 (1.23%) Big Data
15 16 (1.09%) MariaDB
15 16 (1.09%) Redis
15 16 (1.09%) SQL Server Analysis Services
16 15 (1.03%) Apache Hive
17 12 (0.82%) Hadoop
Development Applications
1 207 (14.15%) Git
2 94 (6.43%) JIRA
3 70 (4.78%) Visual Studio
4 37 (2.53%) Maven
5 34 (2.32%) JUnit
6 33 (2.26%) Jenkins
7 29 (1.98%) Subversion
8 24 (1.64%) NUnit
8 24 (1.64%) Postman
9 20 (1.37%) TeamCity
10 18 (1.23%) Eclipse
10 18 (1.23%) Octopus Deploy
10 18 (1.23%) Sourcetree
10 18 (1.23%) SpecFlow
11 17 (1.16%) JMeter
11 17 (1.16%) Moq
12 16 (1.09%) CMake
12 16 (1.09%) git-flow
13 15 (1.03%) Selenium
14 11 (0.75%) Bitbucket
General
1 274 (18.73%) Inclusion and Diversity
2 268 (18.32%) Public Sector
3 266 (18.18%) Finance
4 233 (15.93%) Social Skills
5 156 (10.66%) Law
6 113 (7.72%) Analytical Skills
7 96 (6.56%) Legal
8 69 (4.72%) Banking
9 54 (3.69%) Marketing
10 50 (3.42%) Investment Banking
11 39 (2.67%) Electronics
12 34 (2.32%) Front Office
13 27 (1.85%) Advertising
14 23 (1.57%) Manufacturing
14 23 (1.57%) Retail
15 22 (1.50%) Prime Brokerage
16 20 (1.37%) Military
17 19 (1.30%) Back Office
18 17 (1.16%) Telecoms
19 16 (1.09%) Pharmaceutical
Job Titles
1 685 (46.82%) Developer
2 367 (25.09%) Software Engineer
3 221 (15.11%) Senior
4 201 (13.74%) .NET Developer
5 181 (12.37%) Full Stack Developer
6 160 (10.94%) Full Stack Engineer
7 138 (9.43%) Azure Developer
8 119 (8.13%) Lead
9 115 (7.86%) Azure Engineer
10 106 (7.25%) PHP Developer
11 79 (5.40%) C# Developer
12 78 (5.33%) Java Engineer
12 78 (5.33%) Senior Software Engineer
13 75 (5.13%) Senior Developer
14 68 (4.65%) Java Software Engineer
15 64 (4.37%) Software Developer
16 57 (3.90%) Data Engineer
17 52 (3.55%) Support Engineer
18 45 (3.08%) Full Stack Software Engineer
19 42 (2.87%) Java Developer
Libraries, Frameworks & Software Standards
1 709 (48.46%) .NET
2 509 (34.79%) AngularJS
2 509 (34.79%) HTML
3 491 (33.56%) ASP.NET
4 470 (32.13%) CSS
5 446 (30.49%) React
6 397 (27.14%) Web Services
7 383 (26.18%) REST
8 352 (24.06%) Twitter Bootstrap
9 348 (23.79%) Vue
10 331 (22.62%) jQuery
11 251 (17.16%) .NET Core
12 245 (16.75%) ASP.NET Core
13 241 (16.47%) Ember.js
14 238 (16.27%) Backbone.js
15 210 (14.35%) .NET Framework
16 199 (13.60%) Entity Framework
17 193 (13.19%) ASP.NET MVC
18 172 (11.76%) Node.js
19 159 (10.87%) ASP.NET Web API
Miscellaneous
1 386 (26.38%) Algorithms
2 279 (19.07%) Data Structures
3 249 (17.02%) Hybrid Cloud
4 248 (16.95%) Blockchain
5 121 (8.27%) e-Learning
6 90 (6.15%) Onboarding
7 85 (5.81%) Greenfield Project
8 56 (3.83%) Cloud Native
9 34 (2.32%) Social Media
9 34 (2.32%) Social Network
10 33 (2.26%) BBC
11 31 (2.12%) Self-Motivation
12 28 (1.91%) Mobile App
13 27 (1.85%) Enterprise Software
14 25 (1.71%) Product Ownership
15 24 (1.64%) Distributed Systems
16 22 (1.50%) Hedge funds
16 22 (1.50%) Management Information System
17 19 (1.30%) Analytical Mindset
17 19 (1.30%) Life Science
Operating Systems
1 424 (28.98%) Linux
2 335 (22.90%) Windows
3 257 (17.57%) Android
4 255 (17.43%) Apple iOS
5 25 (1.71%) Embedded Linux
6 24 (1.64%) Unix
7 22 (1.50%) AIX
8 9 (0.62%) VMS
9 6 (0.41%) Mac OS
9 6 (0.41%) Windows 10
10 4 (0.27%) FreeRTOS
11 2 (0.14%) Ubuntu
12 1 (0.068%) CentOS
12 1 (0.068%) Red Hat Enterprise Linux
12 1 (0.068%) Solaris
12 1 (0.068%) Windows Server
12 1 (0.068%) Windows Server 2019
Processes & Methodologies
1 796 (54.41%) Agile
2 585 (39.99%) OOP
3 583 (39.85%) Full Stack Development
4 521 (35.61%) MVC
5 502 (34.31%) Software Engineering
6 422 (28.84%) Design Patterns
7 377 (25.77%) Artificial Intelligence
8 340 (23.24%) DevOps
9 331 (22.62%) Web Development
10 328 (22.42%) SOLID
11 295 (20.16%) User Experience
12 273 (18.66%) MVVM
13 266 (18.18%) Problem-Solving
14 261 (17.84%) SDLC
15 252 (17.22%) Responsive Web Design
16 249 (17.02%) Microservices
17 248 (16.95%) Computer Science
18 247 (16.88%) Mentoring
19 239 (16.34%) Co-Creation
20 238 (16.27%) Design Thinking
Programming Languages
1 813 (55.57%) C#
2 742 (50.72%) JavaScript
3 626 (42.79%) SQL
4 521 (35.61%) Java
5 425 (29.05%) Python
6 164 (11.21%) C++
7 129 (8.82%) PHP
8 114 (7.79%) C
9 79 (5.40%) TypeScript
10 58 (3.96%) T-SQL
11 31 (2.12%) VB
12 27 (1.85%) PowerShell
13 26 (1.78%) Bash
13 26 (1.78%) Perl
14 24 (1.64%) Go
15 22 (1.50%) Groovy
15 22 (1.50%) XPath
16 20 (1.37%) Scala
17 17 (1.16%) Bicep
17 17 (1.16%) Fortran
Qualifications
1 303 (20.71%) Degree
2 127 (8.68%) Computer Science Degree
3 55 (3.76%) Security Cleared
4 46 (3.14%) Master's Degree
5 27 (1.85%) SC Cleared
6 26 (1.78%) PhD
7 10 (0.68%) HND
8 9 (0.62%) DV Cleared
9 7 (0.48%) BPSS Clearance
9 7 (0.48%) ISTQB
10 6 (0.41%) Numerate Degree
11 5 (0.34%) HNC
12 3 (0.21%) Microsoft Certification
12 3 (0.21%) PMI Certification
13 2 (0.14%) Azure Certification
14 1 (0.068%) DBS Check
14 1 (0.068%) ISEB
14 1 (0.068%) MCP
14 1 (0.068%) Postgraduate
14 1 (0.068%) TOGAF Certification
Quality Assurance & Compliance
1 69 (4.72%) QA
2 14 (0.96%) GDPR
3 13 (0.89%) PMO
4 10 (0.68%) Accessibility
4 10 (0.68%) Data Quality
5 8 (0.55%) MISRA
6 5 (0.34%) NCSC
7 4 (0.27%) DICOM
7 4 (0.27%) HL7
7 4 (0.27%) ISO 13485
7 4 (0.27%) MISRA C
8 3 (0.21%) MiFID
9 2 (0.14%) IEC 61508
9 2 (0.14%) ISO/IEC 12207
9 2 (0.14%) SEPA
10 1 (0.068%) Cyber Essentials
10 1 (0.068%) EMIR
10 1 (0.068%) HMG Security Policy Framework
10 1 (0.068%) ISO 9000
10 1 (0.068%) SLA
System Software
1 90 (6.15%) Docker
2 25 (1.71%) Active Directory
3 18 (1.23%) Firmware
4 10 (0.68%) Embedded Firmware
4 10 (0.68%) Virtual Machines
5 8 (0.55%) HDFS
6 2 (0.14%) NFS
6 2 (0.14%) VMware Infrastructure
7 1 (0.068%) Hyper-V
7 1 (0.068%) Microsoft Virtual Server
7 1 (0.068%) Virtual Servers
7 1 (0.068%) VMware ESXi
Systems Management
1 66 (4.51%) Kubernetes
2 56 (3.83%) Terraform
3 13 (0.89%) WMI
4 6 (0.41%) CloudHub
5 3 (0.21%) Prometheus
6 2 (0.14%) Ansible
6 2 (0.14%) Istio
6 2 (0.14%) linkerd
7 1 (0.068%) Grafana
7 1 (0.068%) Hadoop YARN
7 1 (0.068%) Kiali
7 1 (0.068%) Podman
7 1 (0.068%) Progress Chef
7 1 (0.068%) Puppet
7 1 (0.068%) SCCM
Vendors
1 295 (20.16%) Microsoft
2 250 (17.09%) IBM
3 248 (16.95%) Red Hat
4 112 (7.66%) Oracle
5 69 (4.72%) Google
6 39 (2.67%) Alteryx
7 37 (2.53%) Apple
8 34 (2.32%) Sony
9 33 (2.26%) Facebook
9 33 (2.26%) Yahoo!
10 19 (1.30%) Salesforce
11 16 (1.09%) Adobe
12 15 (1.03%) Databricks
13 14 (0.96%) Atlassian
13 14 (0.96%) Cognizant
13 14 (0.96%) SAP
13 14 (0.96%) Splunk
14 9 (0.62%) MuleSoft
15 8 (0.55%) ESRI
16 7 (0.48%) Sybase