Senior Jobs with Hybrid/Remote/WFH Options

Senior
UK > Work from Home

The median Senior salary for remote or hybrid work is £67,500 per year, according to job vacancies posted during the 6 months leading to 23 May 2025.

The table below provides salary benchmarking and summary statistics, comparing them to the same period in the previous two years.

6 months to
23 May 2025
Same period 2024 Same period 2023
Rank 9 7 9
Rank change year-on-year -2 +2 -1
Permanent jobs requiring a Senior 2,848 6,169 6,633
As % of all permanent jobs with a WFH option 15.38% 18.24% 16.48%
As % of the Job Titles category 16.84% 18.97% 17.18%
Number of salaries quoted 1,406 4,386 4,765
10th Percentile £48,869 £45,000 £48,750
25th Percentile £55,184 £52,500 £56,691
Median annual salary (50th Percentile) £67,500 £64,080 £70,000
Median % change year-on-year +5.34% -8.46% -
75th Percentile £85,000 £77,500 £87,500
90th Percentile £113,125 £95,000 £101,250
UK median annual salary £61,500 £62,500 £70,000
% change year-on-year -1.60% -10.71% -

All Permanent IT Job Vacancies
Work from Home

For comparison with the information above, the following table provides summary statistics for all permanent IT job vacancies with WFH or hybrid options. Most job vacancies include a discernible job title that can be normalized. As such, the figures in the second row provide an indication of the number of permanent jobs in our overall sample.

Permanent vacancies in Work from Home with a recognized job title 16,909 32,512 38,613
% of permanent jobs with a recognized job title 91.32% 96.13% 95.95%
Number of salaries quoted 9,294 24,868 27,420
10th Percentile £28,000 £33,250 £36,750
25th Percentile £42,000 £42,500 £47,500
Median annual salary (50th Percentile) £57,500 £56,451 £62,500
Median % change year-on-year +1.86% -9.68% +4.17%
75th Percentile £76,250 £75,000 £81,250
90th Percentile £100,000 £93,750 £100,000
UK median annual salary £56,000 £52,500 £60,000
% change year-on-year +6.67% -12.50% -

Senior
Trend for Jobs with a WFH Option

Job vacancies with remote working options which featured Senior in the job title as a proportion of all IT jobs advertised.
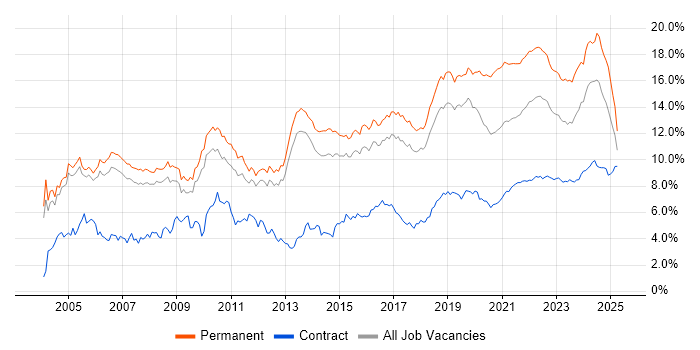
Senior trend for jobs with Hybrid/Remote/WFH options

Senior
Salary Trend for Jobs with a WFH Option

3-month moving average salary quoted in job vacancies with remote working options citing Senior.

Senior salary trend for jobs with a WFH option

Senior
Salary Histogram for Jobs with a WFH Option

Salary distribution for jobs with remote working options citing Senior over the 6 months to 23 May 2025.

Senior salary histogram for jobs with a WFH option

Senior Skill Set
Top 30 Co-occurring Skills and Capabilities in Job Vacancies with WFH Options

For the 6 months to 23 May 2025, Senior job roles required the following skills and capabilities in order of popularity. The figures indicate the absolute number co-occurrences and as a proportion of all permanent jobs with hybrid or remote work options featuring Senior in the job title.

1 1,167 (40.98%) Agile
2 959 (33.67%) Python
3 906 (31.81%) AWS
4 805 (28.27%) Azure
5 801 (28.13%) Mentoring
6 767 (26.93%) Problem-Solving
7 713 (25.04%) Software Engineering
8 628 (22.05%) Social Skills
9 626 (21.98%) Degree
10 598 (21.00%) Finance
11 594 (20.86%) Broadband
12 576 (20.22%) CI/CD
13 560 (19.66%) JavaScript
14 550 (19.31%) GCP
15 539 (18.93%) TypeScript
16 508 (17.84%) Machine Learning
17 493 (17.31%) Artificial Intelligence
18 448 (15.73%) Self-Motivation
19 432 (15.17%) Analytical Skills
20 424 (14.89%) Java
21 410 (14.40%) Serverless
22 395 (13.87%) AWS Lambda
23 391 (13.73%) SQL
24 384 (13.48%) .NET
24 384 (13.48%) Clean Code
25 373 (13.10%) Games
26 371 (13.03%) User Experience
27 369 (12.96%) Microservices
28 364 (12.78%) Inclusion and Diversity
29 347 (12.18%) Linux

Senior Skill Set
Co-occurring Skills and Capabilities with WFH Options by Category

The follow tables expand on the table above by listing co-occurrences grouped by category. The same employment type, locality and period is covered with up to 20 co-occurrences shown in each of the following categories:

Application Platforms
1 77 (2.70%) Apache
2 66 (2.32%) Apache Airflow
3 47 (1.65%) Apache Spark
4 36 (1.26%) Microsoft Exchange
5 33 (1.16%) SharePoint
6 24 (0.84%) Jupyter
7 22 (0.77%) Confluence
8 12 (0.42%) CMS
9 10 (0.35%) IIS
10 9 (0.32%) SAS
11 6 (0.21%) nginx
12 4 (0.14%) Umbraco
13 3 (0.11%) Apache Solr
14 2 (0.070%) Headless CMS
14 2 (0.070%) NetWeaver
14 2 (0.070%) OpenStack
14 2 (0.070%) WordPress
15 1 (0.035%) ArcGIS
15 1 (0.035%) Drupal
15 1 (0.035%) EPiServer
Applications
1 49 (1.72%) Microsoft Office
2 40 (1.40%) Simulink
3 36 (1.26%) Microsoft Excel
4 11 (0.39%) Microsoft PowerPoint
5 6 (0.21%) AutoCAD
6 5 (0.18%) Spreadsheet
6 5 (0.18%) Stata
7 4 (0.14%) MS Visio
7 4 (0.14%) SOLIDWORKS
8 2 (0.070%) Adobe XD
8 2 (0.070%) Chatbot
8 2 (0.070%) Microsoft Project
8 2 (0.070%) Sketch
9 1 (0.035%) Maya
9 1 (0.035%) MicroStation
9 1 (0.035%) MotionBuilder
Business Applications
1 29 (1.02%) Dynamics CRM
2 11 (0.39%) NetSuite
3 8 (0.28%) Oracle EBS
4 7 (0.25%) Oracle ERP
4 7 (0.25%) SAP S/4HANA
5 3 (0.11%) Dynamics AX
5 3 (0.11%) Salesforce CRM
6 2 (0.070%) PeopleSoft HCM
7 1 (0.035%) ION Anvil
7 1 (0.035%) Oracle Applications
7 1 (0.035%) Oracle EBS R12
7 1 (0.035%) Oracle SCM
7 1 (0.035%) Payment Gateway
7 1 (0.035%) Raiser’s Edge
7 1 (0.035%) Remedy ITSM
7 1 (0.035%) SAP CO
7 1 (0.035%) SAP ERP
7 1 (0.035%) SAP FI
7 1 (0.035%) SAP FI/CO
7 1 (0.035%) SAP GRC
Cloud Services
1 906 (31.81%) AWS
2 805 (28.27%) Azure
3 550 (19.31%) GCP
4 410 (14.40%) Serverless
5 395 (13.87%) AWS Lambda
6 157 (5.51%) SaaS
7 119 (4.18%) Amazon S3
8 114 (4.00%) Power Platform
9 78 (2.74%) GitHub
10 75 (2.63%) AWS Step Functions
11 73 (2.56%) dbt
12 70 (2.46%) Snowflake
13 66 (2.32%) Azure DevOps
13 66 (2.32%) Microsoft 365
14 48 (1.69%) Dynamics 365
15 41 (1.44%) Amazon EC2
16 35 (1.23%) Amazon ECS
16 35 (1.23%) AWS CloudFormation
17 32 (1.12%) Amazon EKS
18 31 (1.09%) PowerApps
Communications & Networking
1 594 (20.86%) Broadband
2 43 (1.51%) Firewall
3 42 (1.47%) TCP/IP
4 29 (1.02%) HTTP
5 27 (0.95%) DNS
6 26 (0.91%) Wireless
7 23 (0.81%) VPN
8 22 (0.77%) WAN
9 18 (0.63%) Bluetooth
10 17 (0.60%) OSPF
11 14 (0.49%) BGP
11 14 (0.49%) Modbus
12 13 (0.46%) 5G
12 13 (0.46%) Internet
12 13 (0.46%) IPsec
13 12 (0.42%) RS-232
14 11 (0.39%) SSL
15 10 (0.35%) Network Security
15 10 (0.35%) SSH
16 9 (0.32%) Wi-Fi
Database & Business Intelligence
1 126 (4.42%) DynamoDB
2 112 (3.93%) SQL Server
3 106 (3.72%) Elasticsearch
4 91 (3.20%) Big Data
5 85 (2.98%) Power BI
6 74 (2.60%) Data Lake
7 69 (2.42%) PostgreSQL
8 56 (1.97%) NoSQL
9 55 (1.93%) Amazon Athena
9 55 (1.93%) Tableau
10 54 (1.90%) MySQL
11 49 (1.72%) Apache Arrow
11 49 (1.72%) Apache Iceberg
11 49 (1.72%) Apache Ignite
11 49 (1.72%) Dremio
12 48 (1.69%) Data Warehouse
13 42 (1.47%) SQL Server Reporting Services
14 41 (1.44%) Relational Database
15 36 (1.26%) MongoDB
15 36 (1.26%) SQL Server Integration Services
Development Applications
1 202 (7.09%) Git
2 87 (3.05%) Jenkins
3 69 (2.42%) JIRA
4 42 (1.47%) Visual Studio
5 32 (1.12%) Maven
6 31 (1.09%) JUnit
7 24 (0.84%) GitLab
8 22 (0.77%) Selenium
9 17 (0.60%) SonarQube
10 16 (0.56%) Cucumber
11 15 (0.53%) Sonatype Nexus
12 14 (0.49%) IntelliJ
12 14 (0.49%) Mockito
13 11 (0.39%) webpack
14 8 (0.28%) Bitbucket
14 8 (0.28%) Gradle
14 8 (0.28%) NUnit
14 8 (0.28%) Subversion
15 7 (0.25%) Cypress.io
15 7 (0.25%) Moq
General
1 628 (22.05%) Social Skills
2 598 (21.00%) Finance
3 432 (15.17%) Analytical Skills
4 373 (13.10%) Games
5 364 (12.78%) Inclusion and Diversity
6 277 (9.73%) Banking
7 116 (4.07%) Retail
8 103 (3.62%) Marketing
9 81 (2.84%) Advertising
10 80 (2.81%) Legal
11 79 (2.77%) Presentation Skills
12 74 (2.60%) Law
13 70 (2.46%) Front Office
14 59 (2.07%) Electronics
15 55 (1.93%) Aerospace
15 55 (1.93%) Public Sector
15 55 (1.93%) Telecoms
16 52 (1.83%) Investment Banking
17 34 (1.19%) Tech for Good
18 33 (1.16%) Manufacturing
Libraries, Frameworks & Software Standards
1 384 (13.48%) .NET
2 335 (11.76%) GraphQL
3 298 (10.46%) React
4 287 (10.08%) Node.js
5 216 (7.58%) WebGL
6 215 (7.55%) Unity (Game Engine)
7 137 (4.81%) HTML
8 91 (3.20%) AngularJS
8 91 (3.20%) CSS
9 85 (2.98%) RESTful
10 72 (2.53%) .NET Framework
10 72 (2.53%) Serverless Framework
11 65 (2.28%) Kafka
12 64 (2.25%) Pandas
13 63 (2.21%) .NET Core
13 63 (2.21%) REST
14 57 (2.00%) Spring
15 51 (1.79%) gRPC
16 49 (1.72%) Protocol Buffers
16 49 (1.72%) SciPy
Miscellaneous
1 448 (15.73%) Self-Motivation
2 218 (7.65%) Animation
3 203 (7.13%) Cyberattack
4 184 (6.46%) Linux Command Line
5 141 (4.95%) Product Ownership
6 140 (4.92%) Management Information System
7 83 (2.91%) Algorithms
8 79 (2.77%) Video\Live Streaming
9 58 (2.04%) Derivative
10 57 (2.00%) Foreign Exchange (FX)
11 54 (1.90%) Fixed Income
12 53 (1.86%) Cloud Native
12 53 (1.86%) Distributed Systems
12 53 (1.86%) Driving Licence
13 51 (1.79%) Mobile App
14 50 (1.76%) Digital Media
14 50 (1.76%) Hedge funds
15 49 (1.72%) Equities
15 49 (1.72%) Marketing Technology
16 40 (1.40%) Pricing Data
Operating Systems
1 347 (12.18%) Linux
2 115 (4.04%) Windows
3 54 (1.90%) Unix
4 21 (0.74%) Android
5 20 (0.70%) Apple iOS
5 20 (0.70%) Windows Server
6 15 (0.53%) Embedded Linux
7 7 (0.25%) zOS
8 6 (0.21%) FreeRTOS
8 6 (0.21%) Windows Server 2016
9 5 (0.18%) Mac OS
9 5 (0.18%) VMS
9 5 (0.18%) Windows 10
10 4 (0.14%) Red Hat Enterprise Linux
10 4 (0.14%) Ubuntu
11 3 (0.11%) AIX
11 3 (0.11%) CentOS
11 3 (0.11%) Robot Operating System
11 3 (0.11%) Solaris
12 2 (0.070%) Windows Server 2019
Processes & Methodologies
1 1,167 (40.98%) Agile
2 801 (28.13%) Mentoring
3 767 (26.93%) Problem-Solving
4 713 (25.04%) Software Engineering
5 576 (20.22%) CI/CD
6 508 (17.84%) Machine Learning
7 493 (17.31%) Artificial Intelligence
8 384 (13.48%) Clean Code
9 371 (13.03%) User Experience
10 369 (12.96%) Microservices
11 338 (11.87%) Prototyping
12 320 (11.24%) Data Science
13 315 (11.06%) DevOps
13 315 (11.06%) Project Management
14 264 (9.27%) Storytelling
15 254 (8.92%) Scrum
16 238 (8.36%) Performance Metrics
17 234 (8.22%) Creative Thinking
18 228 (8.01%) Data Engineering
19 223 (7.83%) Computer Science
Programming Languages
1 959 (33.67%) Python
2 560 (19.66%) JavaScript
3 539 (18.93%) TypeScript
4 424 (14.89%) Java
5 391 (13.73%) SQL
6 290 (10.18%) C++
7 236 (8.29%) C#
8 216 (7.58%) Go
9 215 (7.55%) HLSL
10 182 (6.39%) Rust
11 96 (3.37%) C
12 53 (1.86%) PHP
13 52 (1.83%) PowerShell
14 44 (1.54%) T-SQL
15 39 (1.37%) PL/SQL
16 38 (1.33%) Bash
17 30 (1.05%) Scala
18 29 (1.02%) R
19 21 (0.74%) VB.NET
20 17 (0.60%) Embedded C
Qualifications
1 626 (21.98%) Degree
2 315 (11.06%) Security Cleared
3 284 (9.97%) AWS Certification
4 222 (7.79%) PhD
5 212 (7.44%) DV Cleared
6 192 (6.74%) AWS Certified Solutions Architect
7 179 (6.29%) AWS Certified Developer
8 154 (5.41%) Computer Science Degree
9 85 (2.98%) SC Cleared
10 67 (2.35%) DBS Check
11 63 (2.21%) BPSS Clearance
12 41 (1.44%) Master's Degree
13 37 (1.30%) Chartered Engineer
14 36 (1.26%) Azure Certification
15 30 (1.05%) MRICS
16 26 (0.91%) CISSP
17 25 (0.88%) Microsoft Certification
18 20 (0.70%) CISA
19 15 (0.53%) PMI Certification
20 13 (0.46%) PMP
Quality Assurance & Compliance
1 133 (4.67%) Accessibility
2 90 (3.16%) QA
3 46 (1.62%) Data Quality
4 30 (1.05%) GDPR
5 20 (0.70%) ITGC
6 19 (0.67%) NIST
7 17 (0.60%) ISO/IEC 27001
8 13 (0.46%) PMO
9 12 (0.42%) SLA
10 11 (0.39%) NCSC
11 10 (0.35%) HIPAA
12 8 (0.28%) CDISC
13 7 (0.25%) Actionable Recommendations
13 7 (0.25%) GRC
14 6 (0.21%) Sarbanes-Oxley
15 5 (0.18%) Cyber Essentials
16 4 (0.14%) COREP
16 4 (0.14%) PCI DSS
17 3 (0.11%) JTAG
18 2 (0.070%) WCAG
System Software
1 176 (6.18%) Docker
2 43 (1.51%) Firmware
3 38 (1.33%) Active Directory
4 33 (1.16%) Embedded Firmware
5 30 (1.05%) VMware Infrastructure
6 8 (0.28%) Hyper-V
6 8 (0.28%) Virtual Machines
6 8 (0.28%) VMware ESXi
7 4 (0.14%) VMware NSX
8 3 (0.11%) Veritas Cluster Server
8 3 (0.11%) Virtual Desktop
8 3 (0.11%) vSphere
9 2 (0.070%) Oracle RAC
10 1 (0.035%) IAG
10 1 (0.035%) NFS
10 1 (0.035%) Squid
10 1 (0.035%) Virtual Servers
10 1 (0.035%) XenApp
Systems Management
1 194 (6.81%) Kubernetes
2 168 (5.90%) Terraform
3 89 (3.13%) Ansible
4 22 (0.77%) Prometheus
5 19 (0.67%) Microsoft Intune
6 18 (0.63%) Grafana
7 17 (0.60%) Istio
8 15 (0.53%) Single Sign-On
9 12 (0.42%) SCCM
10 11 (0.39%) Argo
10 11 (0.39%) AWS Copilot
11 10 (0.35%) Failover Clustering
12 7 (0.25%) Progress Chef
12 7 (0.25%) Puppet
13 5 (0.18%) ITRS Geneos
13 5 (0.18%) Nagios
13 5 (0.18%) SCOM
14 4 (0.14%) SCOrch
15 2 (0.070%) EMC NetWorker
15 2 (0.070%) Packer
Vendors
1 274 (9.62%) Microsoft
2 124 (4.35%) ServiceNow
3 104 (3.65%) Google
4 73 (2.56%) Databricks
5 66 (2.32%) Oracle
6 49 (1.72%) Cisco
7 42 (1.47%) VMware
8 40 (1.40%) IBM
8 40 (1.40%) MathWorks
9 34 (1.19%) SAP
10 29 (1.02%) Salesforce
11 20 (0.70%) Apple
11 20 (0.70%) SolarWinds
12 12 (0.42%) Adobe
12 12 (0.42%) Dell
12 12 (0.42%) EMC
13 10 (0.35%) CheckPoint
13 10 (0.35%) Meraki
13 10 (0.35%) MuleSoft
14 9 (0.32%) Aderant