Atlassian Jobs

Atlassian
UK

The table below provides summary statistics for permanent job vacancies requiring knowledge or experience of Atlassian products and/or services. It includes a benchmarking guide to the annual salaries offered in vacancies that cited Atlassian over the 6 months leading up to 14 May 2025, comparing them to the same period in the previous two years.

The figures below represent the IT labour market in general and are not representative of salaries within Atlassian Software Systems.

6 months to
14 May 2025
Same period 2024 Same period 2023
Rank 542 628 524
Rank change year-on-year +86 -104 +88
Permanent jobs citing Atlassian 173 261 537
As % of all permanent jobs advertised in the UK 0.31% 0.26% 0.53%
As % of the Vendors category 0.84% 0.72% 1.27%
Number of salaries quoted 104 196 234
10th Percentile £45,150 £40,750 £47,500
25th Percentile £54,793 £47,250 £53,970
Median annual salary (50th Percentile) £60,000 £65,000 £65,000
Median % change year-on-year -7.69% - +4.84%
75th Percentile £70,313 £75,772 £87,188
90th Percentile £77,500 £87,500 £102,625
UK excluding London median annual salary £62,500 £60,000 £57,810
% change year-on-year +4.17% +3.79% +10.11%

All Vendors
UK

Atlassian falls under the Vendor Products and Services category. For comparison with the information above, the following table provides summary statistics for all permanent job vacancies requiring knowledge or experience of all vendor products and services.

Permanent vacancies with a requirement for knowledge or experience of vendor products and services 20,610 36,256 42,369
As % of all permanent jobs advertised in the UK 37.41% 36.61% 41.86%
Number of salaries quoted 11,805 24,865 24,278
10th Percentile £26,312 £26,700 £31,250
25th Percentile £37,500 £36,000 £41,250
Median annual salary (50th Percentile) £55,000 £50,000 £57,500
Median % change year-on-year +10.00% -13.04% +4.55%
75th Percentile £70,600 £68,750 £75,000
90th Percentile £90,000 £87,500 £92,500
UK excluding London median annual salary £50,000 £45,000 £50,000
% change year-on-year +11.11% -10.00% +5.26%

Atlassian
Job Vacancy Trend

Job postings citing Atlassian as a proportion of all IT jobs advertised.
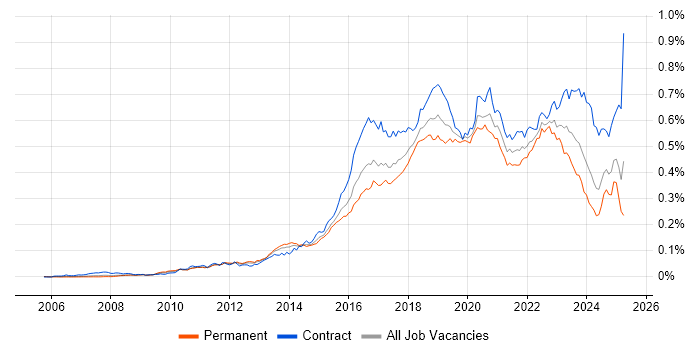
Job vacancy trend for Atlassian in the UK

Atlassian
Salary Trend

3-month moving average salary quoted in jobs citing Atlassian.

Salary trend for Atlassian in the UK

Atlassian
Salary Histogram

Salary distribution for jobs citing Atlassian over the 6 months to 14 May 2025.

Salary histogram for Atlassian in the UK

Atlassian
Top 15 Job Locations

The table below looks at the demand and provides a guide to the median salaries quoted in IT jobs citing Atlassian within the UK over the 6 months to 14 May 2025. The 'Rank Change' column provides an indication of the change in demand within each location based on the same 6 month period last year.

Location Rank Change
on Same Period
Last Year
Matching
Permanent
IT Job Ads
Median Salary
Past 6 Months
Median Salary
% Change
on Same Period
Last Year
Live
Jobs
England +86 163 £60,000 -7.69% 147
UK excluding London +144 133 £62,500 +4.17% 111
North of England +57 52 £57,560 -22.01% 29
North West +25 42 £57,560 -22.01% 15
South East +102 32 £75,000 +66.67% 45
London +60 31 £60,000 -11.53% 59
Midlands +75 30 £72,500 -1.77% 14
Work from Home +57 25 £61,250 -17.01% 166
West Midlands +61 21 £72,500 -1.77% 12
South West +93 9 £60,000 +17.07% 14
East Midlands +40 9 - -
Yorkshire +66 8 £74,870 +1.44% 7
Wales +40 5 £70,000 -30.00%
East of England +32 5 £60,000 - 3
North East +39 2 £60,750 -17.69% 7

Atlassian
Co-occurring Skills and Capabilities by Category

The follow tables expand on the table above by listing co-occurrences grouped by category. The same employment type, locality and period is covered with up to 20 co-occurrences shown in each of the following categories:

Application Platforms
1 115 (66.47%) Confluence
2 5 (2.89%) Microsoft Exchange
3 4 (2.31%) CMS
4 3 (1.73%) Headless CMS
5 2 (1.16%) SharePoint
6 1 (0.58%) Tomcat
Applications
1 5 (2.89%) Microsoft Excel
2 3 (1.73%) Microsoft Office
3 1 (0.58%) Microsoft PowerPoint
3 1 (0.58%) MS Visio
3 1 (0.58%) Trello
3 1 (0.58%) Zeplin
Business Applications
1 5 (2.89%) Fidessa
2 2 (1.16%) Dynamics NAV
2 2 (1.16%) SAP S/4HANA
3 1 (0.58%) SAP IBP
3 1 (0.58%) SAP PP
3 1 (0.58%) SAP SCM
Cloud Services
1 29 (16.76%) AWS
2 21 (12.14%) Azure
3 14 (8.09%) GitHub
4 12 (6.94%) Azure DevOps
5 10 (5.78%) Amazon S3
6 9 (5.20%) Amazon EC2
7 8 (4.62%) Azure Monitor
7 8 (4.62%) Entra ID
7 8 (4.62%) GCP
8 7 (4.05%) Amazon CloudWatch
8 7 (4.05%) Microsoft 365
8 7 (4.05%) Serverless
9 6 (3.47%) Azure Key Vault
10 5 (2.89%) Amazon EKS
10 5 (2.89%) Amazon SQS
10 5 (2.89%) AWS KMS
10 5 (2.89%) Route 53
11 4 (2.31%) AWS Lambda
12 3 (1.73%) Azure Data Factory
12 3 (1.73%) Azure Synapse Analytics
Communications & Networking
1 16 (9.25%) Firewall
2 12 (6.94%) DNS
3 6 (3.47%) DHCP
3 6 (3.47%) TCP/IP
3 6 (3.47%) VPN
4 5 (2.89%) FIX Connectivity
5 4 (2.31%) Telnet
6 2 (1.16%) SAN
7 1 (0.58%) Internet
Database & Business Intelligence
1 50 (28.90%) Relational Database
2 42 (24.28%) MySQL
3 17 (9.83%) PostgreSQL
4 11 (6.36%) MongoDB
5 9 (5.20%) Elasticsearch
6 8 (4.62%) SQL Server
7 7 (4.05%) Amazon RDS
8 6 (3.47%) Amazon Aurora
9 5 (2.89%) Azure SQL Database
9 5 (2.89%) DynamoDB
10 4 (2.31%) NoSQL
11 3 (1.73%) Apache Cassandra
11 3 (1.73%) Couchbase
12 1 (0.58%) Big Data
12 1 (0.58%) Hadoop
12 1 (0.58%) InfluxDB
12 1 (0.58%) Pentaho
12 1 (0.58%) Redis
12 1 (0.58%) Tableau
Development Applications
1 108 (62.43%) JIRA
2 77 (44.51%) Git
3 52 (30.06%) Bitbucket
4 22 (12.72%) Jenkins
5 19 (10.98%) SonarQube
6 11 (6.36%) GitLab
7 7 (4.05%) Artifactory
7 7 (4.05%) JUnit
8 6 (3.47%) Atlassian Bamboo
9 5 (2.89%) AppScan
9 5 (2.89%) Bitbucket Server
9 5 (2.89%) DbUnit
9 5 (2.89%) jMock
9 5 (2.89%) Maven
9 5 (2.89%) Mockito
10 3 (1.73%) Cucumber
10 3 (1.73%) IBM UrbanCode
10 3 (1.73%) Selenium
10 3 (1.73%) Sonatype Nexus
11 2 (1.16%) TeamCity
General
1 33 (19.08%) Social Skills
2 27 (15.61%) Finance
3 14 (8.09%) Banking
4 11 (6.36%) Public Sector
5 9 (5.20%) Aerospace
6 7 (4.05%) Analytical Skills
7 4 (2.31%) Spanish Language
8 3 (1.73%) Military
9 2 (1.16%) Manufacturing
9 2 (1.16%) Retail
9 2 (1.16%) Telecoms
10 1 (0.58%) Advertising
10 1 (0.58%) Documentation Skills
10 1 (0.58%) Health Technology
10 1 (0.58%) Inclusion and Diversity
10 1 (0.58%) Influencing Skills
10 1 (0.58%) Law
10 1 (0.58%) Organisational Skills
10 1 (0.58%) Pharmaceutical
Job Titles
1 49 (28.32%) Senior
2 20 (11.56%) Software Engineer
3 18 (10.40%) Principal Engineer
4 17 (9.83%) Developer
4 17 (9.83%) Project Manager
4 17 (9.83%) Senior Manager
4 17 (9.83%) Senior Project Manager
5 16 (9.25%) IT Engineer
5 16 (9.25%) Systems Engineer
6 15 (8.67%) Capability Manager
6 15 (8.67%) Delivery Manager
7 14 (8.09%) Analyst
8 12 (6.94%) DevOps Engineer
8 12 (6.94%) Senior Software Engineer
9 11 (6.36%) Principal Systems Engineer
10 9 (5.20%) Support Analyst
11 7 (4.05%) Cloud Engineer
11 7 (4.05%) Senior Cloud Engineer
12 5 (2.89%) SQL Analyst
12 5 (2.89%) SQL Support Analyst
Libraries, Frameworks & Software Standards
1 43 (24.86%) .NET
2 19 (10.98%) REST
3 12 (6.94%) React
4 10 (5.78%) AngularJS
5 9 (5.20%) Elastic Stack
5 9 (5.20%) FIX Protocol
5 9 (5.20%) Hibernate
5 9 (5.20%) Web Services
6 8 (4.62%) Bootstrap
6 8 (4.62%) HTML
6 8 (4.62%) SOAP
7 6 (3.47%) CSS
7 6 (3.47%) JSON
7 6 (3.47%) YAML
8 5 (2.89%) ActiveMQ
8 5 (2.89%) JPA
8 5 (2.89%) Kafka
8 5 (2.89%) Spring
8 5 (2.89%) Spring Batch
8 5 (2.89%) Spring Integration
Miscellaneous
1 26 (15.03%) Management Information System
2 10 (5.78%) Product Ownership
3 9 (5.20%) Equities
3 9 (5.20%) Fixed Income
4 7 (4.05%) Derivative
4 7 (4.05%) Distributed Systems
4 7 (4.05%) Onboarding
5 5 (2.89%) Bitcoin
5 5 (2.89%) CMDB
5 5 (2.89%) Eurex
5 5 (2.89%) Hybrid Cloud
5 5 (2.89%) Reference Data
6 4 (2.31%) Foreign Exchange (FX)
7 3 (1.73%) AS400
7 3 (1.73%) Cloud Native
7 3 (1.73%) Mainframe
7 3 (1.73%) Mobile App
8 2 (1.16%) Distributed Architecture
8 2 (1.16%) Distributed Computing
8 2 (1.16%) EPoS
Operating Systems
1 76 (43.93%) Linux
2 51 (29.48%) Windows
3 10 (5.78%) Unix
4 9 (5.20%) CentOS
4 9 (5.20%) Rocky
5 8 (4.62%) Red Hat Enterprise Linux
6 4 (2.31%) Ubuntu
7 2 (1.16%) Debian
7 2 (1.16%) VMS
7 2 (1.16%) Windows 10
8 1 (0.58%) Android
8 1 (0.58%) Apple iOS
8 1 (0.58%) Windows Server
Processes & Methodologies
1 109 (63.01%) Agile
2 59 (34.10%) CI/CD
3 42 (24.28%) Coaching
4 39 (22.54%) Continuous Integration
5 37 (21.39%) Stakeholder Management
6 35 (20.23%) Software Engineering
7 33 (19.08%) DevOps
7 33 (19.08%) Programme Management
8 31 (17.92%) DevSecOps
9 30 (17.34%) Waterfall
10 29 (16.76%) Continuous Deployment
11 28 (16.18%) Systems Engineering
12 27 (15.61%) Scrum
13 24 (13.87%) ITIL
14 22 (12.72%) Project Delivery
15 21 (12.14%) Business Strategy
15 21 (12.14%) Microservices
16 19 (10.98%) Risk Management
17 18 (10.40%) Project Management
18 17 (9.83%) Quality Management
Programming Languages
1 47 (27.17%) C#
2 40 (23.12%) Python
3 32 (18.50%) SQL
4 23 (13.29%) Java
5 15 (8.67%) PowerShell
6 14 (8.09%) JavaScript
7 12 (6.94%) Bash
8 11 (6.36%) TypeScript
9 10 (5.78%) Perl
10 6 (3.47%) Bicep
10 6 (3.47%) Groovy
11 5 (2.89%) Go
12 3 (1.73%) C++
12 3 (1.73%) Shell Script
13 2 (1.16%) Delphi
13 2 (1.16%) R
14 1 (0.58%) Apex Code
14 1 (0.58%) Embedded C++
14 1 (0.58%) Fortran
14 1 (0.58%) PHP
Qualifications
1 47 (27.17%) BPSS Clearance
2 32 (18.50%) Degree
3 22 (12.72%) Security Cleared
4 17 (9.83%) PMP
5 15 (8.67%) HND
6 12 (6.94%) SC Cleared
7 5 (2.89%) Computer Science Degree
8 3 (1.73%) DV Cleared
8 3 (1.73%) Master's Degree
8 3 (1.73%) OCP
8 3 (1.73%) Oracle Certification
9 2 (1.16%) CompTIA Security+
10 1 (0.58%) ISTQB
10 1 (0.58%) ISTQB Foundation Certification
10 1 (0.58%) TOGAF Certification
Quality Assurance & Compliance
1 10 (5.78%) SLA
2 8 (4.62%) QA
3 2 (1.16%) Accessibility
3 2 (1.16%) ISO/IEC 27001
4 1 (0.58%) Cyber Essentials
4 1 (0.58%) GDPR
4 1 (0.58%) ISO 13485
4 1 (0.58%) ISO 9001
4 1 (0.58%) NIST
4 1 (0.58%) PCI DSS
System Software
1 17 (9.83%) Docker
2 6 (3.47%) Virtual Machines
3 2 (1.16%) Active Directory
3 2 (1.16%) Postfix
3 2 (1.16%) VMware Infrastructure
4 1 (0.58%) Hyper-V
4 1 (0.58%) vSphere
Systems Management
1 50 (28.90%) Ansible
2 17 (9.83%) Kubernetes
3 16 (9.25%) Grafana
4 12 (6.94%) Terraform
5 9 (5.20%) Progress Chef
6 8 (4.62%) Puppet
7 6 (3.47%) Kibana
7 6 (3.47%) Prometheus
8 5 (2.89%) Opsgenie
9 4 (2.31%) Argo
10 3 (1.73%) Istio
10 3 (1.73%) Packer
11 2 (1.16%) Docker Swarm
11 2 (1.16%) MIIS
11 2 (1.16%) Single Sign-On
12 1 (0.58%) Check_MK
12 1 (0.58%) Control-M
12 1 (0.58%) FortiGate
12 1 (0.58%) Kustomize
12 1 (0.58%) logstash
Vendors
1 20 (11.56%) Microsoft
2 12 (6.94%) Red Hat
3 11 (6.36%) Oracle
4 9 (5.20%) Databricks
5 6 (3.47%) IBM
6 5 (2.89%) Bloomberg
6 5 (2.89%) CQG
6 5 (2.89%) Google
6 5 (2.89%) ION Trading
6 5 (2.89%) Patsystems
6 5 (2.89%) Reuters
6 5 (2.89%) ServiceNow
6 5 (2.89%) Trayport
7 4 (2.31%) AppDynamics
8 3 (1.73%) Cisco
8 3 (1.73%) Dynatrace
8 3 (1.73%) Jaspersoft
8 3 (1.73%) Juniper
8 3 (1.73%) Palo Alto
8 3 (1.73%) VMware