Regulatory Compliance Jobs

Regulatory Compliance
UK

The table below provides summary statistics for permanent job vacancies requiring Regulatory Compliance skills. It includes a benchmarking guide to the annual salaries offered in vacancies that cited Regulatory Compliance over the 6 months leading up to 15 May 2025, comparing them to the same period in the previous two years.

6 months to
15 May 2025
Same period 2024 Same period 2023
Rank 308 571 584
Rank change year-on-year +263 +13 +57
Permanent jobs citing Regulatory Compliance 507 352 433
As % of all permanent jobs advertised in the UK 0.92% 0.36% 0.43%
As % of the Processes & Methodologies category 0.98% 0.42% 0.45%
Number of salaries quoted 329 261 175
10th Percentile £47,500 £41,250 £38,750
25th Percentile £60,000 £48,125 £52,293
Median annual salary (50th Percentile) £87,500 £65,000 £70,000
Median % change year-on-year +34.62% -7.14% +21.74%
75th Percentile £122,500 £87,500 £94,688
90th Percentile £152,500 £95,000 £125,000
UK excluding London median annual salary £55,000 £60,000 £60,000
% change year-on-year -8.33% - +12.15%

All Process and Methodology Skills
UK

Regulatory Compliance falls under the Processes and Methodologies category. For comparison with the information above, the following table provides summary statistics for all permanent job vacancies requiring process or methodology skills.

Permanent vacancies with a requirement for process or methodology skills 51,770 84,704 95,930
As % of all permanent jobs advertised in the UK 93.86% 85.53% 95.60%
Number of salaries quoted 26,375 59,701 56,503
10th Percentile £30,000 £29,000 £34,000
25th Percentile £42,000 £40,000 £45,000
Median annual salary (50th Percentile) £57,500 £55,000 £61,180
Median % change year-on-year +4.55% -10.10% +1.97%
75th Percentile £75,000 £72,500 £81,250
90th Percentile £97,500 £92,500 £100,000
UK excluding London median annual salary £52,000 £50,000 £55,000
% change year-on-year +4.00% -9.09% +4.76%

Regulatory Compliance
Job Vacancy Trend

Job postings citing Regulatory Compliance as a proportion of all IT jobs advertised.
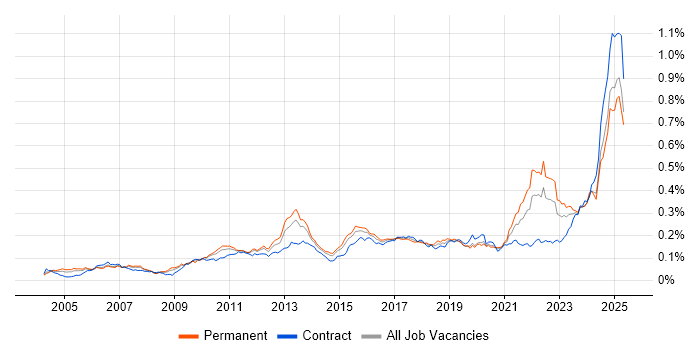
Job vacancy trend for Regulatory Compliance in the UK

Regulatory Compliance
Salary Trend

3-month moving average salary quoted in jobs citing Regulatory Compliance.

Salary trend for Regulatory Compliance in the UK

Regulatory Compliance
Salary Histogram

Salary distribution for jobs citing Regulatory Compliance over the 6 months to 15 May 2025.

Salary histogram for Regulatory Compliance in the UK

Regulatory Compliance
Top 18 Job Locations

The table below looks at the demand and provides a guide to the median salaries quoted in IT jobs citing Regulatory Compliance within the UK over the 6 months to 15 May 2025. The 'Rank Change' column provides an indication of the change in demand within each location based on the same 6 month period last year.

Location Rank Change
on Same Period
Last Year
Matching
Permanent
IT Job Ads
Median Salary
Past 6 Months
Median Salary
% Change
on Same Period
Last Year
Live
Jobs
England +230 469 £90,000 +38.46% 659
London +256 279 £115,000 +58.62% 399
Work from Home +203 223 £115,000 +76.92% 295
UK excluding London +141 210 £55,000 -8.33% 354
South East +74 60 £68,500 -2.14% 161
North of England +27 42 £50,000 - 44
Midlands +79 30 £25,103 -58.16% 38
South West +105 28 £72,500 +7.41% 48
North West +2 26 £50,000 -6.98% 24
East of England +50 19 £50,000 -49.95% 45
East Midlands +48 18 £25,103 -73.58% 13
Scotland +120 15 £55,000 -8.33% 21
West Midlands +59 12 £75,000 +30.43% 22
Yorkshire +51 12 £94,637 +27.03% 14
Wales +37 6 £50,000 +42.86% 9
Northern Ireland +45 5 - - 9
Channel Islands - 5 £80,000 -
North East +24 4 - - 6

Regulatory Compliance
Co-occurring Skills and Capabilities by Category

The follow tables expand on the table above by listing co-occurrences grouped by category. The same employment type, locality and period is covered with up to 20 co-occurrences shown in each of the following categories:

Application Platforms
1 18 (3.55%) CMS
1 18 (3.55%) SAS
2 9 (1.78%) Apache Spark
3 6 (1.18%) SharePoint
4 4 (0.79%) Confluence
4 4 (0.79%) Microsoft Exchange
5 2 (0.39%) ArcGIS
5 2 (0.39%) IIS
Applications
1 13 (2.56%) Microsoft Office
2 10 (1.97%) Microsoft Project
3 9 (1.78%) MS Visio
4 6 (1.18%) Microsoft Excel
4 6 (1.18%) Microsoft PowerPoint
4 6 (1.18%) Trello
5 3 (0.59%) Adobe Creative Suite
6 2 (0.39%) Adobe Illustrator
7 1 (0.20%) AutoCAD
7 1 (0.20%) Chatbot
7 1 (0.20%) MicroStation
Business Applications
1 11 (2.17%) NetSuite
2 8 (1.58%) Aladdin
3 3 (0.59%) Relativity
4 1 (0.20%) Dynamics CRM
4 1 (0.20%) SAP S/4HANA
4 1 (0.20%) TrackWise
Cloud Services
1 83 (16.37%) Azure
2 56 (11.05%) AWS
3 40 (7.89%) SaaS
4 28 (5.52%) GCP
4 28 (5.52%) PaaS
5 27 (5.33%) Serverless
6 25 (4.93%) AWS Lambda
7 20 (3.94%) Azure DevOps
8 18 (3.55%) Power Platform
9 17 (3.35%) GitHub
9 17 (3.35%) iPaaS
10 16 (3.16%) AWS CloudFormation
11 13 (2.56%) AWS KMS
12 12 (2.37%) Azure Synapse Analytics
12 12 (2.37%) GitHub Actions
13 9 (1.78%) Amazon S3
14 8 (1.58%) Collibra
15 7 (1.38%) Cloud Computing
15 7 (1.38%) Snowflake
16 6 (1.18%) Azure Sentinel
Communications & Networking
1 37 (7.30%) Network Security
2 24 (4.73%) Firewall
3 12 (2.37%) VPN
4 6 (1.18%) Internet
5 5 (0.99%) Bluetooth
5 5 (0.99%) RS-485
6 4 (0.79%) GSM
6 4 (0.79%) Intrusion Detection
6 4 (0.79%) TCP/IP
7 3 (0.59%) DHCP
7 3 (0.59%) DNS
7 3 (0.59%) NGFW
8 2 (0.39%) Ethernet
8 2 (0.39%) Intranet
9 1 (0.20%) DKIM
9 1 (0.20%) LAN
9 1 (0.20%) Modbus
9 1 (0.20%) SWIFTNet
9 1 (0.20%) WAN
9 1 (0.20%) Wireless
Database & Business Intelligence
1 119 (23.47%) Data Lake
2 25 (4.93%) NoSQL
3 16 (3.16%) Power BI
4 15 (2.96%) Data Warehouse
5 14 (2.76%) Metadata
6 12 (2.37%) Amazon Redshift
6 12 (2.37%) Big Data
7 11 (2.17%) BigQuery
8 9 (1.78%) Hadoop
8 9 (1.78%) PostgreSQL
9 6 (1.18%) Relational Database
10 5 (0.99%) MySQL
11 4 (0.79%) Amazon RDS
12 3 (0.59%) Ataccama
12 3 (0.59%) EDRMS
13 2 (0.39%) Azure SQL Data Warehouse
13 2 (0.39%) GIS
13 2 (0.39%) MongoDB
13 2 (0.39%) Spark SQL
13 2 (0.39%) Spatial Data
Development Applications
1 19 (3.75%) JIRA
2 7 (1.38%) Git
3 2 (0.39%) ERwin
3 2 (0.39%) Jenkins
3 2 (0.39%) JUnit
3 2 (0.39%) Postman
3 2 (0.39%) Selenium
3 2 (0.39%) Subversion
3 2 (0.39%) TortoiseSVN
4 1 (0.20%) Bugzilla
4 1 (0.20%) Cucumber
4 1 (0.20%) Gradle
4 1 (0.20%) MagicDraw
4 1 (0.20%) Maven
4 1 (0.20%) MLflow
4 1 (0.20%) Octopus Deploy
4 1 (0.20%) Sonatype Nexus
4 1 (0.20%) Spinnaker
4 1 (0.20%) TestRail
4 1 (0.20%) Zephyr
General
1 293 (57.79%) Finance
2 247 (48.72%) Social Skills
3 122 (24.06%) Front Office
4 92 (18.15%) Analytical Skills
5 89 (17.55%) Legal
6 40 (7.89%) Banking
7 39 (7.69%) Presentation Skills
8 29 (5.72%) Marketing
9 28 (5.52%) Law
10 27 (5.33%) Organisational Skills
11 18 (3.55%) Retail
12 15 (2.96%) Electronics
12 15 (2.96%) Manufacturing
13 12 (2.37%) Financial Institution
14 11 (2.17%) Billing
14 11 (2.17%) Pharmaceutical
14 11 (2.17%) Public Sector
15 9 (1.78%) Inclusion and Diversity
16 6 (1.18%) Influencing Skills
17 5 (0.99%) Advertising
Job Titles
1 79 (15.58%) Lead
2 58 (11.44%) Architect
3 57 (11.24%) Analyst
4 46 (9.07%) Senior
5 44 (8.68%) Consultant
6 36 (7.10%) Data Governance Analyst
6 36 (7.10%) Data Governance Manager
6 36 (7.10%) Governance Manager
7 30 (5.92%) Head of Finance
8 26 (5.13%) Finance Manager
8 26 (5.13%) Programme Manager
9 24 (4.73%) Security Analyst
10 23 (4.54%) Head of Data Management
11 22 (4.34%) Risk Manager
11 22 (4.34%) Security Consultant
12 21 (4.14%) Cybersecurity Consultant
12 21 (4.14%) Managing Consultant
13 17 (3.35%) Applications Architect
13 17 (3.35%) IT Architect
13 17 (3.35%) Lead Architect
Libraries, Frameworks & Software Standards
1 24 (4.73%) Kafka
2 15 (2.96%) Elastic Stack
3 6 (1.18%) CSS
3 6 (1.18%) HTML
4 5 (0.99%) .NET
4 5 (0.99%) Django
4 5 (0.99%) WebSockets
5 4 (0.79%) Laravel
5 4 (0.79%) Symfony
6 3 (0.59%) FHIR
7 2 (0.39%) Node.js
7 2 (0.39%) NumPy
7 2 (0.39%) Pandas
7 2 (0.39%) PySpark
7 2 (0.39%) PyTorch
7 2 (0.39%) TensorFlow
7 2 (0.39%) XBRL
8 1 (0.20%) ASP.NET
8 1 (0.20%) DCOM
8 1 (0.20%) Middleware
Miscellaneous
1 114 (22.49%) Hedge funds
2 113 (22.29%) Derivative
3 112 (22.09%) Equities
3 112 (22.09%) Fixed Income
3 112 (22.09%) Foreign Exchange (FX)
4 62 (12.23%) Management Information System
5 54 (10.65%) Product Ownership
6 28 (5.52%) Life Science
7 18 (3.55%) Security Posture
8 17 (3.35%) Greenfield Project
9 16 (3.16%) Algorithms
9 16 (3.16%) Cloud Native
10 13 (2.56%) Data Structures
11 12 (2.37%) Legacy Systems
12 11 (2.17%) Security Operations Centre
13 10 (1.97%) IoT
14 9 (1.78%) Credit Risk
14 9 (1.78%) Market Risk
14 9 (1.78%) Social Media
15 8 (1.58%) FMCG
Operating Systems
1 16 (3.16%) Linux
2 15 (2.96%) Windows
3 6 (1.18%) Red Hat Enterprise Linux
3 6 (1.18%) Windows Vista
4 5 (0.99%) Ubuntu
5 2 (0.39%) VMS
5 2 (0.39%) Windows Server 2019
6 1 (0.20%) Unix
6 1 (0.20%) Windows Server
Processes & Methodologies
1 203 (40.04%) Agile
2 166 (32.74%) Data Governance
3 150 (29.59%) Roadmaps
4 141 (27.81%) Migration
5 115 (22.68%) Data Management
6 114 (22.49%) Problem-Solving
7 112 (22.09%) Investment Management
8 108 (21.30%) Risk Management
9 90 (17.75%) Analytics
9 90 (17.75%) Continuous Improvement
10 73 (14.40%) Stakeholder Engagement
11 67 (13.21%) Cybersecurity
11 67 (13.21%) Mentoring
12 66 (13.02%) Information Security
13 65 (12.82%) Project Management
14 62 (12.23%) Stakeholder Management
15 59 (11.64%) Data Protection
16 58 (11.44%) Artificial Intelligence
17 54 (10.65%) DevOps
18 52 (10.26%) CI/CD
Programming Languages
1 54 (10.65%) SQL
2 37 (7.30%) Python
3 20 (3.94%) Java
4 18 (3.55%) C++
5 17 (3.35%) C
6 16 (3.16%) R
7 8 (1.58%) TypeScript
8 6 (1.18%) JavaScript
9 5 (0.99%) Ladder Logic
10 4 (0.79%) PHP
11 3 (0.59%) C#
12 2 (0.39%) Bicep
12 2 (0.39%) PowerShell
13 1 (0.20%) Kotlin
13 1 (0.20%) MATLAB
13 1 (0.20%) PL/SQL
13 1 (0.20%) Ruby
13 1 (0.20%) Shell Script
Qualifications
1 105 (20.71%) Degree
2 65 (12.82%) CISSP
3 48 (9.47%) CISM
4 31 (6.11%) Computer Science Degree
5 22 (4.34%) DBS Check
6 19 (3.75%) AWS Certification
7 18 (3.55%) CISA
8 17 (3.35%) AWS Certified Solutions Architect
8 17 (3.35%) CRISC
8 17 (3.35%) Security Cleared
9 16 (3.16%) ISO 27001 Lead Auditor
9 16 (3.16%) Master's Degree
9 16 (3.16%) SC Cleared
10 15 (2.96%) Cisco Certification
11 14 (2.76%) (ISC)2 CCSP
11 14 (2.76%) CompTIA Security+
12 12 (2.37%) PMI Certification
13 11 (2.17%) PMP
14 7 (1.38%) PhD
15 5 (0.99%) GIAC
Quality Assurance & Compliance
1 91 (17.95%) GDPR
2 65 (12.82%) ISO/IEC 27001
3 56 (11.05%) MiFID
4 36 (7.10%) NIST
5 33 (6.51%) Data Quality
6 22 (4.34%) HIPAA
6 22 (4.34%) SOC 2
7 21 (4.14%) QA
8 17 (3.35%) Sarbanes-Oxley
9 15 (2.96%) Accessibility
10 11 (2.17%) PCI DSS
11 10 (1.97%) Basel III
12 9 (1.78%) IFRS
12 9 (1.78%) IFRS 9
13 8 (1.58%) GMP
14 7 (1.38%) Basel II
14 7 (1.38%) Dodd-Frank
15 6 (1.18%) Good Clinical Practice
16 5 (0.99%) Cyber Essentials
16 5 (0.99%) Cyber Essentials PLUS
System Software
1 23 (4.54%) Docker
2 12 (2.37%) Virtual Machines
3 11 (2.17%) VMware Infrastructure
4 9 (1.78%) Virtual Desktop
5 6 (1.18%) Active Directory
6 1 (0.20%) Embedded Firmware
6 1 (0.20%) Firmware
6 1 (0.20%) Hyper-V
Systems Management
1 28 (5.52%) Terraform
2 24 (4.73%) Kubernetes
3 16 (3.16%) Grafana
3 16 (3.16%) Prometheus
4 3 (0.59%) QRadar
4 3 (0.59%) Single Sign-On
5 2 (0.39%) Ansible
5 2 (0.39%) Avamar
5 2 (0.39%) Computer Emergency Response Teams
5 2 (0.39%) NetBackup
5 2 (0.39%) Tivoli Storage Manager
6 1 (0.20%) Kubeflow
6 1 (0.20%) Microsoft Intune
6 1 (0.20%) Progress Chef
6 1 (0.20%) Puppet
Vendors
1 47 (9.27%) Microsoft
2 16 (3.16%) Google
3 15 (2.96%) Citrix
4 13 (2.56%) VMware
5 10 (1.97%) Databricks
6 8 (1.58%) Charles River
6 8 (1.58%) Facebook
7 7 (1.38%) EMC
8 6 (1.18%) Informatica
8 6 (1.18%) Red Hat
9 5 (0.99%) Liquidlogic
9 5 (0.99%) Siemens
9 5 (0.99%) Tanium
10 4 (0.79%) Splunk
11 3 (0.59%) Adobe
11 3 (0.59%) Avaloq
11 3 (0.59%) eFront
11 3 (0.59%) Salesforce
11 3 (0.59%) ServiceNow
11 3 (0.59%) YouTube