Translating Business Requirements Jobs

Translate Business Requirements
UK

The table below provides summary statistics for permanent job vacancies requiring Translating Business Requirements skills. It includes a benchmarking guide to the annual salaries offered in vacancies that cited Translating Business Requirements over the 6 months leading up to 17 May 2025, comparing them to the same period in the previous two years.

6 months to
17 May 2025
Same period 2024 Same period 2023
Rank 413 449 451
Rank change year-on-year +36 +2 +8
Permanent jobs citing Translating Business Requirements 343 542 663
As % of all permanent jobs advertised in the UK 0.61% 0.54% 0.67%
As % of the Processes & Methodologies category 0.65% 0.64% 0.70%
Number of salaries quoted 246 404 540
10th Percentile £46,250 £36,250 £41,125
25th Percentile £57,500 £45,000 £48,750
Median annual salary (50th Percentile) £69,000 £59,500 £65,000
Median % change year-on-year +15.97% -8.46% +8.33%
75th Percentile £82,751 £78,750 £77,973
90th Percentile £101,250 £93,375 £89,852
UK excluding London median annual salary £65,000 £55,000 £59,000
% change year-on-year +18.18% -6.78% +7.27%

All Process and Methodology Skills
UK

Translating Business Requirements falls under the Processes and Methodologies category. For comparison with the information above, the following table provides summary statistics for all permanent job vacancies requiring process or methodology skills.

Permanent vacancies with a requirement for process or methodology skills 52,380 85,029 95,220
As % of all permanent jobs advertised in the UK 93.83% 85.31% 95.60%
Number of salaries quoted 26,622 59,821 55,996
10th Percentile £29,750 £29,079 £34,000
25th Percentile £41,375 £40,000 £45,000
Median annual salary (50th Percentile) £57,500 £55,000 £61,000
Median % change year-on-year +4.55% -9.84% +1.67%
75th Percentile £75,000 £72,500 £81,250
90th Percentile £97,500 £92,500 £100,000
UK excluding London median annual salary £51,810 £50,000 £55,000
% change year-on-year +3.62% -9.09% +4.76%

Translating Business Requirements
Job Vacancy Trend

Job postings citing Translating Business Requirements as a proportion of all IT jobs advertised.
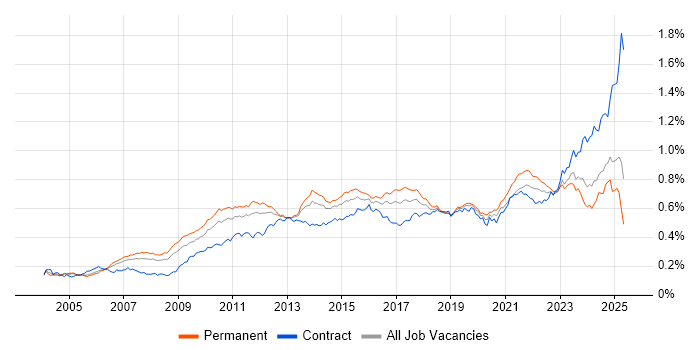
Job vacancy trend for Translating Business Requirements in the UK

Translating Business Requirements
Salary Trend

3-month moving average salary quoted in jobs citing Translating Business Requirements.

Salary trend for Translating Business Requirements in the UK

Translating Business Requirements
Salary Histogram

Salary distribution for jobs citing Translating Business Requirements over the 6 months to 17 May 2025.

Salary histogram for Translating Business Requirements in the UK

Translating Business Requirements
Top 17 Job Locations

The table below looks at the demand and provides a guide to the median salaries quoted in IT jobs citing Translating Business Requirements within the UK over the 6 months to 17 May 2025. The 'Rank Change' column provides an indication of the change in demand within each location based on the same 6 month period last year.

Location Rank Change
on Same Period
Last Year
Matching
Permanent
IT Job Ads
Median Salary
Past 6 Months
Median Salary
% Change
on Same Period
Last Year
Live
Jobs
England +8 300 £67,500 +13.45% 439
UK excluding London +69 186 £65,000 +18.18% 309
Work from Home +31 146 £65,000 +10.17% 307
London +68 131 £75,000 +7.14% 193
South East +67 69 £65,000 +23.81% 114
North of England +38 42 £55,000 -17.02% 79
Midlands +18 34 £65,000 +30.00% 52
North West +7 32 £52,500 -35.61% 50
East Midlands +18 22 £65,000 +13.04% 17
Scotland +117 20 £74,870 +15.07% 23
West Midlands +15 12 £60,960 +28.34% 34
South West +76 10 £78,810 +32.45% 30
Yorkshire +48 6 £75,401 +15.88% 19
East of England +20 6 £52,500 +5.53% 17
Northern Ireland +45 4 - - 3
North East +43 4 £51,250 -8.89% 11
Wales +32 1 - -

Translating Business Requirements
Co-occurring Skills and Capabilities by Category

The follow tables expand on the table above by listing co-occurrences grouped by category. The same employment type, locality and period is covered with up to 20 co-occurrences shown in each of the following categories:

Application Platforms
1 14 (4.08%) SharePoint
2 10 (2.92%) Apache Airflow
3 7 (2.04%) Confluence
4 6 (1.75%) Apache Spark
5 5 (1.46%) IIS
6 4 (1.17%) Luigi
7 2 (0.58%) Adobe Experience Manager
7 2 (0.58%) BizTalk Server
7 2 (0.58%) CMS
7 2 (0.58%) Microsoft Exchange
7 2 (0.58%) nginx
7 2 (0.58%) Oracle SOA Suite
7 2 (0.58%) Umbraco
8 1 (0.29%) Apache
8 1 (0.29%) Mendix
Applications
1 15 (4.37%) Microsoft Excel
2 12 (3.50%) Trello
3 8 (2.33%) MS Visio
4 5 (1.46%) Microsoft Office
5 4 (1.17%) Microsoft PowerPoint
6 1 (0.29%) Adobe Illustrator
6 1 (0.29%) Microsoft Project
6 1 (0.29%) Photoshop
Business Applications
1 21 (6.12%) Dynamics CRM
2 11 (3.21%) SAP S/4HANA
3 5 (1.46%) SAP SD
4 4 (1.17%) NetSuite
5 3 (0.87%) Dynamics AX
5 3 (0.87%) Oracle EBS
6 2 (0.58%) Dynamics NAV
6 2 (0.58%) Oracle Applications
6 2 (0.58%) Oracle Assets
6 2 (0.58%) Oracle EBS R12
6 2 (0.58%) Oracle Payables
6 2 (0.58%) Oracle Receivables
6 2 (0.58%) SAP LE
6 2 (0.58%) SAP MM
6 2 (0.58%) Sprinklr
7 1 (0.29%) Dynamics GP
7 1 (0.29%) Endur
7 1 (0.29%) Salesforce CRM
7 1 (0.29%) SAP CAR
7 1 (0.29%) SAP SCM
Cloud Services
1 121 (35.28%) Azure
2 71 (20.70%) Power Platform
3 58 (16.91%) AWS
4 55 (16.03%) GCP
5 50 (14.58%) Dynamics 365
6 35 (10.20%) SaaS
7 23 (6.71%) Azure DevOps
8 19 (5.54%) Microsoft 365
9 16 (4.66%) PaaS
9 16 (4.66%) Power Automate
10 15 (4.37%) PowerApps
11 14 (4.08%) Salsify
12 13 (3.79%) Azure Data Factory
13 12 (3.50%) Apigee
13 12 (3.50%) Google Kubernetes Engine
14 10 (2.92%) IaaS
15 9 (2.62%) Amazon S3
15 9 (2.62%) Azure Synapse Analytics
15 9 (2.62%) Snowflake
16 8 (2.33%) dbt
Communications & Networking
1 5 (1.46%) Firewall
2 3 (0.87%) Intrusion Detection
2 3 (0.87%) LAN
2 3 (0.87%) Network Security
2 3 (0.87%) VPN
2 3 (0.87%) WAN
3 2 (0.58%) Reverse Proxy
3 2 (0.58%) SD-WAN
3 2 (0.58%) VLAN
3 2 (0.58%) Wi-Fi
3 2 (0.58%) Wireless
4 1 (0.29%) Cisco Wireless
4 1 (0.29%) DHCP
4 1 (0.29%) DNS
4 1 (0.29%) IP Telephony
4 1 (0.29%) IPsec
4 1 (0.29%) Spanning Tree
4 1 (0.29%) TCP/IP
4 1 (0.29%) VoIP
4 1 (0.29%) WebEx
Database & Business Intelligence
1 48 (13.99%) Power BI
2 29 (8.45%) NoSQL
3 27 (7.87%) Data Warehouse
3 27 (7.87%) SQL Server
4 21 (6.12%) Metadata
5 15 (4.37%) Amazon Redshift
6 14 (4.08%) Relational Database
7 11 (3.21%) BigQuery
8 10 (2.92%) Big Data
9 8 (2.33%) Azure SQL Database
10 7 (2.04%) Data Lake
11 6 (1.75%) Hadoop
11 6 (1.75%) MySQL
12 5 (1.46%) RDBMS
13 4 (1.17%) Elasticsearch
13 4 (1.17%) Power Query
14 3 (0.87%) Parquet
14 3 (0.87%) SQL Server Integration Services
14 3 (0.87%) SQL Server Reporting Services
14 3 (0.87%) Tableau
Development Applications
1 24 (7.00%) JIRA
2 21 (6.12%) Git
3 16 (4.66%) Jenkins
4 13 (3.79%) Maven
4 13 (3.79%) Sonatype Nexus
5 12 (3.50%) JUnit
5 12 (3.50%) SonarQube
6 5 (1.46%) TeamCity
7 4 (1.17%) Jasmine
7 4 (1.17%) NUnit
7 4 (1.17%) Visual Studio
7 4 (1.17%) webpack
8 3 (0.87%) MLflow
9 2 (0.58%) Babel
10 1 (0.29%) ESLint
10 1 (0.29%) GitLab
10 1 (0.29%) IntelliJ
10 1 (0.29%) Mocha
10 1 (0.29%) Storybook
10 1 (0.29%) VersaTest
General
1 172 (50.15%) Social Skills
2 130 (37.90%) Finance
3 80 (23.32%) Analytical Skills
4 34 (9.91%) Banking
5 32 (9.33%) Law
6 30 (8.75%) Marketing
7 25 (7.29%) Inclusion and Diversity
7 25 (7.29%) Manufacturing
7 25 (7.29%) Retail
8 19 (5.54%) Legal
9 17 (4.96%) Public Sector
10 9 (2.62%) Financial Institution
11 7 (2.04%) Games
12 6 (1.75%) Telecoms
13 5 (1.46%) Billing
13 5 (1.46%) Presentation Skills
14 4 (1.17%) Automotive
14 4 (1.17%) Electronics
14 4 (1.17%) Influencing Skills
15 3 (0.87%) General Ledger
Job Titles
1 109 (31.78%) Senior
2 91 (26.53%) Architect
3 64 (18.66%) Developer
4 55 (16.03%) Analyst
5 48 (13.99%) Solutions Architect
6 30 (8.75%) Senior Architect
7 26 (7.58%) Consultant
7 26 (7.58%) Senior Developer
8 25 (7.29%) Lead
9 18 (5.25%) Business Analyst
9 18 (5.25%) Software Engineer
10 15 (4.37%) Senior Analyst
11 14 (4.08%) Senior Manager
11 14 (4.08%) Senior Solutions Architect
12 13 (3.79%) Data Engineer
12 13 (3.79%) Senior Software Engineer
13 12 (3.50%) Dynamics 365 Developer
14 11 (3.21%) Product Manager
14 11 (3.21%) SAP Consultant
14 11 (3.21%) Technical Architect
Libraries, Frameworks & Software Standards
1 60 (17.49%) .NET
2 24 (7.00%) RESTful
3 20 (5.83%) HTML
4 18 (5.25%) Blazor
5 17 (4.96%) Spring Boot
6 16 (4.66%) Spring
7 15 (4.37%) React
8 14 (4.08%) .NET Framework
8 14 (4.08%) JSON
9 12 (3.50%) CSS
9 12 (3.50%) Hibernate
9 12 (3.50%) HTML5
9 12 (3.50%) Kafka
10 11 (3.21%) Middleware
11 10 (2.92%) REST
12 9 (2.62%) AngularJS
12 9 (2.62%) Bootstrap
12 9 (2.62%) Lightning Web Components
12 9 (2.62%) RabbitMQ
12 9 (2.62%) SOAP
Miscellaneous
1 25 (7.29%) Product Ownership
2 22 (6.41%) Cloud Native
3 21 (6.12%) Management Information System
4 18 (5.25%) Self-Motivation
5 14 (4.08%) Taxonomies
6 12 (3.50%) Legacy Systems
7 9 (2.62%) Greenfield Project
7 9 (2.62%) Manufacturing Execution System
7 9 (2.62%) Mobile App
8 8 (2.33%) Private Cloud
9 7 (2.04%) Data Structures
9 7 (2.04%) FMCG
10 6 (1.75%) Onboarding
11 5 (1.46%) Data Protection Act
11 5 (1.46%) IoT
11 5 (1.46%) Mobile Games
11 5 (1.46%) Public Cloud
12 4 (1.17%) Enterprise Software
12 4 (1.17%) Social Media
13 2 (0.58%) Robotics
Operating Systems
1 20 (5.83%) Linux
2 12 (3.50%) Unix
3 3 (0.87%) Windows
Processes & Methodologies
1 139 (40.52%) Problem-Solving
2 135 (39.36%) Agile
3 81 (23.62%) Roadmaps
4 72 (20.99%) DevOps
5 68 (19.83%) Analytics
6 57 (16.62%) CI/CD
7 53 (15.45%) Microservices
8 50 (14.58%) Business Intelligence
9 47 (13.70%) Data Management
10 42 (12.24%) Software Engineering
11 41 (11.95%) Data Modelling
11 41 (11.95%) Stakeholder Management
11 41 (11.95%) Strategic Thinking
12 40 (11.66%) Artificial Intelligence
12 40 (11.66%) Computer Science
12 40 (11.66%) Migration
13 38 (11.08%) Technical Leadership
14 36 (10.50%) Continuous Improvement
15 34 (9.91%) Architectural Patterns
15 34 (9.91%) Stakeholder Engagement
Programming Languages
1 108 (31.49%) SQL
2 46 (13.41%) JavaScript
3 45 (13.12%) C#
4 40 (11.66%) Python
5 28 (8.16%) Java
6 12 (3.50%) Go
7 11 (3.21%) PL/SQL
7 11 (3.21%) TypeScript
8 9 (2.62%) Apex Code
8 9 (2.62%) C-shell
8 9 (2.62%) Korn
8 9 (2.62%) Shell Script
9 5 (1.46%) X++
10 4 (1.17%) PowerShell
11 3 (0.87%) ABAP
11 3 (0.87%) Scala
11 3 (0.87%) T-SQL
12 2 (0.58%) Data Analysis Expressions
13 1 (0.29%) Google Apps Script
13 1 (0.29%) R
Qualifications
1 65 (18.95%) Degree
2 35 (10.20%) Computer Science Degree
3 23 (6.71%) Security Cleared
4 16 (4.66%) SC Cleared
5 15 (4.37%) DBS Check
6 12 (3.50%) Master's Degree
7 10 (2.92%) Microsoft Certification
7 10 (2.92%) PhD
8 7 (2.04%) AWS Certification
8 7 (2.04%) BPSS Clearance
9 6 (1.75%) AWS Certified Solutions Architect
10 5 (1.46%) Azure Certification
11 4 (1.17%) Oracle Certification
11 4 (1.17%) SAP Certification
12 3 (0.87%) Cisco Certification
12 3 (0.87%) HND
13 2 (0.58%) CBAP
13 2 (0.58%) CCNP
13 2 (0.58%) PMI Certification
14 1 (0.29%) PRINCE2 Practitioner
Quality Assurance & Compliance
1 34 (9.91%) Data Quality
2 16 (4.66%) QA
3 10 (2.92%) Accessibility
4 6 (1.75%) GDPR
5 2 (0.58%) PMO
5 2 (0.58%) Sarbanes-Oxley
5 2 (0.58%) SLA
6 1 (0.29%) HIPAA
System Software
1 34 (9.91%) Docker
2 7 (2.04%) Active Directory
Systems Management
1 34 (9.91%) Kubernetes
2 29 (8.45%) Terraform
3 12 (3.50%) Istio
4 3 (0.87%) Ansible
5 2 (0.58%) FortiGate
6 1 (0.29%) Grafana
6 1 (0.29%) Marathon
Vendors
1 94 (27.41%) Microsoft
2 32 (9.33%) Google
3 22 (6.41%) SAP
4 19 (5.54%) Oracle
5 15 (4.37%) Salesforce
6 7 (2.04%) Databricks
6 7 (2.04%) ServiceNow
7 5 (1.46%) Cisco
8 4 (1.17%) Avaloq
8 4 (1.17%) IBM
8 4 (1.17%) Rollbar
9 3 (0.87%) Adobe
9 3 (0.87%) Cognos
9 3 (0.87%) MuleSoft
10 2 (0.58%) Atlassian
10 2 (0.58%) Hitachi
10 2 (0.58%) Sun
10 2 (0.58%) Zoho
11 1 (0.29%) Meraki
11 1 (0.29%) Talend