Workshop Facilitation Jobs

Workshop Facilitation
UK

The table below provides summary statistics for permanent job vacancies requiring Workshop Facilitation skills. It includes a benchmarking guide to the annual salaries offered in vacancies that cited Workshop Facilitation over the 6 months leading up to 10 May 2025, comparing them to the same period in the previous two years.

6 months to
10 May 2025
Same period 2024 Same period 2023
Rank 340 362 320
Rank change year-on-year +22 -42 -26
Permanent jobs citing Workshop Facilitation 449 749 1,100
As % of all permanent jobs advertised in the UK 0.82% 0.76% 1.09%
As % of the Processes & Methodologies category 0.88% 0.88% 1.14%
Number of salaries quoted 295 396 657
10th Percentile £45,703 £39,172 £41,250
25th Percentile £50,967 £47,000 £47,500
Median annual salary (50th Percentile) £62,500 £57,965 £57,500
Median % change year-on-year +7.82% +0.81% +4.55%
75th Percentile £75,000 £77,500 £75,000
90th Percentile £90,000 £92,500 £85,000
UK excluding London median annual salary £52,500 £52,500 £55,000
% change year-on-year - -4.55% +10.00%

All Process and Methodology Skills
UK

Workshop Facilitation falls under the Processes and Methodologies category. For comparison with the information above, the following table provides summary statistics for all permanent job vacancies requiring process or methodology skills.

Permanent vacancies with a requirement for process or methodology skills 51,147 84,812 96,895
As % of all permanent jobs advertised in the UK 93.75% 85.58% 95.62%
Number of salaries quoted 26,984 59,843 56,946
10th Percentile £30,000 £29,000 £34,000
25th Percentile £42,500 £40,000 £45,000
Median annual salary (50th Percentile) £57,500 £55,000 £61,180
Median % change year-on-year +4.55% -10.10% +1.97%
75th Percentile £75,000 £72,500 £81,250
90th Percentile £98,474 £92,500 £100,000
UK excluding London median annual salary £52,500 £50,000 £55,000
% change year-on-year +5.00% -9.09% +4.76%

Workshop Facilitation
Job Vacancy Trend

Job postings citing Workshop Facilitation as a proportion of all IT jobs advertised.
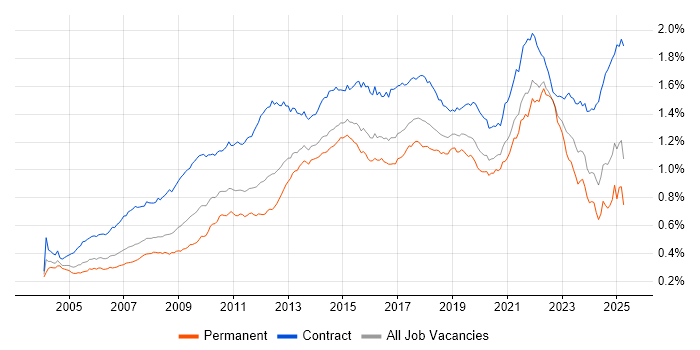
Job vacancy trend for Workshop Facilitation in the UK

Workshop Facilitation
Salary Trend

3-month moving average salary quoted in jobs citing Workshop Facilitation.

Salary trend for Workshop Facilitation in the UK

Workshop Facilitation
Salary Histogram

Salary distribution for jobs citing Workshop Facilitation over the 6 months to 10 May 2025.

Salary histogram for Workshop Facilitation in the UK

Workshop Facilitation
Top 16 Job Locations

The table below looks at the demand and provides a guide to the median salaries quoted in IT jobs citing Workshop Facilitation within the UK over the 6 months to 10 May 2025. The 'Rank Change' column provides an indication of the change in demand within each location based on the same 6 month period last year.

Location Rank Change
on Same Period
Last Year
Matching
Permanent
IT Job Ads
Median Salary
Past 6 Months
Median Salary
% Change
on Same Period
Last Year
Live
Jobs
England +3 403 £60,000 - 510
UK excluding London +12 235 £52,500 - 270
London +41 163 £72,500 - 324
Work from Home -11 114 £65,000 +12.07% 371
East of England +92 73 £50,967 -11.36% 5
North of England -6 62 £55,000 +13.40% 63
North West -21 49 £55,000 +10.00% 44
South East +90 47 £50,967 -11.36% 104
Midlands +16 23 £55,000 -4.73% 42
South West +51 22 £60,000 +3.45% 23
West Midlands +21 20 £55,000 -5.11% 31
Yorkshire +43 12 £47,000 -27.69% 16
Scotland +71 7 £46,250 +5.11% 22
East Midlands +26 2 £66,250 +32.50% 11
North East +38 1 £60,000 +54.84% 4
Northern Ireland +20 1 £32,500 - 7

Workshop Facilitation
Co-occurring Skills and Capabilities by Category

The follow tables expand on the table above by listing co-occurrences grouped by category. The same employment type, locality and period is covered with up to 20 co-occurrences shown in each of the following categories:

Application Platforms
1 13 (2.90%) Confluence
2 10 (2.23%) SharePoint
3 5 (1.11%) Microsoft Exchange
4 4 (0.89%) CMS
4 4 (0.89%) Headless CMS
5 1 (0.22%) Apache Spark
5 1 (0.22%) SAS
Applications
1 27 (6.01%) MS Visio
2 26 (5.79%) Microsoft Excel
3 22 (4.90%) Microsoft Office
4 8 (1.78%) Adobe XD
4 8 (1.78%) Microsoft PowerPoint
4 8 (1.78%) Microsoft Project
5 6 (1.34%) InVision
5 6 (1.34%) Sketch
6 3 (0.67%) Productboard
6 3 (0.67%) UserZoom
7 1 (0.22%) 3ds Max
7 1 (0.22%) Blender
7 1 (0.22%) Maya
7 1 (0.22%) Pro Tools
Business Applications
1 8 (1.78%) Teamcenter
2 7 (1.56%) Dynamics CRM
3 5 (1.11%) Endur
4 4 (0.89%) SAP S/4HANA
4 4 (0.89%) Shopify
5 2 (0.45%) Aladdin
5 2 (0.45%) Siebel CRM
6 1 (0.22%) Dynamics AX
6 1 (0.22%) Oracle ERP
6 1 (0.22%) SAP CO
6 1 (0.22%) SAP FI
6 1 (0.22%) SAP FI/CO
6 1 (0.22%) SAP GRC
6 1 (0.22%) SAP PP
6 1 (0.22%) SAP QM
6 1 (0.22%) SAP SD
6 1 (0.22%) Workday HCM
Cloud Services
1 52 (11.58%) Azure
2 31 (6.90%) Power Platform
3 28 (6.24%) Dynamics 365
4 24 (5.35%) AWS
4 24 (5.35%) SaaS
5 13 (2.90%) Figma
6 12 (2.67%) Power Automate
7 11 (2.45%) Azure DevOps
7 11 (2.45%) GCP
8 10 (2.23%) PowerApps
9 9 (2.00%) OCI
9 9 (2.00%) PaaS
10 8 (1.78%) Microsoft 365
11 6 (1.34%) Cloud Computing
11 6 (1.34%) Entra ID
11 6 (1.34%) Miro
12 5 (1.11%) Azure Data Factory
12 5 (1.11%) Azure Logic Apps
13 4 (0.89%) Contentstack
13 4 (0.89%) IaaS
Communications & Networking
1 3 (0.67%) Firewall
2 2 (0.45%) Ethernet VPN
2 2 (0.45%) MPLS
2 2 (0.45%) SD-WAN
2 2 (0.45%) VPN
2 2 (0.45%) VXLAN
2 2 (0.45%) WAN
2 2 (0.45%) Wi-Fi
3 1 (0.22%) DNS
3 1 (0.22%) FTP
3 1 (0.22%) HTTP
3 1 (0.22%) SMTP
3 1 (0.22%) SSH
Database & Business Intelligence
1 29 (6.46%) Power BI
2 7 (1.56%) Relational Database
3 6 (1.34%) Electronic Patient Records
3 6 (1.34%) SQL Server
4 5 (1.11%) Azure SQL Database
5 4 (0.89%) BusinessObjects
5 4 (0.89%) Data Warehouse
5 4 (0.89%) Metadata
5 4 (0.89%) RDBMS
5 4 (0.89%) Tableau
6 3 (0.67%) SQL Server Integration Services
7 2 (0.45%) Azure SQL Data Warehouse
7 2 (0.45%) Data Lake
7 2 (0.45%) MS Access
8 1 (0.22%) Amazon RDS
8 1 (0.22%) Data Vault
8 1 (0.22%) Delta Lake
8 1 (0.22%) Oracle BI Publisher
8 1 (0.22%) SAP BW
8 1 (0.22%) SAP Data Services
Development Applications
1 24 (5.35%) JIRA
2 7 (1.56%) Axure RP
3 5 (1.11%) GitLab
4 4 (0.89%) Sonatype Nexus
5 3 (0.67%) Artifactory
6 2 (0.45%) Balsamiq
7 1 (0.22%) Git
7 1 (0.22%) Jenkins
7 1 (0.22%) MLflow
7 1 (0.22%) Vagrant
General
1 282 (62.81%) Social Skills
2 175 (38.98%) Analytical Skills
3 113 (25.17%) Finance
4 100 (22.27%) Influencing Skills
5 46 (10.24%) Marketing
6 45 (10.02%) Public Sector
7 36 (8.02%) Law
8 26 (5.79%) Presentation Skills
9 24 (5.35%) Banking
9 24 (5.35%) Telecoms
10 22 (4.90%) Inclusion and Diversity
10 22 (4.90%) Manufacturing
11 20 (4.45%) Electronics
12 16 (3.56%) Retail
13 15 (3.34%) Legal
14 13 (2.90%) Organisational Skills
15 10 (2.23%) Documentation Skills
16 6 (1.34%) Advertising
16 6 (1.34%) Games
16 6 (1.34%) Publishing
Job Titles
1 175 (38.98%) Analyst
2 90 (20.04%) Change Analyst
3 89 (19.82%) Business Change Analyst
4 76 (16.93%) Business Analyst
5 72 (16.04%) Senior
6 58 (12.92%) Consultant
7 33 (7.35%) Architect
8 28 (6.24%) Senior Analyst
9 25 (5.57%) Designer
10 23 (5.12%) Lead
11 22 (4.90%) Senior Business Analyst
12 21 (4.68%) Project Manager
13 16 (3.56%) Solutions Architect
14 14 (3.12%) Senior Manager
15 13 (2.90%) Senior Architect
16 12 (2.67%) Service Designer
17 11 (2.45%) Dynamics 365 Consultant
17 11 (2.45%) UX Designer
18 10 (2.23%) Senior Project Manager
19 9 (2.00%) Functional Consultant
Libraries, Frameworks & Software Standards
1 8 (1.78%) CSS
1 8 (1.78%) HTML
2 5 (1.11%) Lightning Web Components
2 5 (1.11%) MACH
3 4 (0.89%) Django
3 4 (0.89%) Express.js
3 4 (0.89%) Flask
3 4 (0.89%) Next.js
3 4 (0.89%) Node.js
3 4 (0.89%) React
4 3 (0.67%) .NET
5 2 (0.45%) Hibernate
5 2 (0.45%) Middleware
5 2 (0.45%) REST
5 2 (0.45%) RESTful
5 2 (0.45%) SOAP
5 2 (0.45%) Spring
5 2 (0.45%) Spring Boot
5 2 (0.45%) Web Services
6 1 (0.22%) SAP Basis
Miscellaneous
1 46 (10.24%) Product Ownership
2 30 (6.68%) Management Information System
3 26 (5.79%) PMI
4 17 (3.79%) Cloud Native
5 15 (3.34%) Social Media
6 10 (2.23%) Legacy Systems
7 7 (1.56%) Hackathon
7 7 (1.56%) Onboarding
8 6 (1.34%) NHS
9 5 (1.11%) Legacy Applications
9 5 (1.11%) PACS
10 4 (0.89%) Analytical Mindset
10 4 (0.89%) Data Protection Act
10 4 (0.89%) Self-Motivation
10 4 (0.89%) Swaptions
10 4 (0.89%) Virtual Team
11 3 (0.67%) Data Centre
11 3 (0.67%) Reinsurance
11 3 (0.67%) Smart City
12 2 (0.45%) Distributed Denial-of-Service
Operating Systems
1 7 (1.56%) Windows
2 5 (1.11%) Linux
3 4 (0.89%) Windows Vista
4 3 (0.67%) Android
4 3 (0.67%) Apple iOS
4 3 (0.67%) Red Hat Enterprise Linux
5 1 (0.22%) Amazon Linux
5 1 (0.22%) VMS
5 1 (0.22%) zOS
Processes & Methodologies
1 194 (43.21%) Problem-Solving
2 155 (34.52%) Continuous Improvement
3 147 (32.74%) Business Analysis
4 138 (30.73%) Agile
5 119 (26.50%) Business Case
6 115 (25.61%) Stakeholder Engagement
7 112 (24.94%) Change Management
8 110 (24.50%) Strategic Thinking
9 107 (23.83%) Use Case
10 104 (23.16%) Collaborative Working
11 99 (22.05%) Project Management
12 94 (20.94%) MoSCoW
13 90 (20.04%) Stakeholder Management
14 55 (12.25%) Project Delivery
15 54 (12.03%) User Experience
16 50 (11.14%) User Stories
17 49 (10.91%) Business Intelligence
18 48 (10.69%) Decision-Making
19 47 (10.47%) Requirements Gathering
20 42 (9.35%) PRINCE2
Programming Languages
1 29 (6.46%) SQL
2 13 (2.90%) Python
3 10 (2.23%) JavaScript
4 5 (1.11%) Bash
4 5 (1.11%) Java
5 4 (0.89%) VB
6 3 (0.67%) C#
7 2 (0.45%) PowerShell
8 1 (0.22%) Assembly Language
8 1 (0.22%) Go
8 1 (0.22%) Groovy
8 1 (0.22%) JCL
8 1 (0.22%) Perl
8 1 (0.22%) PL/SQL
8 1 (0.22%) REXX
8 1 (0.22%) Scala
8 1 (0.22%) VBA
Qualifications
1 96 (21.38%) CBAP
2 67 (14.92%) Security Cleared
3 54 (12.03%) Degree
4 38 (8.46%) PMI Certification
5 29 (6.46%) SC Cleared
6 23 (5.12%) DV Cleared
7 19 (4.23%) BPSS Clearance
8 18 (4.01%) PMP
9 8 (1.78%) DBS Check
9 8 (1.78%) IIBA
10 7 (1.56%) Microsoft Certification
11 6 (1.34%) Azure Certification
11 6 (1.34%) ITIL Foundation Certificate
12 4 (0.89%) AWS Certification
12 4 (0.89%) PRINCE2 Certification
13 3 (0.67%) Master's Degree
13 3 (0.67%) PRINCE2 Practitioner
14 2 (0.45%) Computer Science Degree
15 1 (0.22%) CSPO
15 1 (0.22%) Tableau Certification
Quality Assurance & Compliance
1 26 (5.79%) Accessibility
2 16 (3.56%) QA
3 13 (2.90%) PMO
4 12 (2.67%) Data Quality
5 9 (2.00%) GDPR
6 8 (1.78%) WCAG
7 5 (1.11%) GRC
8 3 (0.67%) ISO 22301
9 2 (0.45%) ISO/IEC 27001
9 2 (0.45%) NIST
10 1 (0.22%) Cyber Essentials
10 1 (0.22%) HIPAA
10 1 (0.22%) P3O
10 1 (0.22%) PCI DSS
10 1 (0.22%) Sarbanes-Oxley
10 1 (0.22%) Solvency II
System Software
1 6 (1.34%) Docker
2 2 (0.45%) Active Directory
3 1 (0.22%) DFS Replication
3 1 (0.22%) Job Entry Subsystem
3 1 (0.22%) Time Sharing Option
3 1 (0.22%) Virtual Desktop
Systems Management
1 5 (1.11%) Kubernetes
2 3 (0.67%) Ansible
2 3 (0.67%) Rancher
3 2 (0.45%) Terraform
4 1 (0.22%) Active Directory Federation Services
4 1 (0.22%) Grafana
4 1 (0.22%) Microsoft Intune
4 1 (0.22%) Prometheus
4 1 (0.22%) Single Sign-On
Vendors
1 68 (15.14%) Microsoft
2 34 (7.57%) SAP
3 20 (4.45%) Salesforce
3 20 (4.45%) ServiceNow
4 17 (3.79%) Oracle
5 11 (2.45%) Google
6 9 (2.00%) Adobe
7 8 (1.78%) Siemens
8 7 (1.56%) Mercator
9 5 (1.11%) Atlassian
9 5 (1.11%) Workday
10 4 (0.89%) OpenLink
10 4 (0.89%) Sybase
10 4 (0.89%) TIBCO
11 3 (0.67%) Guidewire
12 2 (0.45%) eFront
12 2 (0.45%) Siebel
13 1 (0.22%) Cisco
13 1 (0.22%) IBM
13 1 (0.22%) Syncsort