Public Sector Jobs with Hybrid/Remote/WFH Options

Public Sector
UK > Work from Home

The table below looks at the prevalence of the term Public Sector in remote or hybrid work. Included is a benchmarking guide to the salaries offered in vacancies that cited Public Sector over the 6 months leading up to 22 June 2025, comparing them to the same period in the previous two years.

6 months to
22 Jun 2025
Same period 2024 Same period 2023
Rank 87 49 60
Rank change year-on-year -38 +11 +6
Permanent jobs citing Public Sector 765 1,784 1,835
As % of all permanent jobs with a WFH option 3.87% 4.98% 5.01%
As % of the General category 4.98% 8.29% 7.67%
Number of salaries quoted 355 1,433 1,271
10th Percentile £33,200 £37,500 £35,500
25th Percentile £45,000 £43,750 £43,050
Median annual salary (50th Percentile) £59,250 £57,965 £57,500
Median % change year-on-year +2.22% +0.81% +4.55%
75th Percentile £68,750 £73,750 £75,150
90th Percentile £80,000 £84,964 £87,500
UK median annual salary £60,000 £55,000 £55,000
% change year-on-year +9.09% - -

All General Skills
Work from Home

Public Sector falls under the General Skills category. For comparison with the information above, the following table provides summary statistics for all permanent job vacancies with remote or hybrid options requiring common skills.

Permanent vacancies with a requirement for common skills 15,371 21,511 23,928
As % of all permanent jobs with a WFH option 77.82% 60.09% 65.37%
Number of salaries quoted 7,710 15,304 16,588
10th Percentile £25,087 £31,750 £36,250
25th Percentile £35,000 £41,250 £46,570
Median annual salary (50th Percentile) £55,000 £55,000 £62,500
Median % change year-on-year - -12.00% +4.17%
75th Percentile £76,250 £75,000 £82,500
90th Percentile £102,500 £96,250 £105,000
UK median annual salary £55,000 £52,500 £60,000
% change year-on-year +4.76% -12.50% -

Public Sector
Trend for Jobs with a WFH Option

Job vacancies with remote working options citing Public Sector as a proportion of all IT jobs advertised.
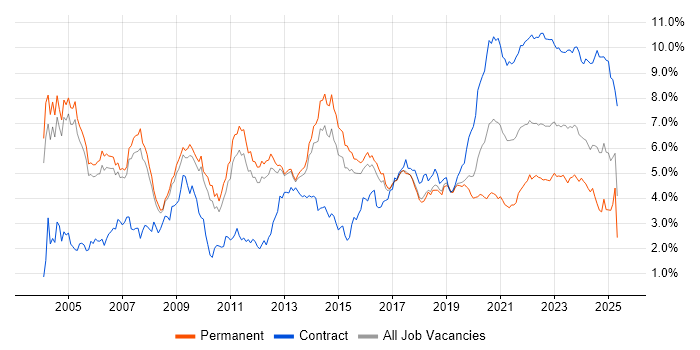
Public Sector trend for jobs with Hybrid/Remote/WFH options

Public Sector
Salary Trend for Jobs with a WFH Option

3-month moving average salary quoted in job vacancies with remote working options citing Public Sector.

Public Sector salary trend for jobs with a WFH option

Public Sector
Salary Histogram for Jobs with a WFH Option

Salary distribution for jobs with remote working options citing Public Sector over the 6 months to 22 June 2025.

Public Sector salary histogram for jobs with a WFH option

Public Sector
Co-occurring Skills and Capabilities with WFH Options by Category

The follow tables expand on the table above by listing co-occurrences grouped by category. The same employment type, locality and period is covered with up to 20 co-occurrences shown in each of the following categories:

Application Platforms
1 10 (1.31%) Confluence
2 9 (1.18%) SharePoint
3 8 (1.05%) Microsoft Exchange
4 5 (0.65%) Apache
4 5 (0.65%) IIS
5 2 (0.26%) Oracle Workflow
6 1 (0.13%) Apache Spark
6 1 (0.13%) CMS
6 1 (0.13%) Jupyter
6 1 (0.13%) Moodle
6 1 (0.13%) Totara
6 1 (0.13%) WordPress
Applications
1 27 (3.53%) Microsoft Office
2 18 (2.35%) Microsoft Excel
3 12 (1.57%) Adobe XD
4 9 (1.18%) AutoCAD
5 7 (0.92%) Spreadsheet
5 7 (0.92%) Trello
6 6 (0.78%) Microsoft PowerPoint
7 5 (0.65%) Microsoft Project
8 4 (0.52%) Notion
9 3 (0.39%) MS Visio
9 3 (0.39%) Stata
10 2 (0.26%) Oracle Smart View
11 1 (0.13%) Adobe Creative Suite
11 1 (0.13%) Adobe Illustrator
11 1 (0.13%) Adobe Premiere
11 1 (0.13%) InDesign
11 1 (0.13%) MicroStation
11 1 (0.13%) Photoshop
Business Applications
1 14 (1.83%) Salesforce CRM
2 10 (1.31%) Dynamics CRM
3 5 (0.65%) NetSuite
4 3 (0.39%) Shopify
4 3 (0.39%) Sparx Enterprise Architect
5 2 (0.26%) Oracle Assets
5 2 (0.26%) Oracle Cash Management
5 2 (0.26%) Oracle ERP
5 2 (0.26%) Oracle Financials
5 2 (0.26%) Oracle General Ledger
5 2 (0.26%) Oracle Payables
5 2 (0.26%) Oracle Receivables
6 1 (0.13%) Dynamics NAV
6 1 (0.13%) Unit4 Business World
Cloud Services
1 99 (12.94%) Azure
2 70 (9.15%) AWS
3 50 (6.54%) Power Platform
4 25 (3.27%) GCP
5 24 (3.14%) Azure DevOps
5 24 (3.14%) Dynamics 365
5 24 (3.14%) SaaS
6 22 (2.88%) GitHub
7 20 (2.61%) Power Automate
8 19 (2.48%) Microsoft 365
8 19 (2.48%) Serverless
9 18 (2.35%) PowerApps
10 16 (2.09%) PaaS
11 14 (1.83%) Google Analytics
12 13 (1.70%) GitHub Actions
13 12 (1.57%) AWS Lambda
13 12 (1.57%) Entra ID
14 10 (1.31%) Figma
14 10 (1.31%) IaaS
15 8 (1.05%) Amazon EC2
Communications & Networking
1 20 (2.61%) Firewall
2 15 (1.96%) WAN
3 13 (1.70%) DNS
4 12 (1.57%) Network Security
5 11 (1.44%) TCP/IP
6 9 (1.18%) LAN
6 9 (1.18%) Wi-Fi
7 6 (0.78%) VPN
8 5 (0.65%) 4G
8 5 (0.65%) 5G
8 5 (0.65%) BGP
8 5 (0.65%) DHCP
8 5 (0.65%) MPLS
8 5 (0.65%) SAN
8 5 (0.65%) Unified Communications
9 4 (0.52%) Ethernet
9 4 (0.52%) VoIP
10 3 (0.39%) Intrusion Detection
10 3 (0.39%) OSPF
10 3 (0.39%) SD-WAN
Database & Business Intelligence
1 33 (4.31%) Power BI
2 24 (3.14%) SQL Server
3 16 (2.09%) Relational Database
4 14 (1.83%) PostgreSQL
5 12 (1.57%) MySQL
6 10 (1.31%) MongoDB
7 8 (1.05%) DynamoDB
8 6 (0.78%) Azure SQL Database
8 6 (0.78%) Data Warehouse
9 5 (0.65%) Amazon RDS
9 5 (0.65%) NoSQL
10 4 (0.52%) Metadata
10 4 (0.52%) Power Query
10 4 (0.52%) SQL Server Integration Services
11 3 (0.39%) Redis
11 3 (0.39%) Tableau
12 2 (0.26%) Amazon Redshift
12 2 (0.26%) Big Data
12 2 (0.26%) BigQuery
12 2 (0.26%) Oracle Exadata
Development Applications
1 19 (2.48%) JIRA
2 13 (1.70%) Git
3 12 (1.57%) Axure RP
3 12 (1.57%) Balsamiq
4 9 (1.18%) SonarQube
5 7 (0.92%) Jenkins
6 5 (0.65%) JMeter
7 4 (0.52%) ERwin
7 4 (0.52%) JUnit
7 4 (0.52%) Mockito
7 4 (0.52%) Selenium
7 4 (0.52%) Visual Studio
8 3 (0.39%) GitLab
9 2 (0.26%) Cypress.io
9 2 (0.26%) Locust
9 2 (0.26%) Octopus Deploy
9 2 (0.26%) Postman
9 2 (0.26%) SQL Server Management Studio (SSMS)
9 2 (0.26%) TeamCity
9 2 (0.26%) WebDriver
General
1 470 (61.44%) Social Skills
2 380 (49.67%) Finance
3 335 (43.79%) Marketing
4 98 (12.81%) Inclusion and Diversity
5 62 (8.10%) Local Government
6 58 (7.58%) Telecoms
7 57 (7.45%) Analytical Skills
8 50 (6.54%) Manufacturing
9 47 (6.14%) Electronics
10 39 (5.10%) Legal
11 30 (3.92%) Law
12 20 (2.61%) Presentation Skills
13 12 (1.57%) Organisational Skills
14 8 (1.05%) Aerospace
14 8 (1.05%) Retail
15 7 (0.92%) Influencing Skills
15 7 (0.92%) Tech for Good
16 6 (0.78%) Advertising
16 6 (0.78%) Back Office
17 5 (0.65%) Billing
Job Titles
1 272 (35.56%) Business Manager
2 270 (35.29%) Development Manager
3 267 (34.90%) Business Development Manager
4 59 (7.71%) Senior
5 49 (6.41%) Consultant
6 45 (5.88%) Developer
7 39 (5.10%) Analyst
8 38 (4.97%) Architect
9 37 (4.84%) Infrastructure Engineer
10 32 (4.18%) Lead
11 30 (3.92%) Civil Engineer
12 27 (3.53%) Development Engineer
13 19 (2.48%) Designer
14 17 (2.22%) Senior Developer
15 16 (2.09%) IT Consultant
16 15 (1.96%) Principal Engineer
17 13 (1.70%) Recruitment Consultant
18 12 (1.57%) Product Manager
18 12 (1.57%) Systems Engineer
19 11 (1.44%) 1st Line Support
Libraries, Frameworks & Software Standards
1 19 (2.48%) HTML
2 18 (2.35%) CSS
3 15 (1.96%) RESTful
4 14 (1.83%) Kafka
4 14 (1.83%) React
5 13 (1.70%) Spring Boot
6 11 (1.44%) AngularJS
6 11 (1.44%) JSON
7 10 (1.31%) Spring
8 9 (1.18%) .NET
8 9 (1.18%) REST
8 9 (1.18%) XML
9 7 (0.92%) OAuth
10 6 (0.78%) .NET Framework
10 6 (0.78%) ARM Templates
10 6 (0.78%) PySpark
11 5 (0.65%) ASP.NET Web API
11 5 (0.65%) HTML5 Canvas
11 5 (0.65%) SOAP
11 5 (0.65%) Vue
Miscellaneous
1 50 (6.54%) NHS
2 29 (3.79%) Management Information System
3 28 (3.66%) Cloud Native
4 26 (3.40%) Onboarding
5 24 (3.14%) Product Ownership
5 24 (3.14%) Self-Motivation
6 22 (2.88%) Data Centre
7 19 (2.48%) PMI
8 17 (2.22%) Renewable Energy
9 14 (1.83%) Social Media
10 12 (1.57%) SCADA
11 11 (1.44%) Housing Association
12 9 (1.18%) IoT
13 8 (1.05%) Operational Technology
14 5 (0.65%) Client/Server
14 5 (0.65%) Hybrid Cloud
14 5 (0.65%) Public Cloud
15 4 (0.52%) CCTV
15 4 (0.52%) Legacy Systems
16 3 (0.39%) Driving Licence
Operating Systems
1 33 (4.31%) Windows
2 24 (3.14%) Windows Server
3 15 (1.96%) Linux
4 9 (1.18%) Windows Server 2019
5 8 (1.05%) Unix
6 5 (0.65%) Windows 10
7 3 (0.39%) Mac OS
7 3 (0.39%) Rocky
8 2 (0.26%) Windows Server 2016
9 1 (0.13%) Android
9 1 (0.13%) Apple iOS
9 1 (0.13%) Kali Linux
9 1 (0.13%) Robot Operating System
9 1 (0.13%) Solaris
9 1 (0.13%) Windows Server 2012
Processes & Methodologies
1 301 (39.35%) Business Development
2 286 (37.39%) Collaborative Culture
3 283 (36.99%) Collaborative Working
4 268 (35.03%) Facilities Management
4 268 (35.03%) Marketing Strategy
5 131 (17.12%) Agile
6 115 (15.03%) Project Management
7 97 (12.68%) Project Delivery
8 95 (12.42%) Continuous Improvement
9 83 (10.85%) Problem-Solving
10 80 (10.46%) Business Intelligence
11 79 (10.33%) Stakeholder Management
12 76 (9.93%) Mentoring
13 72 (9.41%) Cybersecurity
14 65 (8.50%) DevOps
15 61 (7.97%) Analytics
16 50 (6.54%) Digital Marketing
17 49 (6.41%) Programme Management
18 42 (5.49%) Decision-Making
18 42 (5.49%) Roadmaps
Programming Languages
1 53 (6.93%) Python
2 52 (6.80%) SQL
3 31 (4.05%) JavaScript
4 25 (3.27%) Java
5 22 (2.88%) C#
6 17 (2.22%) PowerShell
7 8 (1.05%) TypeScript
8 6 (0.78%) PHP
8 6 (0.78%) R
8 6 (0.78%) Ruby
9 4 (0.52%) Apex Code
10 3 (0.39%) C++
10 3 (0.39%) Groovy
11 2 (0.26%) Bash
11 2 (0.26%) Bicep
11 2 (0.26%) Data Analysis Expressions
12 1 (0.13%) PL/SQL
12 1 (0.13%) Shell Script
12 1 (0.13%) T-SQL
12 1 (0.13%) VBA
Qualifications
1 146 (19.08%) Security Cleared
2 103 (13.46%) Degree
3 98 (12.81%) SC Cleared
4 36 (4.71%) DV Cleared
5 24 (3.14%) PMI Certification
6 23 (3.01%) BPSS Clearance
7 15 (1.96%) Postgraduate
8 14 (1.83%) Azure Certification
8 14 (1.83%) Master's Degree
8 14 (1.83%) Microsoft Certification
9 12 (1.57%) Chartered Engineer
10 10 (1.31%) DBS Check
11 9 (1.18%) AWS Certification
12 8 (1.05%) ITIL Certification
13 6 (0.78%) APMG
13 6 (0.78%) CISSP
14 5 (0.65%) Cisco Certification
14 5 (0.65%) Computer Science Degree
14 5 (0.65%) Network+ Certification
14 5 (0.65%) PMP
Quality Assurance & Compliance
1 51 (6.67%) Accessibility
2 15 (1.96%) QA
3 14 (1.83%) WCAG
4 13 (1.70%) ISO/IEC 27001
5 11 (1.44%) PMO
6 9 (1.18%) NCSC
7 7 (0.92%) Data Quality
8 6 (0.78%) Def Stans
9 5 (0.65%) Cyber Essentials
9 5 (0.65%) GDPR
10 4 (0.52%) ITGC
10 4 (0.52%) NIST
11 3 (0.39%) IEC 61508
11 3 (0.39%) ISO 9001
11 3 (0.39%) PCI DSS
12 2 (0.26%) ISO 14001
13 1 (0.13%) COBIT
13 1 (0.13%) HIPAA
13 1 (0.13%) JSP 440
13 1 (0.13%) SLA
System Software
1 25 (3.27%) Docker
2 20 (2.61%) Active Directory
3 12 (1.57%) VMware Infrastructure
4 5 (0.65%) Hyper-V
5 2 (0.26%) Virtual Desktop
5 2 (0.26%) Virtual Servers
5 2 (0.26%) VMware ESXi
6 1 (0.13%) Embedded Firmware
6 1 (0.13%) Firmware
6 1 (0.13%) vSphere
Systems Management
1 26 (3.40%) Kubernetes
2 25 (3.27%) Terraform
3 10 (1.31%) Ansible
4 7 (0.92%) Grafana
5 6 (0.78%) Microsoft Intune
5 6 (0.78%) ZABBIX
6 4 (0.52%) Cisco CUCM
6 4 (0.52%) Prometheus
7 3 (0.39%) Functional Safety
7 3 (0.39%) SmoothWall
8 2 (0.26%) FortiGate
8 2 (0.26%) vCenter Server
9 1 (0.13%) Active Directory Federation Services
9 1 (0.13%) DameWare
9 1 (0.13%) Data Guard
9 1 (0.13%) Nessus
9 1 (0.13%) Oracle ZFS
9 1 (0.13%) SCCM
9 1 (0.13%) Single Sign-On
Vendors
1 108 (14.12%) Microsoft
2 51 (6.67%) SAP
3 29 (3.79%) Google
4 28 (3.66%) Salesforce
5 20 (2.61%) Cisco
5 20 (2.61%) VMware
6 19 (2.48%) Oracle
7 17 (2.22%) Adobe
8 14 (1.83%) Facebook
9 12 (1.57%) YouTube
10 11 (1.44%) Apple
10 11 (1.44%) ServiceNow
11 9 (1.18%) Fortinet
11 9 (1.18%) Palo Alto
12 7 (0.92%) Databricks
13 6 (0.78%) Meraki
14 5 (0.65%) EMC
14 5 (0.65%) Extreme Networks
15 4 (0.52%) Mercator
16 3 (0.39%) Juniper