Test-Driven Development (TDD)
UK

The table below provides summary statistics for permanent job vacancies requiring TDD skills. It includes a benchmarking guide to the annual salaries offered in vacancies that cited TDD over the 6 months leading up to 12 May 2025, comparing them to the same period in the previous two years.

6 months to
12 May 2025
Same period 2024 Same period 2023
Rank 187 116 76
Rank change year-on-year -71 -40 -33
Permanent jobs citing TDD 923 2,352 4,128
As % of all permanent jobs advertised in the UK 1.67% 2.37% 4.09%
As % of the Processes & Methodologies category 1.78% 2.77% 4.28%
Number of salaries quoted 574 1,810 2,638
10th Percentile £48,225 £40,000 £46,250
25th Percentile £57,500 £48,750 £56,250
Median annual salary (50th Percentile) £68,783 £60,000 £70,000
Median % change year-on-year +14.64% -14.29% +3.93%
75th Percentile £93,750 £80,000 £90,000
90th Percentile £111,250 £100,000 £106,625
UK excluding London median annual salary £65,000 £57,500 £62,500
% change year-on-year +13.04% -8.00% +8.70%

All Process and Methodology Skills
UK

TDD falls under the Processes and Methodologies category. For comparison with the information above, the following table provides summary statistics for all permanent job vacancies requiring process or methodology skills.

Permanent vacancies with a requirement for process or methodology skills 51,728 84,924 96,446
As % of all permanent jobs advertised in the UK 93.83% 85.58% 95.59%
Number of salaries quoted 26,848 59,902 56,809
10th Percentile £30,000 £29,010 £34,000
25th Percentile £42,415 £40,000 £45,000
Median annual salary (50th Percentile) £57,500 £55,000 £61,000
Median % change year-on-year +4.55% -9.84% +1.67%
75th Percentile £75,000 £72,500 £81,250
90th Percentile £97,500 £92,500 £100,000
UK excluding London median annual salary £52,500 £50,000 £55,000
% change year-on-year +5.00% -9.09% +4.76%

TDD
Job Vacancy Trend

Job postings citing TDD as a proportion of all IT jobs advertised.
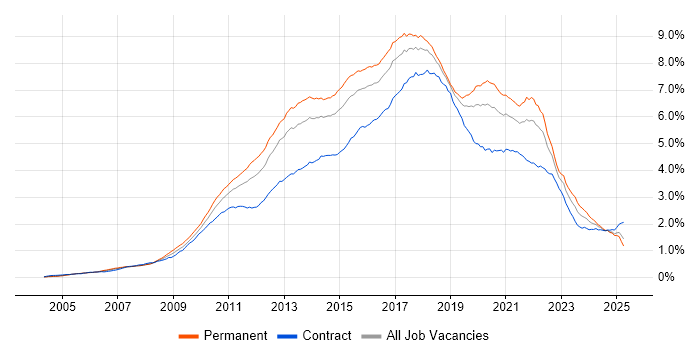
Job vacancy trend for TDD in the UK

TDD
Salary Trend

3-month moving average salary quoted in jobs citing TDD.

Salary trend for TDD in the UK

TDD
Salary Histogram

Salary distribution for jobs citing TDD over the 6 months to 12 May 2025.

Salary histogram for TDD in the UK

TDD
Top 16 Job Locations

The table below looks at the demand and provides a guide to the median salaries quoted in IT jobs citing TDD within the UK over the 6 months to 12 May 2025. The 'Rank Change' column provides an indication of the change in demand within each location based on the same 6 month period last year.

Location Rank Change
on Same Period
Last Year
Matching
Permanent
IT Job Ads
Median Salary
Past 6 Months
Median Salary
% Change
on Same Period
Last Year
Live
Jobs
England -66 803 £67,500 +12.50% 824
UK excluding London -67 606 £65,000 +13.04% 584
Work from Home -38 517 £70,000 +16.67% 605
London -38 323 £82,500 - 401
North of England -80 173 £70,000 +21.74% 196
South East -40 170 £62,500 +8.70% 177
North West -96 136 £67,500 +12.50% 140
Scotland -1 98 £85,253 +51.38% 49
Midlands +27 91 £60,000 +14.29% 57
West Midlands +10 52 £61,250 +16.67% 39
East Midlands +48 39 £40,000 -23.81% 17
South West +22 33 £67,500 +12.50% 49
East of England -24 33 £67,500 +12.50% 45
Yorkshire -3 26 £76,905 +39.83% 43
North East +18 11 £55,000 - 14
Wales +23 10 £70,000 +55.56% 9

TDD
Co-occurring Skills and Capabilities by Category

The follow tables expand on the table above by listing co-occurrences grouped by category. The same employment type, locality and period is covered with up to 20 co-occurrences shown in each of the following categories:

Application Platforms
1 187 (20.26%) Confluence
2 14 (1.52%) Apache Spark
2 14 (1.52%) CMS
2 14 (1.52%) JBoss
3 13 (1.41%) Red Hat Fuse
4 11 (1.19%) Apache Airflow
5 8 (0.87%) OpenStack
6 7 (0.76%) Apache
7 6 (0.65%) IIS
7 6 (0.65%) Microsoft Exchange
8 5 (0.54%) Liferay
9 4 (0.43%) GemFire
9 4 (0.43%) Headless CMS
9 4 (0.43%) WordPress
10 3 (0.33%) Oracle SOA Suite
10 3 (0.33%) SharePoint
11 1 (0.11%) Drupal
11 1 (0.11%) EPiServer
11 1 (0.11%) NServiceBus
11 1 (0.11%) Umbraco
Applications
1 3 (0.33%) MS Visio
2 2 (0.22%) Chatbot
3 1 (0.11%) AutoCAD
3 1 (0.11%) Revit
3 1 (0.11%) Trello
Business Applications
1 10 (1.08%) Dynamics CRM
2 4 (0.43%) Payment Gateway
Cloud Services
1 459 (49.73%) AWS
2 371 (40.20%) Azure
3 265 (28.71%) GCP
4 95 (10.29%) Serverless
5 78 (8.45%) SaaS
6 52 (5.63%) Amazon EC2
6 52 (5.63%) GitHub
7 45 (4.88%) Amazon ECS
8 42 (4.55%) Amazon EKS
9 39 (4.23%) AWS Lambda
10 32 (3.47%) Azure DevOps
11 30 (3.25%) Amazon S3
12 25 (2.71%) Amazon SQS
13 23 (2.49%) Dynamics 365
13 23 (2.49%) Power Platform
14 19 (2.06%) PowerApps
15 16 (1.73%) Azure Synapse Analytics
16 13 (1.41%) Apigee
16 13 (1.41%) Google Kubernetes Engine
17 11 (1.19%) Azure API Management
Communications & Networking
1 10 (1.08%) Wireless
2 9 (0.98%) Internet
3 8 (0.87%) Bluetooth
4 7 (0.76%) Modbus
4 7 (0.76%) Profibus
4 7 (0.76%) RS-232
4 7 (0.76%) RS-485
4 7 (0.76%) ZigBee
5 4 (0.43%) 3GPP
5 4 (0.43%) 5G
5 4 (0.43%) FTP
6 2 (0.22%) Broadband
6 2 (0.22%) Network Security
7 1 (0.11%) Ethernet
7 1 (0.11%) SAN
7 1 (0.11%) TCP/IP
7 1 (0.11%) Wi-Fi
Database & Business Intelligence
1 236 (25.57%) SQL Server
2 97 (10.51%) PostgreSQL
3 80 (8.67%) NoSQL
4 66 (7.15%) MongoDB
5 61 (6.61%) Relational Database
6 41 (4.44%) MySQL
7 30 (3.25%) Elasticsearch
8 27 (2.93%) DynamoDB
9 26 (2.82%) RDBMS
9 26 (2.82%) Redis
10 19 (2.06%) Azure SQL Database
11 15 (1.63%) Big Data
12 13 (1.41%) Amazon RDS
13 12 (1.30%) SQLite
14 11 (1.19%) Amazon Aurora
15 8 (0.87%) Apache Hive
15 8 (0.87%) Data Lake
15 8 (0.87%) Power BI
16 7 (0.76%) Couchbase
17 6 (0.65%) SQL CLR
Development Applications
1 206 (22.32%) JIRA
2 195 (21.13%) SonarQube
3 193 (20.91%) Maven
4 176 (19.07%) Git
4 176 (19.07%) Selenium
5 170 (18.42%) Sonatype Nexus
6 169 (18.31%) Cucumber
7 168 (18.20%) GitLab
8 164 (17.77%) Bitbucket
9 135 (14.63%) Jenkins
10 70 (7.58%) JUnit
11 32 (3.47%) Mockito
12 21 (2.28%) JMeter
13 18 (1.95%) Octopus Deploy
14 16 (1.73%) IntelliJ
15 13 (1.41%) Visual Studio
16 12 (1.30%) Gradle
17 11 (1.19%) NUnit
18 10 (1.08%) webpack
19 8 (0.87%) PHPUnit
General
1 372 (40.30%) Finance
2 282 (30.55%) Banking
3 178 (19.28%) Inclusion and Diversity
4 146 (15.82%) Social Skills
5 55 (5.96%) Public Sector
6 46 (4.98%) Tech for Good
7 36 (3.90%) Analytical Skills
7 36 (3.90%) Front Office
8 28 (3.03%) Financial Institution
9 26 (2.82%) Games
10 19 (2.06%) Health Technology
10 19 (2.06%) Organisational Skills
10 19 (2.06%) Publishing
11 18 (1.95%) Manufacturing
11 18 (1.95%) Retail
12 16 (1.73%) Law
13 14 (1.52%) Electronics
14 12 (1.30%) Retail Banking
15 11 (1.19%) Influencing Skills
15 11 (1.19%) Marketing
Job Titles
1 382 (41.39%) Software Engineer
2 353 (38.24%) Developer
3 196 (21.24%) Senior
4 115 (12.46%) Lead
5 89 (9.64%) Senior Software Engineer
6 83 (8.99%) Java Developer
7 70 (7.58%) Full-Stack Developer
8 67 (7.26%) Senior Developer
9 62 (6.72%) .NET Developer
10 57 (6.18%) Java Engineer
11 52 (5.63%) Software Developer
12 39 (4.23%) Lead Developer
13 36 (3.90%) Full-Stack Engineer
13 36 (3.90%) Java Software Engineer
14 32 (3.47%) C# Developer
15 28 (3.03%) Full-Stack Software Engineer
16 26 (2.82%) Senior Java Engineer
17 18 (1.95%) Lead Software Engineer
17 18 (1.95%) PHP Developer
17 18 (1.95%) Principal Engineer
Libraries, Frameworks & Software Standards
1 360 (39.00%) React
2 309 (33.48%) Spring
3 289 (31.31%) Spring Boot
4 256 (27.74%) HTML
5 252 (27.30%) Kafka
6 239 (25.89%) CSS
7 202 (21.89%) Hibernate
8 193 (20.91%) .NET
9 189 (20.48%) Redux
10 169 (18.31%) JPA
11 145 (15.71%) REST
12 139 (15.06%) AngularJS
13 122 (13.22%) RESTful
14 91 (9.86%) Node.js
15 77 (8.34%) Web Services
16 71 (7.69%) .NET Core
17 62 (6.72%) Vue
18 53 (5.74%) .NET Framework
19 36 (3.90%) Laravel
20 35 (3.79%) Entity Framework
Miscellaneous
1 209 (22.64%) Product Ownership
2 166 (17.98%) Enterprise Software
3 87 (9.43%) Distributed Systems
4 46 (4.98%) Cloud Native
5 26 (2.82%) Mobile App
6 23 (2.49%) Management Information System
6 23 (2.49%) Public Cloud
7 21 (2.28%) Greenfield Project
8 20 (2.17%) Algorithms
8 20 (2.17%) Foreign Exchange (FX)
9 19 (2.06%) Data Structures
10 16 (1.73%) Equities
11 15 (1.63%) Fixed Income
12 13 (1.41%) Virtual Team
13 12 (1.30%) Hedge funds
13 12 (1.30%) Reference Data
13 12 (1.30%) Replication
14 11 (1.19%) Legacy Systems
15 10 (1.08%) Team-Oriented Environment
16 9 (0.98%) Embedded Systems
Operating Systems
1 50 (5.42%) Linux
2 26 (2.82%) Unix
3 21 (2.28%) Android
4 16 (1.73%) Apple iOS
5 14 (1.52%) Windows
6 7 (0.76%) FreeRTOS
7 6 (0.65%) Windows Server
8 1 (0.11%) Debian
Processes & Methodologies
1 653 (70.75%) Agile
2 496 (53.74%) Software Engineering
3 449 (48.65%) Microservices
4 439 (47.56%) CI/CD
5 383 (41.50%) DevOps
6 336 (36.40%) Full-Stack Development
7 308 (33.37%) Test Automation
8 240 (26.00%) Containerisation
9 236 (25.57%) SDLC
10 213 (23.08%) Clean Code
11 207 (22.43%) Continuous Improvement
12 202 (21.89%) BDD
13 184 (19.93%) Front End Development
14 169 (18.31%) Performance Optimisation
15 141 (15.28%) Mentoring
16 136 (14.73%) Scrum
17 135 (14.63%) Unit Testing
18 130 (14.08%) Problem-Solving
19 126 (13.65%) Pair Programming
20 101 (10.94%) Continuous Integration
Programming Languages
1 438 (47.45%) Java
2 372 (40.30%) JavaScript
3 340 (36.84%) SQL
4 200 (21.67%) C#
5 169 (18.31%) Python
6 131 (14.19%) TypeScript
7 67 (7.26%) PHP
8 35 (3.79%) Go
9 23 (2.49%) Shell Script
10 17 (1.84%) C++
10 17 (1.84%) Kotlin
11 12 (1.30%) C
12 11 (1.19%) Bash
12 11 (1.19%) Swift
13 8 (0.87%) Ruby
14 7 (0.76%) Scala
15 5 (0.54%) Bicep
15 5 (0.54%) Delphi
15 5 (0.54%) T-SQL
16 4 (0.43%) RPG IV
Qualifications
1 79 (8.56%) Degree
2 55 (5.96%) Security Cleared
3 48 (5.20%) SC Cleared
4 18 (1.95%) Computer Science Degree
5 15 (1.63%) Master's Degree
6 14 (1.52%) PhD
7 7 (0.76%) DV Cleared
8 6 (0.65%) Azure Certification
9 5 (0.54%) Microsoft Certification
10 4 (0.43%) AWS Certification
11 3 (0.33%) HND
11 3 (0.33%) OCP
11 3 (0.33%) Oracle Certification
12 2 (0.22%) BPSS Clearance
13 1 (0.11%) ISEB
13 1 (0.11%) ISTQB
13 1 (0.11%) Numerate Degree
13 1 (0.11%) SANS
Quality Assurance & Compliance
1 234 (25.35%) QA
2 28 (3.03%) Accessibility
3 17 (1.84%) SLA
4 5 (0.54%) Software Quality Assurance
5 4 (0.43%) GDPR
5 4 (0.43%) NCSC
6 2 (0.22%) PCI DSS
7 1 (0.11%) GRC
System Software
1 403 (43.66%) Docker
2 8 (0.87%) Embedded Firmware
2 8 (0.87%) Firmware
3 7 (0.76%) VMware Infrastructure
4 5 (0.54%) Active Directory
5 4 (0.43%) Postfix
6 1 (0.11%) KVM
6 1 (0.11%) Virtual Machines
6 1 (0.11%) Xen
Systems Management
1 389 (42.15%) Kubernetes
2 74 (8.02%) Terraform
3 21 (2.28%) Ansible
4 19 (2.06%) Kibana
5 13 (1.41%) Istio
6 9 (0.98%) Grafana
7 5 (0.54%) Prometheus
8 3 (0.33%) Control-M
8 3 (0.33%) Progress Chef
8 3 (0.33%) Puppet
9 2 (0.22%) MIIS
10 1 (0.11%) CFEngine
10 1 (0.11%) vRealize
Vendors
1 161 (17.44%) Solace
2 62 (6.72%) Microsoft
3 35 (3.79%) Google
4 25 (2.71%) Databricks
5 23 (2.49%) Splunk
6 21 (2.28%) Dynatrace
7 19 (2.06%) Oracle
8 13 (1.41%) Atlassian
9 8 (0.87%) VMware
10 6 (0.65%) IBM
10 6 (0.65%) SAP
11 5 (0.54%) Salesforce
12 4 (0.43%) Adobe
12 4 (0.43%) EMC
12 4 (0.43%) Tealium
12 4 (0.43%) TIBCO
13 3 (0.33%) Borland
13 3 (0.33%) CA Agile Central
13 3 (0.33%) Sage
13 3 (0.33%) Snowplow