Junior
UK

The median Junior salary in the UK is £40,101 per year, according to job vacancies posted during the 6 months leading to 11 May 2025.

The table below provides salary benchmarking and summary statistics, comparing them to the same period in the previous two years.

6 months to
11 May 2025
Same period 2024 Same period 2023
Rank 246 223 273
Rank change year-on-year -23 +50 -14
Permanent jobs requiring a Junior 693 1,339 1,340
As % of all permanent jobs advertised in the UK 1.27% 1.35% 1.33%
As % of the Job Titles category 1.40% 1.43% 1.45%
Number of salaries quoted 545 1,106 985
10th Percentile £25,000 £22,500 £24,163
25th Percentile £28,500 £25,000 £27,500
Median annual salary (50th Percentile) £40,101 £30,000 £35,000
Median % change year-on-year +33.67% -14.29% -
75th Percentile £42,627 £37,500 £45,000
90th Percentile £52,500 £47,500 £56,250
UK excluding London median annual salary £40,101 £30,000 £33,500
% change year-on-year +33.67% -10.45% +3.08%

All Permanent IT Job Vacancies
UK

For comparison with the information above, the following table provides summary statistics for all permanent IT job vacancies. Most job vacancies include a discernible job title that can be normalized. As such, the figures in the second row provide an indication of the number of permanent jobs in our overall sample.

Permanent vacancies in the UK with a recognized job title 49,511 93,886 92,389
% of permanent jobs with a recognized job title 90.48% 94.63% 91.46%
Number of salaries quoted 27,626 67,255 58,266
10th Percentile £30,000 £28,500 £32,500
25th Percentile £41,250 £38,500 £45,000
Median annual salary (50th Percentile) £57,443 £52,500 £60,000
Median % change year-on-year +9.41% -12.50% -
75th Percentile £75,000 £71,250 £81,000
90th Percentile £97,500 £90,000 £100,000
UK excluding London median annual salary £52,000 £50,000 £53,000
% change year-on-year +4.00% -5.66% +6.00%

Junior
Job Vacancy Trend

Job postings that featured Junior in the job title as a proportion of all IT jobs advertised.
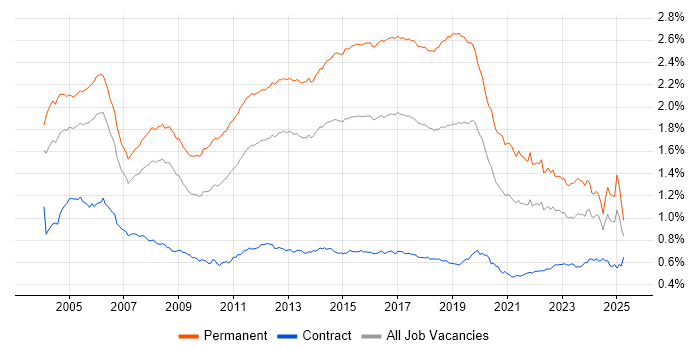
Job vacancy trend for Junior in the UK

Junior
Salary Trend

3-month moving average salary quoted in jobs citing Junior.

Salary trend for Junior in the UK

Junior
Salary Histogram

Salary distribution for jobs citing Junior over the 6 months to 11 May 2025.

Salary histogram for Junior in the UK

Junior
Top 16 Job Locations

The table below looks at the demand and provides a guide to the median salaries quoted in IT jobs citing Junior within the UK over the 6 months to 11 May 2025. The 'Rank Change' column provides an indication of the change in demand within each location based on the same 6 month period last year.

Location Rank Change
on Same Period
Last Year
Matching
Permanent
IT Job Ads
Median Salary
Past 6 Months
Median Salary
% Change
on Same Period
Last Year
Live
Jobs
England -57 585 £36,000 +20.00% 659
UK excluding London -25 522 £40,101 +33.67% 485
Work from Home -11 163 £32,500 -7.14% 365
South East -27 137 £35,000 +16.67% 185
London +15 129 £41,250 +10.00% 298
North of England -42 113 £40,101 +40.70% 124
East of England +15 76 £32,500 +17.12% 47
South West +48 68 £37,550 +25.17% 40
North West -81 60 £45,000 +63.64% 82
Midlands -42 58 £34,500 +35.29% 58
Scotland +108 57 £40,101 +33.67% 27
Yorkshire +41 47 £32,500 - 24
East Midlands +26 37 £35,500 +42.00% 26
West Midlands -35 21 £31,250 +15.74% 30
Wales +26 13 £40,101 +23.39% 10
North East +43 6 £29,250 +5.41% 20

Junior Skill Set
Top 30 Co-occurring Skills and Capabilities

For the 6 months to 11 May 2025, Junior job roles required the following skills and capabilities in order of popularity. The figures indicate the absolute number co-occurrences and as a proportion of all permanent job ads featuring Junior in the job title.

1 343 (49.49%) Social Skills
2 293 (42.28%) Degree
3 272 (39.25%) Problem-Solving
4 191 (27.56%) Computer Science
5 184 (26.55%) Mathematics
6 182 (26.26%) Physics
6 182 (26.26%) Continuous Improvement
7 174 (25.11%) Project Management
8 168 (24.24%) UML
8 168 (24.24%) BPSS Clearance
9 161 (23.23%) Electronics
10 155 (22.37%) Systems Engineering
11 150 (21.65%) Aerospace
12 147 (21.21%) PLM
12 147 (21.21%) Creative Problem-Solving
13 145 (20.92%) Model-Based Systems Engineering
13 145 (20.92%) Teamcenter
13 145 (20.92%) MATLAB
13 145 (20.92%) Simulink
13 145 (20.92%) IBM
13 145 (20.92%) SysML
13 145 (20.92%) Rational DOORS
14 116 (16.74%) Microsoft
15 115 (16.59%) SQL
16 109 (15.73%) Python
17 80 (11.54%) Windows
18 79 (11.40%) JavaScript
19 78 (11.26%) Azure
20 76 (10.97%) Software Engineering
20 76 (10.97%) HTML

Junior Skill Set
Co-occurring Skills and Capabilities by Category

The follow tables expand on the table above by listing co-occurrences grouped by category. The same employment type, locality and period is covered with up to 20 co-occurrences shown in each of the following categories:

Application Platforms
1 23 (3.32%) Apache
2 15 (2.16%) SharePoint
3 13 (1.88%) Confluence
4 7 (1.01%) Microsoft Exchange
5 6 (0.87%) CMS
6 5 (0.72%) Apache Airflow
7 2 (0.29%) Apache Spark
7 2 (0.29%) IIS
8 1 (0.14%) Ethereum
8 1 (0.14%) Moodle
8 1 (0.14%) NServiceBus
8 1 (0.14%) Solana
8 1 (0.14%) Totara
8 1 (0.14%) Umbraco
Applications
1 145 (20.92%) Simulink
2 44 (6.35%) Microsoft Excel
2 44 (6.35%) Microsoft Office
3 19 (2.74%) Microsoft PowerPoint
4 7 (1.01%) InDesign
5 6 (0.87%) Microsoft Project
6 5 (0.72%) Adobe XD
7 4 (0.58%) Photoshop
8 3 (0.43%) Sketch
9 2 (0.29%) Adobe Creative Suite
9 2 (0.29%) Adobe Illustrator
10 1 (0.14%) Chatbot
10 1 (0.14%) MS Visio
Business Applications
1 145 (20.92%) Teamcenter
2 2 (0.29%) Adobe Campaign
3 1 (0.14%) Dynamics CRM
3 1 (0.14%) Relativity
3 1 (0.14%) Shopify
Cloud Services
1 78 (11.26%) Azure
2 59 (8.51%) AWS
3 51 (7.36%) Microsoft 365
4 42 (6.06%) Power Platform
5 20 (2.89%) SaaS
6 10 (1.44%) Pulumi
7 9 (1.30%) Snowflake
8 8 (1.15%) Cloud Computing
8 8 (1.15%) Entra ID
8 8 (1.15%) Figma
8 8 (1.15%) Serverless
9 7 (1.01%) AWS Lambda
10 6 (0.87%) Amazon EC2
11 5 (0.72%) Amazon S3
11 5 (0.72%) AWS CloudFormation
12 4 (0.58%) Amazon ECS
12 4 (0.58%) Asana
12 4 (0.58%) Azure DevOps
12 4 (0.58%) GCP
12 4 (0.58%) OneDrive
Communications & Networking
1 52 (7.50%) Firewall
2 43 (6.20%) WAN
3 36 (5.19%) LAN
4 23 (3.32%) TCP/IP
5 14 (2.02%) MPLS
6 11 (1.59%) VPN
7 10 (1.44%) DNS
7 10 (1.44%) SAN
8 9 (1.30%) BGP
8 9 (1.30%) OSPF
9 7 (1.01%) Wi-Fi
10 5 (0.72%) Internet
10 5 (0.72%) Unified Communications
11 4 (0.58%) DHCP
11 4 (0.58%) Network Security
11 4 (0.58%) VLAN
11 4 (0.58%) Wireless
12 3 (0.43%) VoIP
13 2 (0.29%) Broadband
13 2 (0.29%) LoRaWAN
Database & Business Intelligence
1 38 (5.48%) Power BI
2 20 (2.89%) MySQL
3 16 (2.31%) BusinessObjects
3 16 (2.31%) Data Mining
4 14 (2.02%) SQL Server
5 13 (1.88%) Relational Database
6 12 (1.73%) Tableau
7 6 (0.87%) NoSQL
7 6 (0.87%) PostgreSQL
8 5 (0.72%) Big Data
8 5 (0.72%) Elasticsearch
9 4 (0.58%) Data Warehouse
9 4 (0.58%) MongoDB
10 3 (0.43%) DynamoDB
10 3 (0.43%) Semantic Layer
11 2 (0.29%) Amazon RDS
11 2 (0.29%) Azure SQL Database
11 2 (0.29%) Power Query
11 2 (0.29%) SQL Server Integration Services
11 2 (0.29%) TimescaleDB
Development Applications
1 145 (20.92%) Rational DOORS
2 37 (5.34%) Git
3 24 (3.46%) Eclipse
4 23 (3.32%) Eclipse RCP
5 21 (3.03%) JIRA
6 6 (0.87%) GitLab
7 5 (0.72%) Jenkins
8 4 (0.58%) JUnit
9 2 (0.29%) CircleCI
9 2 (0.29%) Gradle
9 2 (0.29%) Postman
9 2 (0.29%) Vite
9 2 (0.29%) webpack
10 1 (0.14%) Burp Suite
10 1 (0.14%) IDA Disassembler
10 1 (0.14%) IntelliJ
10 1 (0.14%) JMeter
10 1 (0.14%) RStudio
10 1 (0.14%) YouTrack
10 1 (0.14%) Zephyr
General
1 343 (49.49%) Social Skills
2 161 (23.23%) Electronics
3 150 (21.65%) Aerospace
4 66 (9.52%) Analytical Skills
5 63 (9.09%) Finance
6 40 (5.77%) Retail
7 29 (4.18%) Law
8 25 (3.61%) Presentation Skills
9 21 (3.03%) Marketing
10 15 (2.16%) Organisational Skills
11 13 (1.88%) Legal
12 10 (1.44%) Advertising
13 9 (1.30%) Inclusion and Diversity
14 8 (1.15%) Public Sector
15 6 (0.87%) Banking
15 6 (0.87%) Manufacturing
16 5 (0.72%) Automotive
16 5 (0.72%) Publishing
17 4 (0.58%) Aviation
17 4 (0.58%) Documentation Skills
Libraries, Frameworks & Software Standards
1 76 (10.97%) HTML
2 74 (10.68%) CSS
3 34 (4.91%) Node.js
4 30 (4.33%) .NET
5 24 (3.46%) Middleware
5 24 (3.46%) React
6 23 (3.32%) JSP
7 22 (3.17%) RESTful
8 13 (1.88%) Laravel
8 13 (1.88%) REST
9 12 (1.73%) AngularJS
9 12 (1.73%) Web Services
10 9 (1.30%) .NET Framework
10 9 (1.30%) Pandas
10 9 (1.30%) Spring
11 8 (1.15%) CakePHP
11 8 (1.15%) HTML5
12 7 (1.01%) ASP.NET
12 7 (1.01%) Vue
13 6 (0.87%) GraphQL
Miscellaneous
1 24 (3.46%) Driving Licence
2 22 (3.17%) Data Structures
3 14 (2.02%) Self-Motivation
4 12 (1.73%) Hedge funds
5 11 (1.59%) Embedded Systems
5 11 (1.59%) Public Cloud
6 9 (1.30%) Podcast
7 8 (1.15%) Mobile App
8 7 (1.01%) Product Ownership
8 7 (1.01%) Social Media
9 6 (0.87%) Algorithms
9 6 (0.87%) Private Cloud
9 6 (0.87%) Renewable Energy
10 5 (0.72%) Data Centre
10 5 (0.72%) Legacy Systems
10 5 (0.72%) Onboarding
10 5 (0.72%) Security Posture
11 4 (0.58%) Video Editing
12 3 (0.43%) Animation
12 3 (0.43%) CMDB
Operating Systems
1 80 (11.54%) Windows
2 69 (9.96%) Linux
3 13 (1.88%) Windows Server
4 8 (1.15%) Windows 10
5 5 (0.72%) Apple iOS
5 5 (0.72%) Mac OS
5 5 (0.72%) Windows Server 2016
6 4 (0.58%) Mac OS X
6 4 (0.58%) SUSE
6 4 (0.58%) SUSE Linux Enterprise Server
7 3 (0.43%) Unix
8 2 (0.29%) Android
8 2 (0.29%) Rocky
8 2 (0.29%) VMS
9 1 (0.14%) CentOS
9 1 (0.14%) Ubuntu
9 1 (0.14%) Windows 7
9 1 (0.14%) Windows 8
9 1 (0.14%) Windows Server 2008
9 1 (0.14%) Windows Server 2012
Processes & Methodologies
1 272 (39.25%) Problem-Solving
2 191 (27.56%) Computer Science
3 184 (26.55%) Mathematics
4 182 (26.26%) Continuous Improvement
4 182 (26.26%) Physics
5 174 (25.11%) Project Management
6 168 (24.24%) UML
7 155 (22.37%) Systems Engineering
8 147 (21.21%) Creative Problem-Solving
8 147 (21.21%) PLM
9 145 (20.92%) Model-Based Systems Engineering
9 145 (20.92%) SysML
10 76 (10.97%) Software Engineering
11 64 (9.24%) Customer Service
12 58 (8.37%) Mentoring
13 56 (8.08%) Analytics
14 55 (7.94%) Agile
15 52 (7.50%) Customer Experience
16 45 (6.49%) Business Intelligence
17 42 (6.06%) CI/CD
Programming Languages
1 145 (20.92%) MATLAB
2 115 (16.59%) SQL
3 109 (15.73%) Python
4 79 (11.40%) JavaScript
5 66 (9.52%) Java
6 65 (9.38%) C#
7 30 (4.33%) PHP
8 28 (4.04%) TypeScript
9 23 (3.32%) Ada
9 23 (3.32%) Rust
10 18 (2.60%) PowerShell
11 16 (2.31%) C
11 16 (2.31%) VBA
12 14 (2.02%) Go
13 12 (1.73%) Bash
13 12 (1.73%) Bicep
14 11 (1.59%) C++
15 10 (1.44%) Ruby
16 5 (0.72%) Clojure
17 3 (0.43%) Groovy
Qualifications
1 293 (42.28%) Degree
2 168 (24.24%) BPSS Clearance
3 40 (5.77%) Computer Science Degree
4 38 (5.48%) CCNA
4 38 (5.48%) Cisco Certification
5 26 (3.75%) JNCIA
6 19 (2.74%) Security Cleared
7 12 (1.73%) SC Cleared
8 11 (1.59%) CompTIA Security+
9 10 (1.44%) CISSP
9 10 (1.44%) GCIA
9 10 (1.44%) OSCP
10 9 (1.30%) CEH
10 9 (1.30%) GCIH
10 9 (1.30%) SANS
11 7 (1.01%) Microsoft Certification
12 6 (0.87%) DBS Check
13 5 (0.72%) A+ Certification
14 4 (0.58%) Master's Degree
14 4 (0.58%) Network+ Certification
Quality Assurance & Compliance
1 19 (2.74%) Accessibility
2 16 (2.31%) QA
3 9 (1.30%) SLA
4 8 (1.15%) Data Quality
5 5 (0.72%) NIST
6 4 (0.58%) Cyber Essentials
6 4 (0.58%) Cyber Essentials PLUS
6 4 (0.58%) Def Stans
6 4 (0.58%) ISO/IEC 27001
6 4 (0.58%) PMO
7 1 (0.14%) Actionable Recommendations
7 1 (0.14%) GDPR
7 1 (0.14%) ISO 13485
7 1 (0.14%) ISO 9001
7 1 (0.14%) NCSC
7 1 (0.14%) NIST 800
System Software
1 37 (5.34%) Docker
2 32 (4.62%) Active Directory
3 14 (2.02%) VMware Infrastructure
4 7 (1.01%) Hyper-V
5 5 (0.72%) Firmware
6 4 (0.58%) NFS
7 2 (0.29%) Virtual Machines
8 1 (0.14%) Virtual Desktop
8 1 (0.14%) Virtual Servers
Systems Management
1 32 (4.62%) Kubernetes
2 31 (4.47%) Terraform
3 19 (2.74%) Ansible
4 12 (1.73%) Puppet
5 10 (1.44%) Podman
5 10 (1.44%) Progress Chef
6 6 (0.87%) Microsoft Intune
6 6 (0.87%) Proxmox
7 4 (0.58%) Jamf Pro
7 4 (0.58%) Kibana
8 2 (0.29%) Grafana
8 2 (0.29%) logstash
8 2 (0.29%) Salt
9 1 (0.14%) Active Directory Federation Services
9 1 (0.14%) Graylog
9 1 (0.14%) Nagios
9 1 (0.14%) Nessus
9 1 (0.14%) Prometheus
9 1 (0.14%) Rancher
9 1 (0.14%) SCCM
Vendors
1 145 (20.92%) IBM
2 116 (16.74%) Microsoft
3 46 (6.64%) Cisco
4 36 (5.19%) Juniper
5 26 (3.75%) Fortinet
6 24 (3.46%) Aruba
7 23 (3.32%) Palo Alto
8 17 (2.45%) Facebook
9 16 (2.31%) Adobe
10 15 (2.16%) VMware
11 11 (1.59%) YouTube
12 10 (1.44%) SAP
13 9 (1.30%) CrowdStrike
14 6 (0.87%) Cognos
14 6 (0.87%) Google
14 6 (0.87%) Salesforce
14 6 (0.87%) ServiceNow
15 5 (0.72%) Splunk
16 4 (0.58%) Twitter
17 3 (0.43%) HubSpot