Knowledge Transfer
UK

The following table provides summary statistics for permanent job vacancies with a requirement for Knowledge Transfer skills. Included is a benchmarking guide to the salaries offered in vacancies that have cited Knowledge Transfer over the 6 months to 28 November 2023 with a comparison to the same period in the previous 2 years.

6 months to
28 Nov 2023
Same period 2022 Same period 2021
Rank 413 620 533
Rank change year-on-year +207 -87 -51
Permanent jobs citing Knowledge Transfer 351 532 682
As % of all permanent jobs advertised in the UK 0.65% 0.42% 0.53%
As % of the Processes & Methodologies category 0.69% 0.44% 0.56%
Number of salaries quoted 160 294 419
10th Percentile £36,250 £32,931 £32,750
25th Percentile £45,000 £41,906 £41,250
Median annual salary (50th Percentile) £60,000 £52,500 £55,000
Median % change year-on-year +14.29% -4.55% -3.51%
75th Percentile £78,938 £70,000 £70,000
90th Percentile £90,000 £90,000 £85,000
UK excluding London median annual salary £54,250 £49,500 £52,500
% change year-on-year +9.60% -5.71% +5.00%

All Process and Methodology Skills
UK

Knowledge Transfer is in the Processes and Methodologies category. The following table is for comparison with the above and provides summary statistics for all permanent job vacancies with a requirement for process or methodology skills.

Permanent vacancies with a requirement for process or methodology skills 51,121 120,104 122,523
As % of all permanent jobs advertised in the UK 94.09% 95.72% 95.43%
Number of salaries quoted 36,956 73,203 81,032
10th Percentile £32,500 £34,313 £32,500
25th Percentile £43,750 £45,000 £42,500
Median annual salary (50th Percentile) £60,000 £60,000 £59,000
Median % change year-on-year - +1.69% +7.27%
75th Percentile £80,000 £81,250 £77,500
90th Percentile £98,750 £100,000 £95,000
UK excluding London median annual salary £52,500 £53,000 £50,000
% change year-on-year -0.94% +6.00% +4.17%

Knowledge Transfer
Job Vacancy Trend

Job postings citing Knowledge Transfer as a proportion of all IT jobs advertised.
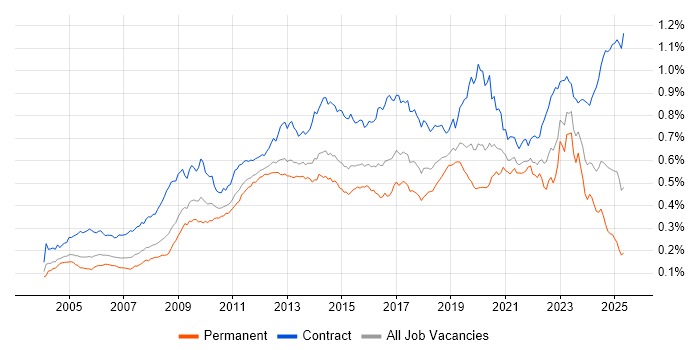
Job vacancy trend for Knowledge Transfer in the UK

Knowledge Transfer
Salary Trend

3-month moving average salary quoted in jobs citing Knowledge Transfer.

Salary trend for Knowledge Transfer in the UK

Knowledge Transfer
Salary Histogram

Salary distribution for jobs citing Knowledge Transfer over the 6 months to 28 November 2023.

Salary histogram for Knowledge Transfer in the UK

Knowledge Transfer
Top 17 Job Locations

The table below looks at the demand and provides a guide to the median salaries quoted in IT jobs citing Knowledge Transfer within the UK over the 6 months to 28 November 2023. The 'Rank Change' column provides an indication of the change in demand within each location based on the same 6 month period last year.

Location Rank Change
on Same Period
Last Year
Matching
Permanent
IT Job Ads
Median Salary
Past 6 Months
Median Salary
% Change
on Same Period
Last Year
Live
Jobs
England +204 276 £62,500 +19.05% 151
UK excluding London +185 216 £54,250 +9.60% 100
Work from Home +246 183 £60,000 +23.71% 65
London +181 98 £67,000 +21.82% 60
South East +176 72 £42,500 -31.55% 17
North of England +151 64 £57,750 +39.16% 27
Yorkshire +130 48 £57,500 +38.55% 9
Wales +32 25 £72,500 +56.76% 6
Scotland +44 20 £61,250 -5.77% 9
Midlands +33 16 £70,000 +42.86% 18
North West +97 14 £73,750 +75.60% 14
South West +67 12 £42,500 +27.68% 15
West Midlands +23 10 £70,000 +44.33% 14
East of England +111 8 £37,500 -60.53% 9
East Midlands +46 6 £50,000 -13.04% 4
Northern Ireland +29 3 - - 1
North East - 2 £56,500 - 4

Knowledge Transfer
Co-occurring Skills and Capabilities by Category

The follow tables expand on the table above by listing co-occurrences grouped by category. The same employment type, locality and period is covered with up to 20 co-occurrences shown in each of the following categories:

Application Platforms
1 26 (7.41%) SharePoint
2 14 (3.99%) WebSphere
2 14 (3.99%) WebSphere Application Server
3 11 (3.13%) Confluence
4 5 (1.42%) MS Exchange
5 1 (0.28%) Apache
5 1 (0.28%) CMS
5 1 (0.28%) IIS
5 1 (0.28%) nginx
5 1 (0.28%) OpenStack
5 1 (0.28%) WildFly
Applications
1 41 (11.68%) Microsoft Excel
2 10 (2.85%) Microsoft PowerPoint
3 9 (2.56%) Microsoft Office
4 3 (0.85%) Oracle Smart View
5 1 (0.28%) Chatbot
Business Applications
1 32 (9.12%) Oracle Payables
2 28 (7.98%) Oracle Receivables
3 7 (1.99%) Dynamics CRM
4 5 (1.42%) Dynamics GP
4 5 (1.42%) Oracle Procure-to-Pay
5 4 (1.14%) SAP ERP
5 4 (1.14%) SAP EWM
5 4 (1.14%) SAP MM
5 4 (1.14%) SAP S/4HANA
6 2 (0.57%) Oracle Cash Management
6 2 (0.57%) Oracle General Ledger
6 2 (0.57%) SAP CO
6 2 (0.57%) SAP FI
6 2 (0.57%) SAP FI/CO
6 2 (0.57%) SAP SCM
6 2 (0.57%) SAP SD
6 2 (0.57%) SAP WM
7 1 (0.28%) Dynamics AX
7 1 (0.28%) Dynamics NAV
7 1 (0.28%) SAP GTS
Cloud Services
1 76 (21.65%) Azure
2 58 (16.52%) Microsoft 365
3 32 (9.12%) AWS
4 20 (5.70%) Cloud Computing
5 18 (5.13%) GCP
6 17 (4.84%) Power Platform
7 16 (4.56%) GitHub
8 14 (3.99%) Mimecast
9 12 (3.42%) Dynamics 365
10 11 (3.13%) Azure DevOps
11 8 (2.28%) SaaS
12 6 (1.71%) Azure Sentinel
12 6 (1.71%) Boomi
12 6 (1.71%) Entra ID
13 5 (1.42%) Power Automate
13 5 (1.42%) PowerApps
14 4 (1.14%) IaaS
14 4 (1.14%) PaaS
15 3 (0.85%) Azure Logic Apps
15 3 (0.85%) Oracle Service Cloud
Communications & Networking
1 31 (8.83%) VPN
2 30 (8.55%) 5G
2 30 (8.55%) Broadband
2 30 (8.55%) Firewall
3 29 (8.26%) Network Security
4 27 (7.69%) Wi-Fi
5 25 (7.12%) IPsec
6 21 (5.98%) DNS
7 19 (5.41%) DHCP
8 14 (3.99%) VLAN
9 10 (2.85%) WAN
10 9 (2.56%) LAN
11 8 (2.28%) TCP/IP
12 5 (1.42%) Cisco ASA
12 5 (1.42%) Skype
13 4 (1.14%) VoIP
13 4 (1.14%) Wireless
14 3 (0.85%) Cisco ISE
14 3 (0.85%) Cisco Nexus
14 3 (0.85%) NX-OS
Database & Business Intelligence
1 34 (9.69%) SQL Server
2 15 (4.27%) BusinessObjects
3 14 (3.99%) BusinessObjects Business Intelligence
4 11 (3.13%) Power BI
5 7 (1.99%) SQL Server Reporting Services
6 6 (1.71%) Crystal Reports
7 5 (1.42%) Azure SQL Database
7 5 (1.42%) NoSQL
7 5 (1.42%) PostgreSQL
7 5 (1.42%) SQL Server Integration Services
8 4 (1.14%) Oracle BI Publisher
8 4 (1.14%) Oracle Reports
9 3 (0.85%) Essbase
9 3 (0.85%) Oracle BI EE
9 3 (0.85%) Relational Database
10 2 (0.57%) Data Warehouse
10 2 (0.57%) Elasticsearch
10 2 (0.57%) MongoDB
10 2 (0.57%) MySQL
11 1 (0.28%) Data Mining
Development Applications
1 37 (10.54%) Git
2 26 (7.41%) JIRA
3 17 (4.84%) Jenkins
4 14 (3.99%) Oracle APEX
5 13 (3.70%) Selenium
6 12 (3.42%) Maven
7 3 (0.85%) Oracle Forms
8 1 (0.28%) Bitbucket
8 1 (0.28%) GCC
8 1 (0.28%) GitLab
8 1 (0.28%) JMeter
8 1 (0.28%) Octopus Deploy
8 1 (0.28%) SilkPerformer
8 1 (0.28%) Snakemake
General
1 168 (47.86%) Social Skills
2 94 (26.78%) Finance
3 43 (12.25%) Inclusion and Diversity
4 39 (11.11%) Legal
5 35 (9.97%) Analytical Skills
6 30 (8.55%) Law
7 26 (7.41%) Presentation Skills
7 26 (7.41%) Public Sector
8 23 (6.55%) Documentation Skills
9 13 (3.70%) Marketing
10 12 (3.42%) Manufacturing
10 12 (3.42%) Telecoms
11 11 (3.13%) Retail
12 8 (2.28%) Influencing Skills
13 5 (1.42%) Back Office
13 5 (1.42%) General Ledger
14 3 (0.85%) Electronics
14 3 (0.85%) Financial Institution
14 3 (0.85%) Military
14 3 (0.85%) Organisational Skills
Job Titles
1 112 (31.91%) Analyst
2 79 (22.51%) Consultant
3 52 (14.81%) Project Consultant
4 44 (12.54%) Senior
5 30 (8.55%) Lead
6 26 (7.41%) Operations Analyst
7 24 (6.84%) Senior Consultant
8 23 (6.55%) Project Manager
9 21 (5.98%) Applications Support
10 20 (5.70%) Applications Support Analyst
10 20 (5.70%) Business Analyst
10 20 (5.70%) Support Analyst
11 19 (5.41%) Cloud Consultant
12 18 (5.13%) Implementation Analyst
12 18 (5.13%) Insurance Business Analyst
12 18 (5.13%) Software Analyst
12 18 (5.13%) Software Implementation Analyst
13 17 (4.84%) Senior Network Consultant
13 17 (4.84%) Senior Project Consultant
13 17 (4.84%) Support Engineer
Libraries, Frameworks & Software Standards
1 29 (8.26%) .NET
2 14 (3.99%) YAML
3 13 (3.70%) ASP.NET
3 13 (3.70%) JSON
3 13 (3.70%) Node.js
4 10 (2.85%) HTML
5 9 (2.56%) EDI
6 8 (2.28%) CSS
7 7 (1.99%) Oracle Fusion
7 7 (1.99%) React
8 6 (1.71%) AngularJS
9 5 (1.42%) CSS3
9 5 (1.42%) Middleware
10 4 (1.14%) HTML5
10 4 (1.14%) REST
11 3 (0.85%) Kafka
11 3 (0.85%) RESTful
11 3 (0.85%) SOAP
11 3 (0.85%) Velocity
11 3 (0.85%) XML
Miscellaneous
1 72 (20.51%) Self-Motivation
2 58 (16.52%) Data Centre
3 24 (6.84%) Management Information System
4 19 (5.41%) Reinsurance
5 13 (3.70%) Onboarding
6 8 (2.28%) Product Ownership
7 5 (1.42%) Greenfield Project
8 3 (0.85%) Data Structures
8 3 (0.85%) Enterprise Cloud
8 3 (0.85%) PKI
8 3 (0.85%) Public Cloud
8 3 (0.85%) Replication
9 2 (0.57%) Augmented Reality
9 2 (0.57%) Mobile Computing
9 2 (0.57%) Private Cloud
9 2 (0.57%) Security Posture
9 2 (0.57%) Social Media
10 1 (0.28%) Distributed Computing
10 1 (0.28%) Distributed Systems
10 1 (0.28%) Legacy Systems
Operating Systems
1 72 (20.51%) Windows
2 65 (18.52%) Windows Server
3 26 (7.41%) Windows 10
4 23 (6.55%) Linux
5 20 (5.70%) Unix
6 16 (4.56%) Windows Server 2003
6 16 (4.56%) Windows Server 2016
7 15 (4.27%) Windows Server 2008
8 13 (3.70%) Windows Server 2012
9 9 (2.56%) Windows Server 2019
10 2 (0.57%) Solaris
11 1 (0.28%) Debian
11 1 (0.28%) Mac OS
11 1 (0.28%) VxWorks
Processes & Methodologies
1 116 (33.05%) ITIL
2 87 (24.79%) Agile
3 84 (23.93%) Project Delivery
4 80 (22.79%) Actionable Insight
5 78 (22.22%) Mentoring
6 73 (20.80%) Problem-Solving
7 57 (16.24%) DevOps
8 52 (14.81%) Coaching
9 47 (13.39%) Project Management
10 35 (9.97%) Accounts Payable
11 33 (9.40%) Business Intelligence
11 33 (9.40%) Server Management
12 31 (8.83%) Change Control
12 31 (8.83%) ITSM
12 31 (8.83%) Service Management
13 30 (8.55%) Accounts Receivable
13 30 (8.55%) Analytics
14 26 (7.41%) Artificial Intelligence
14 26 (7.41%) Change Management
14 26 (7.41%) ERP
Programming Languages
1 57 (16.24%) SQL
2 38 (10.83%) PowerShell
3 35 (9.97%) Java
4 26 (7.41%) JavaScript
5 22 (6.27%) Python
6 20 (5.70%) PL/SQL
7 16 (4.56%) Bash
8 14 (3.99%) C#
9 13 (3.70%) Ruby
10 12 (3.42%) PHP
11 7 (1.99%) Delphi
11 7 (1.99%) TypeScript
12 6 (1.71%) C++
13 5 (1.42%) Shell Script
14 4 (1.14%) Kusto Query Language
15 3 (0.85%) C
16 2 (0.57%) Rust
17 1 (0.28%) LookML
17 1 (0.28%) Perl
17 1 (0.28%) T-SQL
Qualifications
1 111 (31.62%) Security Cleared
2 72 (20.51%) SC Cleared
3 61 (17.38%) Degree
4 41 (11.68%) DV Cleared
5 31 (8.83%) Cisco Certification
6 30 (8.55%) CCNP
7 29 (8.26%) CCNA
8 19 (5.41%) ITIL Certification
9 12 (3.42%) BPSS Clearance
10 9 (2.56%) DBS Check
11 6 (1.71%) VMware Certified Professional (VCP)
12 5 (1.42%) PhD
13 3 (0.85%) Computer Science Degree
13 3 (0.85%) JNCIA
13 3 (0.85%) Master's Degree
14 2 (0.57%) CCSE
15 1 (0.28%) CCSP
15 1 (0.28%) CISSP
15 1 (0.28%) MBA
15 1 (0.28%) Microsoft Certification
Quality Assurance & Compliance
1 34 (9.69%) ISO/IEC 27001
2 29 (8.26%) QA
3 7 (1.99%) COBIT
3 7 (1.99%) ISO/IEC 20000
4 5 (1.42%) PCI DSS
5 4 (1.14%) SLA
6 3 (0.85%) Data Quality
6 3 (0.85%) ISO 9001
7 2 (0.57%) Cyber Essentials
7 2 (0.57%) GDPR
8 1 (0.28%) Accessibility
8 1 (0.28%) HIPAA
8 1 (0.28%) NIST
8 1 (0.28%) PMO
System Software
1 34 (9.69%) Firmware
2 31 (8.83%) VMware Infrastructure
3 27 (7.69%) Active Directory
4 25 (7.12%) Virtual Machines
5 24 (6.84%) Docker
6 19 (5.41%) Hyper-V
7 12 (3.42%) LXC
8 3 (0.85%) VMware ESXi
8 3 (0.85%) VMware NSX
9 2 (0.57%) Virtual Desktop
9 2 (0.57%) vSphere
10 1 (0.28%) Ceph
10 1 (0.28%) GPFS
10 1 (0.28%) KVM
10 1 (0.28%) Lustre
10 1 (0.28%) Slurm Workload Manager
Systems Management
1 27 (7.69%) FortiGate
2 22 (6.27%) Kubernetes
3 17 (4.84%) Ansible
4 14 (3.99%) Progress Chef
5 12 (3.42%) Docker Swarm
5 12 (3.42%) Nagios
5 12 (3.42%) systemd
6 11 (3.13%) SCCM
7 10 (2.85%) Terraform
8 7 (1.99%) Microsoft Intune
9 4 (1.14%) SCOM
9 4 (1.14%) SCSM
10 3 (0.85%) Active Directory Federation Services
10 3 (0.85%) Puppet
11 2 (0.57%) Salt
11 2 (0.57%) Single Sign-On
12 1 (0.28%) Failover Clustering
12 1 (0.28%) Icinga
12 1 (0.28%) Prometheus
12 1 (0.28%) vCenter Server
Vendors
1 120 (34.19%) Microsoft
2 84 (23.93%) Oracle
3 39 (11.11%) Cisco
3 39 (11.11%) VMware
4 32 (9.12%) Palo Alto
5 30 (8.55%) Virgin Media
6 29 (8.26%) Juniper
6 29 (8.26%) Remedy
7 28 (7.98%) CheckPoint
8 26 (7.41%) ServiceNow
9 24 (6.84%) Forcepoint
9 24 (6.84%) McAfee
10 14 (3.99%) Google
10 14 (3.99%) SonicWALL
10 14 (3.99%) Sophos
11 13 (3.70%) Aruba
11 13 (3.70%) N-able
11 13 (3.70%) SAP
12 12 (3.42%) Splunk
13 11 (3.13%) Sun