Performance Tuning Jobs

Performance Tuning
UK

The table below provides summary statistics for permanent job vacancies requiring Performance Tuning skills. It includes a benchmarking guide to the annual salaries offered in vacancies that cited Performance Tuning over the 6 months leading up to 28 May 2025, comparing them to the same period in the previous two years.

6 months to
28 May 2025
Same period 2024 Same period 2023
Rank 437 317 389
Rank change year-on-year -120 +72 +1
Permanent jobs citing Performance Tuning 296 934 830
As % of all permanent jobs advertised in the UK 0.54% 0.91% 0.85%
As % of the Processes & Methodologies category 0.58% 1.08% 0.89%
Number of salaries quoted 210 436 435
10th Percentile £42,375 £41,250 £37,875
25th Percentile £51,250 £51,250 £47,342
Median annual salary (50th Percentile) £62,500 £57,500 £60,000
Median % change year-on-year +8.70% -4.17% -4.00%
75th Percentile £78,750 £77,500 £78,750
90th Percentile £95,250 £96,875 £108,750
UK excluding London median annual salary £60,000 £57,500 £52,000
% change year-on-year +4.35% +10.58% -5.45%

All Process and Methodology Skills
UK

Performance Tuning falls under the Processes and Methodologies category. For comparison with the information above, the following table provides summary statistics for all permanent job vacancies requiring process or methodology skills.

Permanent vacancies with a requirement for process or methodology skills 51,242 86,144 93,565
As % of all permanent jobs advertised in the UK 93.71% 84.33% 95.55%
Number of salaries quoted 25,211 60,433 55,406
10th Percentile £29,000 £29,250 £34,000
25th Percentile £41,250 £40,000 £45,000
Median annual salary (50th Percentile) £57,500 £55,000 £61,000
Median % change year-on-year +4.55% -9.84% +1.67%
75th Percentile £75,000 £72,500 £81,250
90th Percentile £97,500 £92,500 £100,000
UK excluding London median annual salary £51,645 £50,000 £55,000
% change year-on-year +3.29% -9.09% +4.76%

Performance Tuning
Job Vacancy Trend

Job postings citing Performance Tuning as a proportion of all IT jobs advertised.
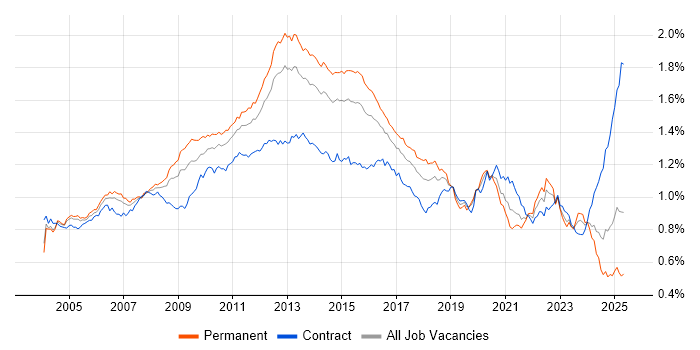
Job vacancy trend for Performance Tuning in the UK

Performance Tuning
Salary Trend

3-month moving average salary quoted in jobs citing Performance Tuning.

Salary trend for Performance Tuning in the UK

Performance Tuning
Salary Histogram

Salary distribution for jobs citing Performance Tuning over the 6 months to 28 May 2025.

Salary histogram for Performance Tuning in the UK

Performance Tuning
Top 18 Job Locations

The table below looks at the demand and provides a guide to the median salaries quoted in IT jobs citing Performance Tuning within the UK over the 6 months to 28 May 2025. The 'Rank Change' column provides an indication of the change in demand within each location based on the same 6 month period last year.

Location Rank Change
on Same Period
Last Year
Matching
Permanent
IT Job Ads
Median Salary
Past 6 Months
Median Salary
% Change
on Same Period
Last Year
Live
Jobs
England -58 249 £63,750 +8.05% 1,767
UK excluding London -144 152 £60,000 +4.35% 1,688
Work from Home -41 151 £60,000 +4.35% 868
London +53 116 £75,000 -4.46% 305
Midlands +21 37 £52,500 -8.70% 304
North of England -53 36 £62,500 +8.70% 369
West Midlands +52 35 £52,500 -12.50% 163
South East +24 33 £65,000 +13.04% 501
Scotland -52 21 £50,000 -13.04% 70
North West -53 19 £62,500 +13.64% 172
South West +92 15 £57,000 -0.87% 186
Yorkshire +45 14 £60,000 +23.69% 153
East of England +35 6 £57,500 - 242
North East +22 3 £60,000 +4.35% 45
Northern Ireland +34 2 £69,000 -10.97% 27
East Midlands +12 2 £48,750 -15.22% 122
Wales -8 1 £60,000 +28.75% 48
Isle of Man - 1 £34,500 -

Performance Tuning
Co-occurring Skills and Capabilities by Category

The follow tables expand on the table above by listing co-occurrences grouped by category. The same employment type, locality and period is covered with up to 20 co-occurrences shown in each of the following categories:

Application Platforms
1 23 (7.77%) Microsoft Exchange
2 19 (6.42%) Apache Spark
3 9 (3.04%) IIS
4 8 (2.70%) Apache
5 5 (1.69%) Confluence
6 4 (1.35%) CMS
6 4 (1.35%) nginx
7 3 (1.01%) Apache Airflow
7 3 (1.01%) GemFire
8 2 (0.68%) SharePoint
9 1 (0.34%) Appian
9 1 (0.34%) BizTalk Server
9 1 (0.34%) CICS
9 1 (0.34%) Cloud Foundry
9 1 (0.34%) Tomcat
Applications
1 23 (7.77%) Microsoft Excel
2 12 (4.05%) Microsoft Office
3 3 (1.01%) Spreadsheet
4 2 (0.68%) Mozilla Thunderbird
4 2 (0.68%) MS Visio
5 1 (0.34%) Chatbot
Business Applications
1 7 (2.36%) Oracle EBS
1 7 (2.36%) SAP S/4HANA
2 5 (1.69%) Oracle Applications
3 4 (1.35%) Fidessa
4 3 (1.01%) Dynamics CRM
5 2 (0.68%) Endur
Cloud Services
1 138 (46.62%) Azure
2 94 (31.76%) AWS
3 66 (22.30%) Power Platform
4 40 (13.51%) SaaS
5 29 (9.80%) GCP
6 26 (8.78%) Azure Data Factory
6 26 (8.78%) Serverless
7 21 (7.09%) AWS Lambda
8 18 (6.08%) GitHub
9 17 (5.74%) Amazon S3
9 17 (5.74%) AWS CloudFormation
9 17 (5.74%) Azure DevOps
10 15 (5.07%) Snowflake
11 14 (4.73%) AWS KMS
12 13 (4.39%) Google Workspace
13 10 (3.38%) Azure Monitor
13 10 (3.38%) Datadog
13 10 (3.38%) Power Automate
14 9 (3.04%) Azure Synapse Analytics
14 9 (3.04%) PowerApps
Communications & Networking
1 24 (8.11%) Firewall
2 23 (7.77%) DNS
3 21 (7.09%) Network Security
4 17 (5.74%) DHCP
4 17 (5.74%) TCP/IP
5 13 (4.39%) BGP
5 13 (4.39%) OSPF
5 13 (4.39%) VLAN
6 12 (4.05%) WLAN
7 8 (2.70%) SAN
8 7 (2.36%) VPN
9 6 (2.03%) NAS
10 4 (1.35%) NetScaler
11 3 (1.01%) HTTP
12 2 (0.68%) FTP
12 2 (0.68%) IMAP
12 2 (0.68%) SMTP
12 2 (0.68%) SNMP
12 2 (0.68%) WAN
12 2 (0.68%) Wireshark
Database & Business Intelligence
1 97 (32.77%) SQL Server
2 65 (21.96%) Power BI
3 34 (11.49%) Data Warehouse
4 33 (11.15%) SQL Server Reporting Services
5 26 (8.78%) SQL Server Integration Services
6 25 (8.45%) PostgreSQL
7 21 (7.09%) Data Hub
7 21 (7.09%) SQL CLR
8 18 (6.08%) Azure SQL Database
8 18 (6.08%) Big Data
8 18 (6.08%) SQL Server Analysis Services
9 16 (5.41%) Metadata
10 15 (5.07%) Data Lake
11 14 (4.73%) NoSQL
12 12 (4.05%) MongoDB
13 11 (3.72%) Oracle Database
14 9 (3.04%) MySQL
14 9 (3.04%) Relational Database
15 7 (2.36%) Amazon Redshift
15 7 (2.36%) Oracle Exadata
Development Applications
1 27 (9.12%) Git
2 14 (4.73%) JIRA
3 10 (3.38%) Visual Studio
4 9 (3.04%) Jenkins
5 3 (1.01%) Maven
6 2 (0.68%) Fiddler
6 2 (0.68%) GitLab
6 2 (0.68%) IDA Disassembler
6 2 (0.68%) Subversion
6 2 (0.68%) Vagrant
7 1 (0.34%) Artifactory
7 1 (0.34%) Bitbucket
7 1 (0.34%) Cypress.io
7 1 (0.34%) Gradle
7 1 (0.34%) NUnit
7 1 (0.34%) Octopus Deploy
7 1 (0.34%) Oracle APEX
7 1 (0.34%) Selenium
7 1 (0.34%) SQL Server Management Studio (SSMS)
7 1 (0.34%) TeamCity
General
1 95 (32.09%) Social Skills
2 93 (31.42%) Finance
3 41 (13.85%) Analytical Skills
4 39 (13.18%) Law
5 28 (9.46%) Banking
6 26 (8.78%) Retail
7 21 (7.09%) Back Office
8 17 (5.74%) Inclusion and Diversity
9 12 (4.05%) Automotive
10 10 (3.38%) Front Office
10 10 (3.38%) Legal
11 9 (3.04%) Advertising
11 9 (3.04%) Public Sector
12 8 (2.70%) Retail Banking
13 6 (2.03%) Documentation Skills
14 5 (1.69%) Investment Banking
15 4 (1.35%) Marketing
16 3 (1.01%) Financial Institution
16 3 (1.01%) Music Industry
17 2 (0.68%) Organisational Skills
Job Titles
1 72 (24.32%) Developer
2 64 (21.62%) Senior
3 40 (13.51%) Lead
4 36 (12.16%) Architect
5 31 (10.47%) DBA
6 25 (8.45%) SQL Developer
7 24 (8.11%) Senior Developer
7 24 (8.11%) Software Engineer
8 20 (6.76%) SQL DBA
9 18 (6.08%) Cloud Architect
10 16 (5.41%) IT Engineer
11 14 (4.73%) AWS Architect
11 14 (4.73%) Senior SQL Developer
12 13 (4.39%) Data Engineer
12 13 (4.39%) Microsoft Developer
12 13 (4.39%) Senior Microsoft Developer
12 13 (4.39%) Systems Engineer
13 12 (4.05%) Analyst
13 12 (4.05%) SaaS Developer
13 12 (4.05%) SQL Server DBA
Libraries, Frameworks & Software Standards
1 42 (14.19%) .NET
2 34 (11.49%) Kafka
3 23 (7.77%) .NET Framework
4 22 (7.43%) .NET Core
5 19 (6.42%) REST
6 18 (6.08%) AngularJS
7 16 (5.41%) Elastic Stack
7 16 (5.41%) Entity Framework
7 16 (5.41%) Middleware
7 16 (5.41%) RESTful
8 11 (3.72%) Pandas
8 11 (3.72%) SOAP
9 10 (3.38%) ASP.NET
9 10 (3.38%) Dapper ORM
9 10 (3.38%) GraphQL
9 10 (3.38%) React
10 9 (3.04%) HTML
10 9 (3.04%) Spring
11 7 (2.36%) Oracle Fusion
11 7 (2.36%) Oracle GoldenGate
Miscellaneous
1 33 (11.15%) Management Information System
2 29 (9.80%) Cloud Native
3 22 (7.43%) Algorithms
3 22 (7.43%) Data Structures
3 22 (7.43%) Private Cloud
4 17 (5.74%) Fixed Income
5 15 (5.07%) Distributed Systems
6 13 (4.39%) Replication
7 12 (4.05%) Smartphone
8 11 (3.72%) Foreign Exchange (FX)
9 9 (3.04%) Team-Oriented Environment
10 8 (2.70%) Public Cloud
11 7 (2.36%) Greenfield Project
12 6 (2.03%) Hedge funds
13 5 (1.69%) Clustering
13 5 (1.69%) Data Centre
13 5 (1.69%) Enterprise Software
13 5 (1.69%) Hybrid Cloud
14 4 (1.35%) Enterprise Storage
14 4 (1.35%) Mainframe
Operating Systems
1 62 (20.95%) Linux
2 44 (14.86%) Windows
3 33 (11.15%) Windows Server
4 17 (5.74%) Windows Server 2016
5 16 (5.41%) Ubuntu
6 14 (4.73%) Windows Server 2019
7 12 (4.05%) Mac OS X
7 12 (4.05%) Windows 10
8 11 (3.72%) Unix
9 8 (2.70%) Red Hat Enterprise Linux
10 3 (1.01%) Solaris
11 2 (0.68%) AIX
11 2 (0.68%) Amazon Linux
11 2 (0.68%) VMS
12 1 (0.34%) Android
12 1 (0.34%) Apple iOS
12 1 (0.34%) Debian
12 1 (0.34%) Windows Server 2012
12 1 (0.34%) zOS
Processes & Methodologies
1 92 (31.08%) Problem-Solving
2 70 (23.65%) Agile
2 70 (23.65%) High Availability
3 69 (23.31%) Business Intelligence
4 68 (22.97%) CI/CD
5 64 (21.62%) Computer Science
5 64 (21.62%) Mentoring
6 61 (20.61%) DevOps
7 58 (19.59%) Software Engineering
8 57 (19.26%) Migration
9 46 (15.54%) Data Modelling
10 45 (15.20%) ETL
11 38 (12.84%) Infrastructure Engineering
12 36 (12.16%) Containerisation
13 34 (11.49%) Design Patterns
13 34 (11.49%) Microservices
14 33 (11.15%) Visualisation
15 30 (10.14%) Cloud Security
15 30 (10.14%) Technical Leadership
16 29 (9.80%) Data Pipeline
Programming Languages
1 177 (59.80%) SQL
2 64 (21.62%) Python
3 47 (15.88%) C#
4 46 (15.54%) Java
5 45 (15.20%) PowerShell
6 36 (12.16%) T-SQL
7 22 (7.43%) Bash
8 18 (6.08%) PL/SQL
9 16 (5.41%) Data Analysis Expressions
10 12 (4.05%) JavaScript
11 6 (2.03%) C++
12 5 (1.69%) Shell Script
13 4 (1.35%) TypeScript
14 3 (1.01%) Go
14 3 (1.01%) Perl
15 2 (0.68%) C
15 2 (0.68%) Groovy
15 2 (0.68%) Scala
16 1 (0.34%) PL/1
16 1 (0.34%) SAPscript
Qualifications
1 73 (24.66%) Degree
2 54 (18.24%) Computer Science Degree
3 25 (8.45%) AWS Certification
4 24 (8.11%) Security Cleared
5 22 (7.43%) AWS Certified Solutions Architect
6 19 (6.42%) SC Cleared
7 17 (5.74%) Microsoft Certification
8 16 (5.41%) Master's Degree
9 12 (4.05%) Azure Certification
9 12 (4.05%) HNC
9 12 (4.05%) HND
9 12 (4.05%) MCSE
10 6 (2.03%) Numerate Degree
10 6 (2.03%) OCP
10 6 (2.03%) Oracle Certification
11 5 (1.69%) OCA
11 5 (1.69%) SAP Certification
12 4 (1.35%) TOGAF Certification
13 3 (1.01%) DBS Check
13 3 (1.01%) VMware Certified Professional (VCP)
Quality Assurance & Compliance
1 24 (8.11%) GDPR
2 16 (5.41%) HIPAA
3 15 (5.07%) ISO 9001
4 14 (4.73%) Data Quality
4 14 (4.73%) QA
5 12 (4.05%) Accessibility
6 8 (2.70%) ISO/IEC 27001
7 4 (1.35%) SOC 2
8 1 (0.34%) Cyber Essentials
8 1 (0.34%) NCSC
8 1 (0.34%) NIST
8 1 (0.34%) PCI DSS
8 1 (0.34%) SLA
System Software
1 35 (11.82%) Docker
1 35 (11.82%) VMware Infrastructure
2 23 (7.77%) Active Directory
3 9 (3.04%) Hyper-V
4 8 (2.70%) VMware ESXi
5 7 (2.36%) Virtual Machines
6 4 (1.35%) HDFS
6 4 (1.35%) vSphere
7 2 (0.68%) DFS Replication
7 2 (0.68%) Dovecot
7 2 (0.68%) Oracle RAC
7 2 (0.68%) Postfix
7 2 (0.68%) Squid
8 1 (0.34%) ACF2
8 1 (0.34%) Firmware
8 1 (0.34%) Job Entry Subsystem
8 1 (0.34%) RACF
8 1 (0.34%) Virtual Servers
Systems Management
1 39 (13.18%) Grafana
2 38 (12.84%) Prometheus
3 37 (12.50%) Kubernetes
4 31 (10.47%) Terraform
5 14 (4.73%) Ansible
6 12 (4.05%) Failover Clustering
7 8 (2.70%) Oracle RMAN
7 8 (2.70%) vCenter Server
8 6 (2.03%) Microsoft Intune
9 5 (1.69%) Single Sign-On
10 4 (1.35%) Puppet
10 4 (1.35%) SCCM
10 4 (1.35%) SCOM
11 3 (1.01%) Nessus
11 3 (1.01%) Progress Chef
12 2 (0.68%) HAProxy
12 2 (0.68%) Istio
12 2 (0.68%) linkerd
12 2 (0.68%) Proxmox
13 1 (0.34%) NetApp OnCommand
Vendors
1 96 (32.43%) Microsoft
2 40 (13.51%) VMware
3 30 (10.14%) Oracle
4 27 (9.12%) Google
5 20 (6.76%) Cisco
5 20 (6.76%) Databricks
6 17 (5.74%) Fortinet
7 14 (4.73%) Dell
8 13 (4.39%) SAP
9 12 (4.05%) Apple
9 12 (4.05%) Ubiquiti
10 11 (3.72%) Solace
11 8 (2.70%) NetApp
11 8 (2.70%) Splunk
12 7 (2.36%) OpenAI
12 7 (2.36%) Red Hat
13 6 (2.03%) Telerik
14 5 (1.69%) Bloomberg
14 5 (1.69%) ServiceNow
14 5 (1.69%) Veeam