Open Source Jobs

Open Source
UK

The table below provides summary statistics for permanent job vacancies requiring Open Source skills. It includes a benchmarking guide to the annual salaries offered in vacancies that cited Open Source over the 6 months leading up to 20 May 2025, comparing them to the same period in the previous two years.

6 months to
20 May 2025
Same period 2024 Same period 2023
Rank 351 254 193
Rank change year-on-year -97 -61 -71
Permanent jobs citing Open Source 435 1,157 1,932
As % of all permanent jobs advertised in the UK 0.77% 1.16% 1.94%
As % of the Processes & Methodologies category 0.82% 1.36% 2.03%
Number of salaries quoted 336 714 887
10th Percentile £47,500 £41,250 £46,250
25th Percentile £59,688 £47,500 £57,500
Median annual salary (50th Percentile) £73,000 £65,000 £75,000
Median % change year-on-year +12.31% -13.33% +7.14%
75th Percentile £115,000 £84,964 £90,000
90th Percentile £137,500 £103,875 £105,000
UK excluding London median annual salary £67,500 £61,206 £67,500
% change year-on-year +10.28% -9.32% +18.89%

All Process and Methodology Skills
UK

Open Source falls under the Processes and Methodologies category. For comparison with the information above, the following table provides summary statistics for all permanent job vacancies requiring process or methodology skills.

Permanent vacancies with a requirement for process or methodology skills 52,745 85,153 95,115
As % of all permanent jobs advertised in the UK 93.88% 85.20% 95.58%
Number of salaries quoted 26,622 59,851 56,203
10th Percentile £29,750 £29,079 £34,000
25th Percentile £41,250 £40,000 £45,000
Median annual salary (50th Percentile) £57,500 £55,000 £61,180
Median % change year-on-year +4.55% -10.10% +1.97%
75th Percentile £75,000 £72,500 £81,250
90th Percentile £97,500 £92,500 £100,000
UK excluding London median annual salary £51,645 £50,000 £55,000
% change year-on-year +3.29% -9.09% +4.76%

Open Source
Job Vacancy Trend

Job postings citing Open Source as a proportion of all IT jobs advertised.
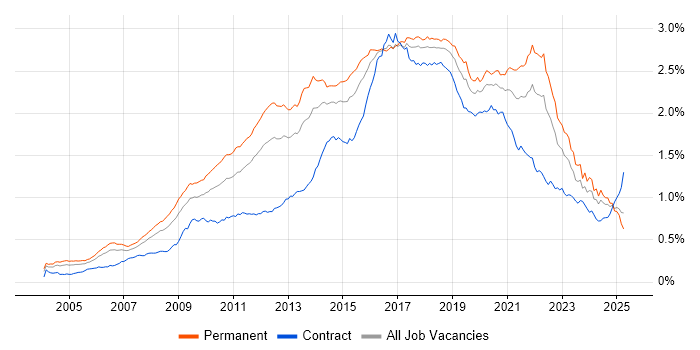
Job vacancy trend for Open Source in the UK

Open Source
Salary Trend

3-month moving average salary quoted in jobs citing Open Source.

Salary trend for Open Source in the UK

Open Source
Salary Histogram

Salary distribution for jobs citing Open Source over the 6 months to 20 May 2025.

Salary histogram for Open Source in the UK

Open Source
Top 15 Job Locations

The table below looks at the demand and provides a guide to the median salaries quoted in IT jobs citing Open Source within the UK over the 6 months to 20 May 2025. The 'Rank Change' column provides an indication of the change in demand within each location based on the same 6 month period last year.

Location Rank Change
on Same Period
Last Year
Matching
Permanent
IT Job Ads
Median Salary
Past 6 Months
Median Salary
% Change
on Same Period
Last Year
Live
Jobs
England -90 385 £73,000 +15.47% 995
UK excluding London -134 226 £67,500 +10.28% 579
Work from Home -82 215 £84,415 +20.59% 628
London +49 173 £110,000 +37.50% 558
South East +56 113 £73,000 +62.22% 174
North of England -115 47 £63,103 +3.10% 130
North West -135 26 £67,563 +11.48% 82
Yorkshire +22 15 £49,500 -19.13% 40
South West +10 15 £61,250 -2.00% 64
Wales +31 14 £70,279 -6.30% 8
Scotland -4 14 £45,000 -40.00% 43
West Midlands +22 12 £64,416 +5.24% 36
Midlands -7 12 £64,416 +5.24% 56
East of England -3 11 £90,000 +12.50% 92
North East +27 6 £68,210 +11.44% 9

Open Source
Co-occurring Skills and Capabilities by Category

The follow tables expand on the table above by listing co-occurrences grouped by category. The same employment type, locality and period is covered with up to 20 co-occurrences shown in each of the following categories:

Application Platforms
1 68 (15.63%) Apache Airflow
2 67 (15.40%) Apache Spark
3 65 (14.94%) Apache
4 8 (1.84%) Drupal
5 7 (1.61%) Confluence
6 5 (1.15%) Jupyter
7 3 (0.69%) Microsoft Exchange
7 3 (0.69%) Oracle SOA Suite
8 2 (0.46%) ArcGIS
8 2 (0.46%) CMS
8 2 (0.46%) NServiceBus
9 1 (0.23%) Ethereum
9 1 (0.23%) Headless CMS
9 1 (0.23%) IIS
9 1 (0.23%) nginx
9 1 (0.23%) OpenStack
9 1 (0.23%) Tomcat
9 1 (0.23%) WordPress
Applications
1 2 (0.46%) AutoCAD
1 2 (0.46%) Blender
1 2 (0.46%) Maya
1 2 (0.46%) ProjectWise
1 2 (0.46%) Revit
Business Applications
1 5 (1.15%) CiviCRM
2 3 (0.69%) Oracle EBS
3 1 (0.23%) Magento
3 1 (0.23%) Payment Gateway
Cloud Services
1 183 (42.07%) AWS
2 91 (20.92%) Serverless
3 84 (19.31%) Azure
4 83 (19.08%) AWS Lambda
5 82 (18.85%) Amazon ECS
6 80 (18.39%) dbt
7 74 (17.01%) OpenShift
8 34 (7.82%) GCP
9 31 (7.13%) Amazon EC2
10 23 (5.29%) Amazon S3
11 20 (4.60%) AWS CloudFormation
11 20 (4.60%) GitHub
12 16 (3.68%) Amazon SQS
13 13 (2.99%) Cloud Computing
14 12 (2.76%) Amazon ElastiCache
15 11 (2.53%) Amazon OpenSearch
15 11 (2.53%) AWS CodeBuild
15 11 (2.53%) Microsoft 365
15 11 (2.53%) Pulumi
15 11 (2.53%) SaaS
Communications & Networking
1 17 (3.91%) TCP/IP
2 12 (2.76%) Internet
3 7 (1.61%) DNS
4 6 (1.38%) HTTP
4 6 (1.38%) Network Security
5 5 (1.15%) SD-WAN
5 5 (1.15%) WAN
6 4 (0.92%) 5G
6 4 (0.92%) Bluetooth
6 4 (0.92%) Firewall
6 4 (0.92%) SMTP
6 4 (0.92%) SSL
6 4 (0.92%) Wi-Fi
6 4 (0.92%) Wireless
7 2 (0.46%) SSH
7 2 (0.46%) tcpdump
7 2 (0.46%) VPN
7 2 (0.46%) Wireshark
8 1 (0.23%) Intrusion Detection
8 1 (0.23%) OpenVPN
Database & Business Intelligence
1 69 (15.86%) Amazon Athena
2 63 (14.48%) Apache Arrow
2 63 (14.48%) Apache Iceberg
2 63 (14.48%) Apache Ignite
2 63 (14.48%) Dremio
3 45 (10.34%) PostgreSQL
4 35 (8.05%) Amazon RDS
5 18 (4.14%) Relational Database
6 15 (3.45%) DynamoDB
6 15 (3.45%) Elasticsearch
6 15 (3.45%) NoSQL
6 15 (3.45%) Redis
7 14 (3.22%) MySQL
8 11 (2.53%) Amazon Redshift
8 11 (2.53%) RDBMS
9 9 (2.07%) SQL Server
10 8 (1.84%) Amazon Aurora
10 8 (1.84%) Big Data
10 8 (1.84%) MongoDB
11 7 (1.61%) Data Lake
Development Applications
1 67 (15.40%) Artifactory
2 43 (9.89%) Git
3 23 (5.29%) Jenkins
4 14 (3.22%) IntelliJ
5 12 (2.76%) GitLab
6 10 (2.30%) JUnit
7 9 (2.07%) JIRA
7 9 (2.07%) Maven
8 8 (1.84%) DbUnit
8 8 (1.84%) jMock
8 8 (1.84%) Mockito
8 8 (1.84%) SonarQube
9 6 (1.38%) Bitbucket Server
9 6 (1.38%) Subversion
10 4 (0.92%) Cypress.io
10 4 (0.92%) KGDB
11 3 (0.69%) Bitbucket
11 3 (0.69%) GDB
11 3 (0.69%) Oracle APEX
11 3 (0.69%) webpack
General
1 104 (23.91%) Finance
2 87 (20.00%) Social Skills
3 67 (15.40%) Front Office
4 40 (9.20%) Law
5 28 (6.44%) Analytical Skills
6 26 (5.98%) Public Sector
7 24 (5.52%) Inclusion and Diversity
8 18 (4.14%) Banking
9 17 (3.91%) Retail
10 11 (2.53%) Electronics
10 11 (2.53%) Games
11 8 (1.84%) Aerospace
11 8 (1.84%) Manufacturing
11 8 (1.84%) Marketing
12 6 (1.38%) Advertising
13 5 (1.15%) Multimedia
13 5 (1.15%) Presentation Skills
14 4 (0.92%) Documentation Skills
14 4 (0.92%) Public Speaking
15 3 (0.69%) Automotive
Job Titles
1 93 (21.38%) Senior
2 85 (19.54%) AWS Engineer
3 77 (17.70%) DevOps Engineer
4 76 (17.47%) Data Engineer
5 73 (16.78%) AWS DevOps
5 73 (16.78%) AWS DevOps Engineer
6 72 (16.55%) Python Engineer
7 61 (14.02%) Developer
8 60 (13.79%) Architect
9 55 (12.64%) Lead
10 49 (11.26%) Software Engineer
11 42 (9.66%) Software Architect
12 28 (6.44%) Analyst
13 16 (3.68%) Java Engineer
13 16 (3.68%) Site Reliability Engineer
14 15 (3.45%) Senior Java Engineer
14 15 (3.45%) Senior Software Engineer
15 14 (3.22%) Kubernetes Engineer
16 13 (2.99%) SOC Analyst
16 13 (2.99%) Software Developer
Libraries, Frameworks & Software Standards
1 72 (16.55%) Kafka
2 67 (15.40%) J2EE
3 65 (14.94%) PySpark
4 45 (10.34%) Middleware
4 45 (10.34%) React
5 26 (5.98%) REST
6 24 (5.52%) Django
7 22 (5.06%) .NET
8 21 (4.83%) HTML
9 20 (4.60%) AngularJS
9 20 (4.60%) CSS
10 17 (3.91%) RESTful
10 17 (3.91%) Spring
11 15 (3.45%) Vue
12 13 (2.99%) Node.js
12 13 (2.99%) Spring Boot
13 12 (2.76%) jQuery
14 9 (2.07%) Hibernate
15 8 (1.84%) ActiveMQ
15 8 (1.84%) SOAP
Miscellaneous
1 36 (8.28%) Algorithms
2 23 (5.29%) Enterprise Software
3 22 (5.06%) Distributed Systems
4 21 (4.83%) Self-Motivation
5 15 (3.45%) Public Cloud
6 13 (2.99%) Mobile App
6 13 (2.99%) Virtual Team
7 12 (2.76%) Blog
7 12 (2.76%) Cyber Threat
8 11 (2.53%) Management Information System
9 10 (2.30%) Private Cloud
10 9 (2.07%) Onboarding
11 8 (1.84%) Cloud Native
11 8 (1.84%) CSOC
11 8 (1.84%) Tandem
12 7 (1.61%) Embedded Systems
13 6 (1.38%) EPoS
13 6 (1.38%) Social Media
14 5 (1.15%) Linux Command Line
14 5 (1.15%) Product Ownership
Operating Systems
1 82 (18.85%) Linux
2 27 (6.21%) Unix
3 26 (5.98%) Windows
4 7 (1.61%) Android
5 6 (1.38%) Debian
6 3 (0.69%) Apple iOS
6 3 (0.69%) CentOS
6 3 (0.69%) Embedded Linux
6 3 (0.69%) Mac OS
7 2 (0.46%) Red Hat Enterprise Linux
7 2 (0.46%) Ubuntu
7 2 (0.46%) Windows Server
8 1 (0.23%) Amazon Linux
8 1 (0.23%) SUSE
8 1 (0.23%) Windows Server 2016
Processes & Methodologies
1 186 (42.76%) DevOps
2 183 (42.07%) Agile
3 154 (35.40%) Software Engineering
4 134 (30.80%) CI/CD
5 93 (21.38%) Computer Science
6 89 (20.46%) Site Reliability Engineering
7 86 (19.77%) Mentoring
8 79 (18.16%) Data Engineering
9 67 (15.40%) Asset Management
10 62 (14.25%) Problem-Solving
11 61 (14.02%) Design Patterns
12 59 (13.56%) Continuous Improvement
13 54 (12.41%) SDLC
14 49 (11.26%) Analytics
15 47 (10.80%) Microservices
16 46 (10.57%) Containerisation
17 45 (10.34%) Configuration Management
18 44 (10.11%) Waterfall
19 42 (9.66%) Continuous Integration
19 42 (9.66%) UML
Programming Languages
1 183 (42.07%) Python
2 127 (29.20%) Java
3 93 (21.38%) Go
4 53 (12.18%) JavaScript
5 46 (10.57%) SQL
6 32 (7.36%) TypeScript
7 25 (5.75%) C
7 25 (5.75%) C++
8 19 (4.37%) C#
9 16 (3.68%) PHP
10 9 (2.07%) Bash
11 8 (1.84%) Fortran
12 7 (1.61%) Kusto Query Language
13 6 (1.38%) R
13 6 (1.38%) Scala
14 5 (1.15%) Rust
15 4 (0.92%) PowerShell
15 4 (0.92%) Ruby
16 3 (0.69%) Embedded C
16 3 (0.69%) Embedded C++
Qualifications
1 133 (30.57%) Degree
2 66 (15.17%) Security Cleared
3 61 (14.02%) SC Cleared
4 51 (11.72%) Computer Science Degree
5 46 (10.57%) BPSS Clearance
6 42 (9.66%) Chartered Engineer
7 37 (8.51%) Master's Degree
8 34 (7.82%) PhD
9 17 (3.91%) DV Cleared
10 4 (0.92%) AWS Certification
11 3 (0.69%) CompTIA Security+
12 2 (0.46%) Azure Certification
12 2 (0.46%) DBS Check
13 1 (0.23%) ISTQB
13 1 (0.23%) ISTQB Foundation Certification
13 1 (0.23%) Numerate Degree
13 1 (0.23%) PMI Certification
13 1 (0.23%) PMP
Quality Assurance & Compliance
1 42 (9.66%) ISO/IEC 12207
2 18 (4.14%) Accessibility
3 9 (2.07%) QA
4 8 (1.84%) GDPR
5 5 (1.15%) NIST
5 5 (1.15%) PCI DSS
6 4 (0.92%) California Consumer Privacy Act
7 3 (0.69%) ISO/IEC 27001
7 3 (0.69%) JTAG
8 2 (0.46%) MiFID
9 1 (0.23%) Cyber Essentials
9 1 (0.23%) Data Quality
9 1 (0.23%) PMO
9 1 (0.23%) SLA
System Software
1 128 (29.43%) Docker
2 10 (2.30%) Firmware
3 7 (1.61%) Virtual Machines
4 5 (1.15%) Embedded Firmware
5 4 (0.92%) Active Directory
5 4 (0.92%) Postfix
5 4 (0.92%) VMware Infrastructure
6 3 (0.69%) Hyper-V
7 1 (0.23%) Varnish
7 1 (0.23%) vSphere
Systems Management
1 116 (26.67%) Kubernetes
2 102 (23.45%) Terraform
3 11 (2.53%) AWS Copilot
4 8 (1.84%) QRadar
5 6 (1.38%) Istio
6 5 (1.15%) Puppet
7 4 (0.92%) Grafana
7 4 (0.92%) Prometheus
8 3 (0.69%) Graylog
8 3 (0.69%) Microsoft Intune
8 3 (0.69%) Oozie
9 1 (0.23%) Ansible
9 1 (0.23%) Computer Emergency Response Teams
9 1 (0.23%) Nessus
9 1 (0.23%) vCenter Server
Vendors
1 34 (7.82%) Microsoft
2 28 (6.44%) Google
3 9 (2.07%) Atlassian
4 7 (1.61%) Databricks
5 6 (1.38%) Adobe
5 6 (1.38%) Apple
5 6 (1.38%) ArcSight
5 6 (1.38%) Confluent
5 6 (1.38%) Oracle
5 6 (1.38%) VMware
6 4 (0.92%) Mercator
7 3 (0.69%) Citrix
7 3 (0.69%) Jaspersoft
7 3 (0.69%) Palantir
7 3 (0.69%) Red Hat
8 2 (0.46%) Autodesk
8 2 (0.46%) PagerDuty
8 2 (0.46%) Salesforce
8 2 (0.46%) Splunk
9 1 (0.23%) PayPal