Mentoring Jobs with Hybrid/Remote/WFH Options

Mentorship
UK > Work from Home

The table below provides summary statistics for permanent remote or hybrid work requiring Mentoring skills. It includes a benchmarking guide to the annual salaries offered in vacancies that cited Mentoring over the 6 months leading up to 16 May 2025, comparing them to the same period in the previous two years.

6 months to
16 May 2025
Same period 2024 Same period 2023
Rank 11 17 30
Rank change year-on-year +6 +13 +1
Permanent jobs citing Mentoring 2,575 3,586 3,365
As % of all permanent jobs with a WFH option 14.06% 10.63% 8.27%
As % of the Processes & Methodologies category 14.93% 11.63% 8.61%
Number of salaries quoted 891 2,716 2,212
10th Percentile £37,716 £40,988 £42,525
25th Percentile £52,500 £47,500 £55,000
Median annual salary (50th Percentile) £65,000 £63,194 £70,000
Median % change year-on-year +2.86% -9.72% +12.00%
75th Percentile £81,250 £81,250 £87,500
90th Percentile £102,410 £92,500 £106,250
UK median annual salary £65,000 £61,206 £70,000
% change year-on-year +6.20% -12.56% +12.00%

All Process and Methodology Skills
Work from Home

Mentoring falls under the Processes and Methodologies category. For comparison with the information above, the following table provides summary statistics for all permanent job vacancies with remote or hybrid options requiring process or methodology skills.

Permanent vacancies with a requirement for process or methodology skills 17,249 30,823 39,093
As % of all permanent jobs with a WFH option 94.20% 91.36% 96.08%
Number of salaries quoted 9,742 23,354 27,124
10th Percentile £28,500 £33,750 £37,500
25th Percentile £42,500 £42,500 £47,500
Median annual salary (50th Percentile) £60,000 £57,500 £62,500
Median % change year-on-year +4.35% -8.00% +4.17%
75th Percentile £77,500 £75,000 £82,500
90th Percentile £101,250 £95,000 £100,000
UK median annual salary £57,500 £55,000 £61,180
% change year-on-year +4.55% -10.10% +1.97%

Mentoring
Trend for Jobs with a WFH Option

Job vacancies with remote working options citing Mentoring as a proportion of all IT jobs advertised.
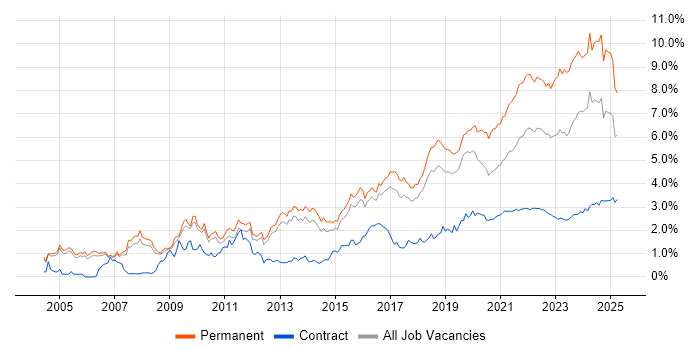
Mentoring trend for jobs with Hybrid/Remote/WFH options

Mentoring
Salary Trend for Jobs with a WFH Option

3-month moving average salary quoted in job vacancies with remote working options citing Mentoring.

Mentoring salary trend for jobs with a WFH option

Mentoring
Salary Histogram for Jobs with a WFH Option

Salary distribution for jobs with remote working options citing Mentoring over the 6 months to 16 May 2025.

Mentoring salary histogram for jobs with a WFH option

Mentoring
Co-occurring Skills and Capabilities with WFH Options by Category

The follow tables expand on the table above by listing co-occurrences grouped by category. The same employment type, locality and period is covered with up to 20 co-occurrences shown in each of the following categories:

Application Platforms
1 43 (1.67%) Microsoft Exchange
2 31 (1.20%) Confluence
3 29 (1.13%) SharePoint
4 25 (0.97%) Jupyter
5 14 (0.54%) Apache Spark
6 9 (0.35%) OpenEdge
7 8 (0.31%) CMS
8 7 (0.27%) Apache
9 5 (0.19%) Umbraco
10 4 (0.16%) IIS
11 3 (0.12%) Adobe Experience Manager
11 3 (0.12%) Apache Airflow
11 3 (0.12%) ArcGIS
12 2 (0.078%) Apache Solr
12 2 (0.078%) Mendix
12 2 (0.078%) Sitecore CMS
12 2 (0.078%) ThingWorx
13 1 (0.039%) EPiServer
13 1 (0.039%) Oracle SOA Suite
13 1 (0.039%) SAS
Applications
1 42 (1.63%) Microsoft Excel
2 21 (0.82%) Microsoft Office
3 12 (0.47%) Microsoft PowerPoint
4 8 (0.31%) AutoCAD
5 6 (0.23%) Microsoft Project
6 4 (0.16%) Adobe Creative Suite
6 4 (0.16%) Adobe Illustrator
6 4 (0.16%) Adobe XD
6 4 (0.16%) Spreadsheet
7 3 (0.12%) EPLAN
7 3 (0.12%) Sketch
8 2 (0.078%) InDesign
8 2 (0.078%) Photoshop
8 2 (0.078%) Trello
9 1 (0.039%) Blender
9 1 (0.039%) Chatbot
9 1 (0.039%) MicroStation
9 1 (0.039%) MS Visio
9 1 (0.039%) ProjectWise
9 1 (0.039%) Revit
Business Applications
1 15 (0.58%) Dynamics CRM
2 14 (0.54%) Oracle EBS
3 9 (0.35%) Oracle ERP
4 7 (0.27%) SAP S/4HANA
5 6 (0.23%) Oracle Applications
6 4 (0.16%) PeopleSoft HCM
6 4 (0.16%) Shopify
7 3 (0.12%) CA PPM
7 3 (0.12%) Magento
7 3 (0.12%) Salesforce CRM
8 2 (0.078%) SAP CO
8 2 (0.078%) SAP FI
8 2 (0.078%) SAP FI/CO
9 1 (0.039%) BASE24
9 1 (0.039%) Dynamics GP
9 1 (0.039%) Maximo
9 1 (0.039%) NetSuite
Cloud Services
1 918 (35.65%) AWS
2 800 (31.07%) Azure
3 484 (18.80%) GCP
4 277 (10.76%) Serverless
5 262 (10.17%) AWS Lambda
6 215 (8.35%) Pulumi
7 100 (3.88%) Power Platform
8 89 (3.46%) SaaS
9 79 (3.07%) Microsoft 365
10 67 (2.60%) GitHub
11 66 (2.56%) Azure DevOps
12 30 (1.17%) Entra ID
13 29 (1.13%) Amazon S3
14 27 (1.05%) GitHub Actions
15 26 (1.01%) AWS CloudFormation
16 25 (0.97%) Dynamics 365
16 25 (0.97%) PowerApps
17 21 (0.82%) PaaS
18 16 (0.62%) Amazon EC2
19 15 (0.58%) Cloud Computing
Communications & Networking
1 989 (38.41%) Broadband
2 54 (2.10%) Firewall
3 36 (1.40%) WAN
4 27 (1.05%) Network Security
5 26 (1.01%) LAN
6 20 (0.78%) VPN
7 18 (0.70%) DNS
7 18 (0.70%) Wi-Fi
8 16 (0.62%) DHCP
9 14 (0.54%) SD-WAN
10 12 (0.47%) VLAN
11 10 (0.39%) HTTP
12 9 (0.35%) SAN
13 8 (0.31%) 5G
13 8 (0.31%) Internet
13 8 (0.31%) NAS
13 8 (0.31%) Wireless
14 7 (0.27%) TCP/IP
15 5 (0.19%) Cisco ISE
15 5 (0.19%) SSH
Database & Business Intelligence
1 241 (9.36%) NoSQL
2 240 (9.32%) Relational Database
3 224 (8.70%) RDBMS
4 178 (6.91%) SQL Server
5 68 (2.64%) Power BI
6 54 (2.10%) Tableau
7 49 (1.90%) Data Warehouse
8 48 (1.86%) PostgreSQL
9 40 (1.55%) Big Data
10 37 (1.44%) Data Lake
11 30 (1.17%) SQL Server Integration Services
12 23 (0.89%) MongoDB
13 21 (0.82%) Amazon Redshift
14 20 (0.78%) MySQL
15 19 (0.74%) BigQuery
16 18 (0.70%) SQL Server Reporting Services
17 17 (0.66%) Amazon RDS
18 15 (0.58%) DynamoDB
18 15 (0.58%) Looker
19 13 (0.50%) DB2
Development Applications
1 215 (8.35%) Jaeger
2 144 (5.59%) JIRA
3 118 (4.58%) SonarQube
4 111 (4.31%) GitLab
5 105 (4.08%) Selenium
6 96 (3.73%) Cucumber
7 94 (3.65%) Git
8 92 (3.57%) Maven
9 90 (3.50%) Bitbucket
9 90 (3.50%) Sonatype Nexus
10 60 (2.33%) Jenkins
11 21 (0.82%) Visual Studio
12 15 (0.58%) Postman
13 11 (0.43%) Oracle Forms
14 9 (0.35%) JUnit
14 9 (0.35%) Subversion
15 8 (0.31%) webpack
16 7 (0.27%) Gradle
16 7 (0.27%) IBM UrbanCode
16 7 (0.27%) Xcode
General
1 1,044 (40.54%) Social Skills
2 611 (23.73%) Inclusion and Diversity
3 400 (15.53%) Finance
4 352 (13.67%) Analytical Skills
5 221 (8.58%) Banking
6 147 (5.71%) Retail
7 94 (3.65%) Investment Banking
8 91 (3.53%) Law
9 90 (3.50%) Corporate Banking
9 90 (3.50%) Marketing
10 83 (3.22%) Multimedia
11 74 (2.87%) Public Sector
12 45 (1.75%) Advertising
13 41 (1.59%) Games
13 41 (1.59%) Legal
14 38 (1.48%) Presentation Skills
15 33 (1.28%) Organisational Skills
16 25 (0.97%) Electronics
17 23 (0.89%) German Language
18 21 (0.82%) Influencing Skills
Job Titles
1 765 (29.71%) Senior
2 747 (29.01%) Lead
3 389 (15.11%) Software Engineer
4 348 (13.51%) Team Leader
5 229 (8.89%) Senior Software Engineer
6 216 (8.39%) Machine Learning Engineer
7 163 (6.33%) Systems Engineer
8 137 (5.32%) Developer
9 119 (4.62%) Engineering Manager
10 87 (3.38%) Architect
11 80 (3.11%) Analyst
12 57 (2.21%) Senior Developer
13 53 (2.06%) Data Engineer
14 42 (1.63%) Support Engineer
15 41 (1.59%) IT Manager
16 40 (1.55%) Audit Manager
16 40 (1.55%) IT Support
17 37 (1.44%) Account Manager
18 36 (1.40%) Lead Developer
18 36 (1.40%) Senior Manager
Libraries, Frameworks & Software Standards
1 313 (12.16%) .NET
2 244 (9.48%) Node.js
3 230 (8.93%) Elastic Stack
4 215 (8.35%) OpenTelemetry
5 187 (7.26%) React
6 150 (5.83%) Kafka
7 138 (5.36%) CSS
8 133 (5.17%) HTML
8 133 (5.17%) Spring
9 128 (4.97%) REST
10 125 (4.85%) RESTful
11 115 (4.47%) Spring Boot
12 102 (3.96%) Jest
13 100 (3.88%) Redux
14 98 (3.81%) HTML5
15 97 (3.77%) CSS3
16 96 (3.73%) Sass
17 92 (3.57%) JPA
18 42 (1.63%) AngularJS
19 36 (1.40%) SailPoint
Miscellaneous
1 407 (15.81%) Self-Motivation
2 201 (7.81%) Cyberattack
3 195 (7.57%) Product Ownership
4 185 (7.18%) Linux Command Line
5 96 (3.73%) Enterprise Software
6 81 (3.15%) Management Information System
7 53 (2.06%) Onboarding
8 45 (1.75%) Driving Licence
9 43 (1.67%) Algorithms
10 42 (1.63%) Virtual Team
11 36 (1.40%) Marketing Technology
12 35 (1.36%) Digital Media
13 34 (1.32%) NHS
14 31 (1.20%) Cloud Native
15 29 (1.13%) Public Cloud
16 24 (0.93%) Data Centre
16 24 (0.93%) Legacy Systems
17 23 (0.89%) Distributed Systems
18 21 (0.82%) Renewable Energy
19 19 (0.74%) IoT
Operating Systems
1 468 (18.17%) Linux
2 221 (8.58%) Unix
3 91 (3.53%) Windows
4 43 (1.67%) Windows Server
5 26 (1.01%) Apple iOS
6 21 (0.82%) Android
7 16 (0.62%) Windows Server 2016
8 15 (0.58%) Windows Server 2019
9 8 (0.31%) Windows 10
10 2 (0.078%) Oracle Linux
11 1 (0.039%) CentOS
11 1 (0.039%) Debian
11 1 (0.039%) Red Hat Enterprise Linux
11 1 (0.039%) Windows Server 2012
Processes & Methodologies
1 1,141 (44.31%) Agile
2 1,068 (41.48%) Problem-Solving
3 904 (35.11%) Roadmaps
4 802 (31.15%) High Availability
5 796 (30.91%) Product Management
6 673 (26.14%) Computer Science
7 598 (23.22%) DevOps
8 583 (22.64%) Software Engineering
9 557 (21.63%) Broadcast Engineering
10 503 (19.53%) CI/CD
11 455 (17.67%) Machine Learning
12 434 (16.85%) Microservices
13 381 (14.80%) Containerisation
14 332 (12.89%) Performance Optimisation
15 327 (12.70%) User Experience
16 307 (11.92%) Coaching
17 286 (11.11%) Data Science
18 274 (10.64%) Infrastructure as Code
19 266 (10.33%) Creative Thinking
20 262 (10.17%) Continuous Integration
Programming Languages
1 822 (31.92%) Python
2 663 (25.75%) Java
3 638 (24.78%) JavaScript
4 406 (15.77%) Go
5 397 (15.42%) TypeScript
6 335 (13.01%) SQL
7 238 (9.24%) Bash
8 212 (8.23%) C++
9 180 (6.99%) Rust
10 153 (5.94%) C#
11 71 (2.76%) PowerShell
12 40 (1.55%) PHP
13 30 (1.17%) C
14 23 (0.89%) PL/SQL
15 19 (0.74%) R
16 17 (0.66%) T-SQL
17 16 (0.62%) VB.NET
18 13 (0.50%) Swift
19 11 (0.43%) Kotlin
19 11 (0.43%) Ruby
Qualifications
1 1,045 (40.58%) Degree
2 636 (24.70%) Computer Science Degree
3 417 (16.19%) AWS Certification
4 310 (12.04%) Security Cleared
5 218 (8.47%) PhD
6 212 (8.23%) DV Cleared
7 192 (7.46%) AWS Certified Solutions Architect
8 178 (6.91%) AWS Certified Developer
9 72 (2.80%) SC Cleared
10 42 (1.63%) Chartered Engineer
11 41 (1.59%) Master's Degree
12 38 (1.48%) Microsoft Certification
13 32 (1.24%) DBS Check
14 27 (1.05%) CISSP
15 23 (0.89%) Azure Certification
16 21 (0.82%) ACCA
17 20 (0.78%) CISA
18 19 (0.74%) Cisco Certification
19 18 (0.70%) PMI Certification
20 16 (0.62%) CCNP
Quality Assurance & Compliance
1 186 (7.22%) QA
2 135 (5.24%) Accessibility
3 42 (1.63%) Data Quality
4 34 (1.32%) GDPR
5 33 (1.28%) ISO/IEC 27001
6 21 (0.82%) GAAP
6 21 (0.82%) IFRS
6 21 (0.82%) PMO
7 19 (0.74%) ITGC
8 17 (0.66%) HIPAA
8 17 (0.66%) NIST
9 12 (0.47%) ISO 9001
10 9 (0.35%) NCSC
11 8 (0.31%) SLA
12 7 (0.27%) Cyber Essentials
13 6 (0.23%) CDISC
14 5 (0.19%) SOC 2
15 4 (0.16%) Cyber Essentials PLUS
15 4 (0.16%) WCAG
16 3 (0.12%) PCI DSS
System Software
1 456 (17.71%) Docker
2 79 (3.07%) Active Directory
3 29 (1.13%) VMware Infrastructure
4 14 (0.54%) XenApp
5 8 (0.31%) Hyper-V
6 6 (0.23%) Firmware
7 5 (0.19%) HDFS
7 5 (0.19%) VMware NSX
8 4 (0.16%) Embedded Firmware
9 3 (0.12%) vSphere
10 1 (0.039%) Virtual Machines
Systems Management
1 456 (17.71%) Kubernetes
2 296 (11.50%) Terraform
3 249 (9.67%) Ansible
4 235 (9.13%) Prometheus
5 215 (8.35%) Argo
5 215 (8.35%) Kustomize
6 20 (0.78%) Grafana
7 17 (0.66%) Microsoft Intune
8 8 (0.31%) Progress Chef
8 8 (0.31%) QRadar
9 6 (0.23%) SCCM
10 3 (0.12%) CA Endevor
10 3 (0.12%) Functional Safety
10 3 (0.12%) Puppet
11 2 (0.078%) FortiGate
11 2 (0.078%) Single Sign-On
11 2 (0.078%) Systems Management Server (SMS)
12 1 (0.039%) NetBackup
12 1 (0.039%) SCOM
12 1 (0.039%) ZABBIX
Vendors
1 271 (10.52%) Google
2 199 (7.73%) Microsoft
3 90 (3.50%) Solace
4 47 (1.83%) Oracle
5 38 (1.48%) VMware
6 37 (1.44%) Salesforce
7 36 (1.40%) Cisco
8 34 (1.32%) Databricks
9 25 (0.97%) Okta
10 23 (0.89%) Adobe
10 23 (0.89%) SAP
11 21 (0.82%) Meraki
11 21 (0.82%) ServiceNow
12 17 (0.66%) CheckPoint
13 15 (0.58%) Citrix
14 14 (0.54%) SonicWALL
15 11 (0.43%) Facebook
16 10 (0.39%) OpenAI
16 10 (0.39%) Palo Alto
17 9 (0.35%) YouTube