Analytical Skills Jobs with Hybrid/Remote/WFH Options

Analytical Skills
UK > Work from Home

The table below looks at the prevalence of the term Analytical Skills in remote or hybrid work. Included is a benchmarking guide to the salaries offered in vacancies that cited Analytical Skills over the 6 months leading up to 7 May 2025, comparing them to the same period in the previous two years.

6 months to
7 May 2025
Same period 2024 Same period 2023
Rank 18 21 21
Rank change year-on-year +3 0 +18
Permanent jobs citing Analytical Skills 1,708 3,264 4,359
As % of all permanent jobs with a WFH option 10.41% 9.64% 10.29%
As % of the General category 13.50% 15.70% 15.57%
Number of salaries quoted 931 1,895 2,422
10th Percentile £32,500 £31,250 £30,500
25th Percentile £43,750 £40,988 £40,798
Median annual salary (50th Percentile) £55,000 £52,500 £52,500
Median % change year-on-year +4.76% - -4.55%
75th Percentile £71,250 £71,250 £71,250
90th Percentile £85,000 £88,750 £89,900
UK median annual salary £55,000 £50,000 £54,882
% change year-on-year +10.00% -8.90% -0.21%

All General Skills
Work from Home

Analytical Skills falls under the General Skills category. For comparison with the information above, the following table provides summary statistics for all permanent job vacancies with remote or hybrid options requiring common skills.

Permanent vacancies with a requirement for common skills 12,655 20,785 28,005
As % of all permanent jobs with a WFH option 77.13% 61.39% 66.08%
Number of salaries quoted 7,578 15,154 18,641
10th Percentile £25,087 £31,750 £36,250
25th Percentile £41,250 £41,750 £46,570
Median annual salary (50th Percentile) £57,500 £55,000 £62,500
Median % change year-on-year +4.55% -12.00% +4.17%
75th Percentile £77,500 £75,000 £82,500
90th Percentile £106,250 £95,000 £102,500
UK median annual salary £55,000 £52,500 £60,000
% change year-on-year +4.76% -12.50% -

Analytical Skills
Trend for Jobs with a WFH Option

Job vacancies with remote working options citing Analytical Skills as a proportion of all IT jobs advertised.
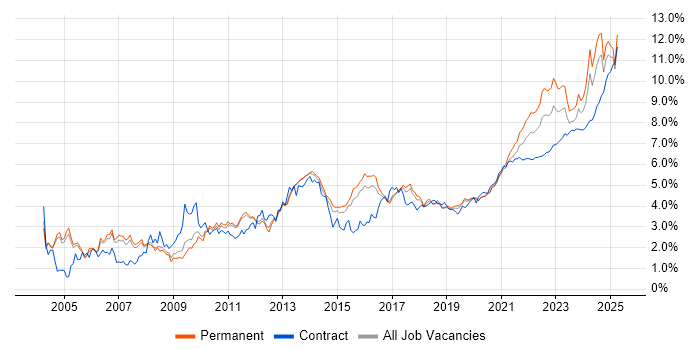
Analytical Skills trend for jobs with Hybrid/Remote/WFH options

Analytical Skills
Salary Trend for Jobs with a WFH Option

3-month moving average salary quoted in job vacancies with remote working options citing Analytical Skills.

Analytical Skills salary trend for jobs with a WFH option

Analytical Skills
Salary Histogram for Jobs with a WFH Option

Salary distribution for jobs with remote working options citing Analytical Skills over the 6 months to 7 May 2025.

Analytical Skills salary histogram for jobs with a WFH option

Analytical Skills
Co-occurring Skills and Capabilities with WFH Options by Category

The follow tables expand on the table above by listing co-occurrences grouped by category. The same employment type, locality and period is covered with up to 20 co-occurrences shown in each of the following categories:

Application Platforms
1 75 (4.39%) Oracle Application Server
2 39 (2.28%) SharePoint
3 25 (1.46%) Microsoft Exchange
4 23 (1.35%) CMS
5 18 (1.05%) Apache Spark
6 13 (0.76%) Confluence
6 13 (0.76%) SAS
7 7 (0.41%) Apache
7 7 (0.41%) Sitecore CMS
8 5 (0.29%) Apache Airflow
8 5 (0.29%) ArcGIS
9 4 (0.23%) Headless CMS
9 4 (0.23%) Jupyter
9 4 (0.23%) Moodle
9 4 (0.23%) WordPress
10 3 (0.18%) nginx
11 2 (0.12%) IIS
11 2 (0.12%) Skype for Business
12 1 (0.059%) IBM Notes
12 1 (0.059%) OpenEdge
Applications
1 135 (7.90%) Chatbot
2 131 (7.67%) Microsoft Excel
3 61 (3.57%) Microsoft Office
4 42 (2.46%) Microsoft PowerPoint
5 14 (0.82%) Microsoft Project
6 10 (0.59%) Spreadsheet
7 8 (0.47%) Trello
8 5 (0.29%) MS Visio
9 2 (0.12%) Adobe Captivate
9 2 (0.12%) Adobe Creative Suite
9 2 (0.12%) Adobe Illustrator
9 2 (0.12%) AutoCAD
9 2 (0.12%) SPSS
9 2 (0.12%) Zemax
10 1 (0.059%) Adobe XD
10 1 (0.059%) Blender
10 1 (0.059%) MicroStation
10 1 (0.059%) Revit
10 1 (0.059%) Simulink
10 1 (0.059%) Sketch
Business Applications
1 21 (1.23%) Academy Revenues and Benefits
2 19 (1.11%) Shopify
3 18 (1.05%) Dynamics CRM
4 13 (0.76%) NetSuite
5 11 (0.64%) Oracle EBS
6 8 (0.47%) Dynamics NAV
6 8 (0.47%) SAP S/4HANA
7 7 (0.41%) Salesforce CRM
8 6 (0.35%) Infor M3
9 4 (0.23%) Oracle Applications
9 4 (0.23%) Raiser’s Edge
10 3 (0.18%) Infor CloudSuite
10 3 (0.18%) Infor CloudSuite Industrial (formerly SyteLine)
10 3 (0.18%) Maximo
10 3 (0.18%) Remedy ITSM
10 3 (0.18%) SAP ERP
11 2 (0.12%) Adobe Campaign
11 2 (0.12%) Carpe Diem
11 2 (0.12%) IBM Planning Analytics
11 2 (0.12%) SAP Oil and Gas
Cloud Services
1 313 (18.33%) Azure
2 189 (11.07%) AWS
3 181 (10.60%) Power Platform
4 127 (7.44%) Microsoft 365
5 88 (5.15%) SaaS
6 55 (3.22%) GCP
7 52 (3.04%) AWS CloudFormation
8 51 (2.99%) Amazon EKS
9 47 (2.75%) Google Analytics
10 46 (2.69%) Dynamics 365
11 32 (1.87%) Entra ID
12 31 (1.81%) Azure DevOps
13 30 (1.76%) Azure Data Factory
13 30 (1.76%) Snowflake
14 20 (1.17%) Azure Logic Apps
14 20 (1.17%) Google Ads
14 20 (1.17%) Google Tag Manager
15 19 (1.11%) GitHub
16 18 (1.05%) Cloud Computing
17 16 (0.94%) Power Automate
Communications & Networking
1 55 (3.22%) Firewall
2 30 (1.76%) DNS
3 25 (1.46%) WAN
4 24 (1.41%) TCP/IP
5 22 (1.29%) VPN
6 21 (1.23%) WPA
7 20 (1.17%) Wireless
8 17 (1.00%) DHCP
8 17 (1.00%) Intrusion Detection
8 17 (1.00%) VLAN
9 16 (0.94%) LAN
10 14 (0.82%) Wi-Fi
11 12 (0.70%) Network Security
12 11 (0.64%) BGP
13 10 (0.59%) HTTP
13 10 (0.59%) SD-WAN
14 8 (0.47%) Internet
14 8 (0.47%) SAN
15 7 (0.41%) OSPF
15 7 (0.41%) SMTP
Database & Business Intelligence
1 159 (9.31%) Data Warehouse
2 156 (9.13%) Power BI
3 106 (6.21%) Tableau
4 85 (4.98%) SQL Server
5 80 (4.68%) Enterprise Data Warehouse
6 78 (4.57%) Oracle Reports
7 65 (3.81%) Big Data
8 49 (2.87%) Elasticsearch
9 43 (2.52%) Data Lake
10 39 (2.28%) Relational Database
11 28 (1.64%) SQL Server Integration Services
12 25 (1.46%) PostgreSQL
13 24 (1.41%) SQL Server Reporting Services
14 17 (1.00%) MySQL
14 17 (1.00%) Power Query
15 15 (0.88%) Azure SQL Database
16 14 (0.82%) Data Mining
17 13 (0.76%) BigQuery
17 13 (0.76%) BusinessObjects
18 12 (0.70%) Hadoop
Development Applications
1 86 (5.04%) Git
2 46 (2.69%) JIRA
3 27 (1.58%) Jenkins
4 16 (0.94%) Visual Studio
5 10 (0.59%) Selenium
6 8 (0.47%) Bazaar
6 8 (0.47%) Oracle Forms
6 8 (0.47%) Subversion
7 7 (0.41%) JMeter
8 6 (0.35%) GitLab
8 6 (0.35%) JUnit
9 5 (0.29%) IBM UrbanCode
10 4 (0.23%) Cypress.io
10 4 (0.23%) Mocha
11 3 (0.18%) Axure RP
11 3 (0.18%) GDB
11 3 (0.18%) Mockito
11 3 (0.18%) Postman
11 3 (0.18%) Team Foundation Server
11 3 (0.18%) WebDriver
General
1 892 (52.22%) Social Skills
2 506 (29.63%) Finance
3 221 (12.94%) Marketing
4 153 (8.96%) Inclusion and Diversity
5 143 (8.37%) Retail
6 129 (7.55%) Organisational Skills
7 103 (6.03%) Presentation Skills
8 98 (5.74%) Banking
9 80 (4.68%) Military
10 77 (4.51%) Legal
11 76 (4.45%) Advertising
12 73 (4.27%) Public Sector
13 63 (3.69%) Manufacturing
14 60 (3.51%) Law
15 44 (2.58%) Electronics
16 42 (2.46%) Telecoms
17 38 (2.22%) Influencing Skills
18 37 (2.17%) Local Government
19 28 (1.64%) Games
20 27 (1.58%) Billing
Job Titles
1 323 (18.91%) Analyst
2 244 (14.29%) Senior
3 161 (9.43%) Developer
4 138 (8.08%) Trainer
5 93 (5.44%) Data Analyst
6 83 (4.86%) Senior Analyst
7 76 (4.45%) Lead
8 58 (3.40%) Business Analyst
9 57 (3.34%) Senior Manager
10 56 (3.28%) Software Developer
11 55 (3.22%) Data Engineer
12 52 (3.04%) Account Manager
13 50 (2.93%) Consultant
14 49 (2.87%) Senior Account Manager
15 45 (2.63%) Architect
16 40 (2.34%) IT Manager
17 37 (2.17%) Financial Analyst
18 35 (2.05%) Administrator
18 35 (2.05%) Applications Support
18 35 (2.05%) IT Support
Libraries, Frameworks & Software Standards
1 93 (5.44%) .NET
2 66 (3.86%) Node.js
3 56 (3.28%) Pandas
4 42 (2.46%) HTML
5 30 (1.76%) React
6 29 (1.70%) REST
7 28 (1.64%) CSS
8 25 (1.46%) AngularJS
9 20 (1.17%) SOAP
10 16 (0.94%) RESTful
10 16 (0.94%) XML
11 15 (0.88%) Web Services
12 14 (0.82%) JSON
13 13 (0.76%) .NET Framework
13 13 (0.76%) Kafka
13 13 (0.76%) Middleware
14 11 (0.64%) .NET Core
14 11 (0.64%) Oracle Fusion
15 9 (0.53%) ASP.NET
15 9 (0.53%) Entity Framework
Miscellaneous
1 92 (5.39%) Analytical Mindset
2 64 (3.75%) Management Information System
3 51 (2.99%) Algorithms
4 50 (2.93%) Digital Media
4 50 (2.93%) Marketing Technology
5 49 (2.87%) Cyberattack
5 49 (2.87%) Product Ownership
6 46 (2.69%) Self-Motivation
7 43 (2.52%) Social Media
8 36 (2.11%) Data Structures
9 30 (1.76%) Onboarding
10 27 (1.58%) PMI
11 24 (1.41%) Data Centre
12 22 (1.29%) Learning Management System
13 21 (1.23%) Credit Risk
13 21 (1.23%) NHS
14 20 (1.17%) Virtual Team
15 19 (1.11%) Blog
15 19 (1.11%) Driving Licence
16 17 (1.00%) Legacy Systems
Operating Systems
1 133 (7.79%) Linux
2 126 (7.38%) Windows
3 52 (3.04%) Android
4 34 (1.99%) Unix
5 21 (1.23%) Windows Vista
6 18 (1.05%) Windows Server
7 16 (0.94%) Red Hat Enterprise Linux
8 12 (0.70%) Windows 10
9 9 (0.53%) Apple iOS
9 9 (0.53%) Windows 7
10 4 (0.23%) Embedded Linux
10 4 (0.23%) Windows Server 2019
11 3 (0.18%) Windows 8
12 2 (0.12%) AIX
12 2 (0.12%) CentOS
12 2 (0.12%) Oracle Linux
12 2 (0.12%) SUSE
12 2 (0.12%) Windows Server 2003
13 1 (0.059%) Mac OS
13 1 (0.059%) Windows Server 2012
Processes & Methodologies
1 830 (48.59%) Problem-Solving
2 424 (24.82%) Agile
3 393 (23.01%) Analytics
4 287 (16.80%) Artificial Intelligence
5 238 (13.93%) Project Management
6 216 (12.65%) Continuous Improvement
7 208 (12.18%) Business Intelligence
8 186 (10.89%) Collaborative Working
9 184 (10.77%) DevOps
10 180 (10.54%) Decision-Making
11 174 (10.19%) Data Modelling
12 173 (10.13%) Visualisation
13 169 (9.89%) ITIL
14 155 (9.07%) Analytical Thinking
15 149 (8.72%) Data Management
16 143 (8.37%) Stakeholder Management
17 142 (8.31%) Chemistry
17 142 (8.31%) Roadmaps
18 138 (8.08%) Data Analysis
18 138 (8.08%) Mentoring
Programming Languages
1 375 (21.96%) SQL
2 318 (18.62%) Python
3 128 (7.49%) JavaScript
4 107 (6.26%) Java
5 89 (5.21%) C++
6 74 (4.33%) C#
7 53 (3.10%) PowerShell
8 51 (2.99%) Go
9 49 (2.87%) Rust
10 42 (2.46%) T-SQL
11 31 (1.81%) R
12 23 (1.35%) Shell Script
13 22 (1.29%) C
14 19 (1.11%) Bash
14 19 (1.11%) TypeScript
15 18 (1.05%) PL/SQL
15 18 (1.05%) VBA
16 14 (0.82%) PHP
17 11 (0.64%) Korn
18 10 (0.59%) Data Analysis Expressions
Qualifications
1 495 (28.98%) Degree
2 216 (12.65%) Master's Degree
3 181 (10.60%) PhD
4 172 (10.07%) DBS Check
5 143 (8.37%) Security Cleared
6 80 (4.68%) DV Cleared
7 62 (3.63%) Computer Science Degree
8 56 (3.28%) CISSP
9 54 (3.16%) PMI Certification
10 49 (2.87%) SC Cleared
11 32 (1.87%) CISM
12 31 (1.81%) PMP
13 20 (1.17%) Microsoft Certification
14 15 (0.88%) ACCA
15 14 (0.82%) Cisco Certification
16 13 (0.76%) Azure Certification
16 13 (0.76%) CIMA
16 13 (0.76%) CompTIA Security+
17 12 (0.70%) AWS Certification
17 12 (0.70%) CCNA
Quality Assurance & Compliance
1 106 (6.21%) QA
2 78 (4.57%) Data Quality
3 45 (2.63%) ISO/IEC 27001
4 42 (2.46%) GDPR
5 32 (1.87%) Accessibility
6 30 (1.76%) SLA
7 21 (1.23%) NIST
8 18 (1.05%) PMO
9 17 (1.00%) Cyber Essentials
9 17 (1.00%) PCI DSS
10 12 (0.70%) Cyber Essentials PLUS
11 11 (0.64%) GRC
12 8 (0.47%) GAAP
13 7 (0.41%) Actionable Recommendations
13 7 (0.41%) GxP
14 6 (0.35%) ISO 9001
14 6 (0.35%) SOC 2
15 4 (0.23%) Def Stans
15 4 (0.23%) GMP
15 4 (0.23%) HIPAA
System Software
1 68 (3.98%) Docker
2 52 (3.04%) Active Directory
3 15 (0.88%) VMware Infrastructure
4 14 (0.82%) Firmware
5 4 (0.23%) Embedded Firmware
5 4 (0.23%) HDFS
5 4 (0.23%) Hyper-V
5 4 (0.23%) VMware ESXi
5 4 (0.23%) vSphere
6 3 (0.18%) EMC RecoverPoint
6 3 (0.18%) Virtual Desktop
7 2 (0.12%) KVM
7 2 (0.12%) Postfix
7 2 (0.12%) Sendmail
7 2 (0.12%) Veritas Cluster Server
7 2 (0.12%) Virtual Machines
7 2 (0.12%) VMware NSX
8 1 (0.059%) BitLocker
8 1 (0.059%) Virtual Servers
Systems Management
1 69 (4.04%) Kubernetes
2 63 (3.69%) Ansible
3 57 (3.34%) Terraform
4 20 (1.17%) Microsoft Intune
5 13 (0.76%) Grafana
6 12 (0.70%) SCCM
7 10 (0.59%) SCOM
8 7 (0.41%) Nessus
9 6 (0.35%) Nagios
9 6 (0.35%) SCOrch
10 5 (0.29%) CA Endevor
10 5 (0.29%) Progress Chef
10 5 (0.29%) Prometheus
10 5 (0.29%) Puppet
11 4 (0.23%) Dell DRAC
11 4 (0.23%) Oracle RMAN
12 3 (0.18%) EMC NetWorker
12 3 (0.18%) vCenter Server
12 3 (0.18%) WMI
13 2 (0.12%) WSUS
Vendors
1 317 (18.56%) Microsoft
2 136 (7.96%) PayPal
3 128 (7.49%) Oracle
4 116 (6.79%) Google
5 81 (4.74%) SAP
6 67 (3.92%) Databricks
7 66 (3.86%) Salesforce
8 37 (2.17%) VMware
9 36 (2.11%) TikTok
10 34 (1.99%) Adobe
11 32 (1.87%) ServiceNow
12 26 (1.52%) Cisco
13 18 (1.05%) Red Hat
14 17 (1.00%) IBM
15 15 (0.88%) Tenable
16 14 (0.82%) Pinterest
17 12 (0.70%) SolarWinds
18 11 (0.64%) Ahrefs
18 11 (0.64%) Facebook
19 9 (0.53%) Aderant