Kanban
UK

The table below provides summary statistics for permanent job vacancies requiring Kanban skills. It includes a benchmarking guide to the annual salaries offered in vacancies that cited Kanban over the 6 months leading up to 11 May 2025, comparing them to the same period in the previous two years.

6 months to
11 May 2025
Same period 2024 Same period 2023
Rank 362 238 246
Rank change year-on-year -124 +8 -105
Permanent jobs citing Kanban 400 1,223 1,522
As % of all permanent jobs advertised in the UK 0.73% 1.23% 1.51%
As % of the Processes & Methodologies category 0.78% 1.44% 1.58%
Number of salaries quoted 252 900 722
10th Percentile £48,000 £42,500 £45,000
25th Percentile £52,500 £48,250 £52,500
Median annual salary (50th Percentile) £65,000 £64,080 £69,447
Median % change year-on-year +1.44% -7.73% +6.84%
75th Percentile £80,000 £83,750 £85,000
90th Percentile £97,375 £92,500 £95,000
UK excluding London median annual salary £58,250 £60,000 £64,029
% change year-on-year -2.92% -6.29% +7.61%

All Process and Methodology Skills
UK

Kanban falls under the Processes and Methodologies category. For comparison with the information above, the following table provides summary statistics for all permanent job vacancies requiring process or methodology skills.

Permanent vacancies with a requirement for process or methodology skills 51,302 84,920 96,579
As % of all permanent jobs advertised in the UK 93.76% 85.59% 95.61%
Number of salaries quoted 27,015 59,883 56,845
10th Percentile £30,000 £29,008 £34,000
25th Percentile £42,500 £40,000 £45,000
Median annual salary (50th Percentile) £57,500 £55,000 £61,180
Median % change year-on-year +4.55% -10.10% +1.97%
75th Percentile £75,000 £72,500 £81,250
90th Percentile £98,474 £92,500 £100,000
UK excluding London median annual salary £52,500 £50,000 £55,000
% change year-on-year +5.00% -9.09% +4.76%

Kanban
Job Vacancy Trend

Job postings citing Kanban as a proportion of all IT jobs advertised.
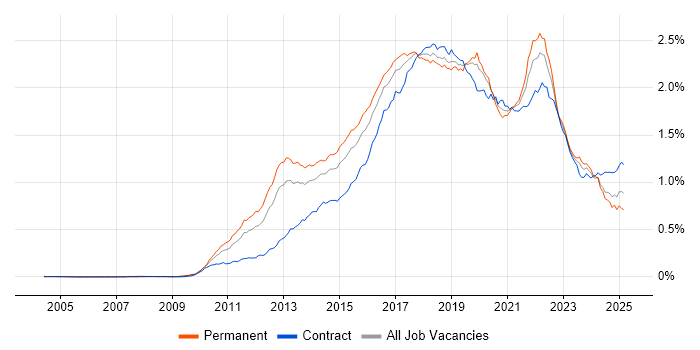
Job vacancy trend for Kanban in the UK

Kanban
Salary Trend

3-month moving average salary quoted in jobs citing Kanban.

Salary trend for Kanban in the UK

Kanban
Salary Histogram

Salary distribution for jobs citing Kanban over the 6 months to 11 May 2025.

Salary histogram for Kanban in the UK

Kanban
Top 16 Job Locations

The table below looks at the demand and provides a guide to the median salaries quoted in IT jobs citing Kanban within the UK over the 6 months to 11 May 2025. The 'Rank Change' column provides an indication of the change in demand within each location based on the same 6 month period last year.

Location Rank Change
on Same Period
Last Year
Matching
Permanent
IT Job Ads
Median Salary
Past 6 Months
Median Salary
% Change
on Same Period
Last Year
Live
Jobs
England -146 373 £65,000 +3.17% 540
UK excluding London -115 256 £58,250 -2.92% 365
Work from Home -130 179 £60,000 -4.00% 365
London +8 156 £80,000 +10.34% 272
South East -30 88 £60,000 +9.09% 127
North of England -121 53 £57,500 -17.86% 122
East of England +4 33 £65,000 +18.18% 40
Midlands -4 31 £48,000 -18.30% 27
South West +5 29 £60,000 - 39
North West -114 29 £57,500 -17.86% 80
West Midlands +9 26 £48,000 -20.00% 15
Yorkshire -5 21 £56,000 -6.67% 36
Scotland +99 14 £59,500 +13.33% 15
Wales +28 8 £52,796 +17.32% 10
East Midlands +26 5 £53,750 +2.38% 11
North East +20 3 £43,848 -37.36% 8

Kanban
Co-occurring Skills and Capabilities by Category

The follow tables expand on the table above by listing co-occurrences grouped by category. The same employment type, locality and period is covered with up to 20 co-occurrences shown in each of the following categories:

Application Platforms
1 34 (8.50%) Confluence
2 13 (3.25%) JBoss
2 13 (3.25%) Red Hat Fuse
3 6 (1.50%) SharePoint
4 5 (1.25%) Apache Spark
5 4 (1.00%) Cloud Foundry
5 4 (1.00%) CMS
6 3 (0.75%) IIS
7 2 (0.50%) Apache
8 1 (0.25%) CICS
8 1 (0.25%) EPiServer
8 1 (0.25%) Microsoft Exchange
8 1 (0.25%) nginx
8 1 (0.25%) WebSphere
8 1 (0.25%) WordPress
Applications
1 15 (3.75%) Microsoft Office
2 11 (2.75%) Microsoft Excel
3 8 (2.00%) Microsoft Project
3 8 (2.00%) MS Visio
4 7 (1.75%) Trello
5 4 (1.00%) Microsoft PowerPoint
6 1 (0.25%) AutoCAD
6 1 (0.25%) Revit
6 1 (0.25%) Simulink
Business Applications
1 9 (2.25%) NetSuite
2 8 (2.00%) Salesforce CRM
3 2 (0.50%) Aladdin
3 2 (0.50%) Endur
3 2 (0.50%) Magento
3 2 (0.50%) Payment Gateway
4 1 (0.25%) Eikon
4 1 (0.25%) RMDS
4 1 (0.25%) Shopify
Cloud Services
1 211 (52.75%) AWS
2 159 (39.75%) Azure
3 75 (18.75%) Amazon EKS
4 73 (18.25%) Serverless
5 55 (13.75%) AWS CloudFormation
6 37 (9.25%) AWS Lambda
7 34 (8.50%) GCP
8 31 (7.75%) SaaS
9 27 (6.75%) Amazon ECS
10 22 (5.50%) Azure DevOps
11 21 (5.25%) Amazon EC2
11 21 (5.25%) Power Platform
12 20 (5.00%) GitHub
13 17 (4.25%) PaaS
14 14 (3.50%) Amazon S3
15 11 (2.75%) IaaS
16 10 (2.50%) Boomi
16 10 (2.50%) Miro
17 9 (2.25%) Amazon CloudWatch
18 8 (2.00%) Amazon SQS
Communications & Networking
1 10 (2.50%) Firewall
2 6 (1.50%) Network Security
3 2 (0.50%) Intrusion Detection
4 1 (0.25%) BGP
4 1 (0.25%) Cisco ASA
4 1 (0.25%) Cisco IOS
4 1 (0.25%) Cisco ISE
4 1 (0.25%) Cisco Nexus
4 1 (0.25%) DNS
4 1 (0.25%) EIGRP
4 1 (0.25%) FCoE
4 1 (0.25%) Internet
4 1 (0.25%) NX-OS
4 1 (0.25%) SD-WAN
4 1 (0.25%) Value-Added Service
4 1 (0.25%) VPN
4 1 (0.25%) WAN
4 1 (0.25%) Wireless
Database & Business Intelligence
1 64 (16.00%) Elasticsearch
2 52 (13.00%) PostgreSQL
3 44 (11.00%) Relational Database
4 39 (9.75%) DynamoDB
5 29 (7.25%) SQL Server
6 24 (6.00%) MongoDB
6 24 (6.00%) NoSQL
7 21 (5.25%) Power BI
8 17 (4.25%) Azure SQL Database
9 16 (4.00%) RDBMS
10 11 (2.75%) Amazon RDS
11 9 (2.25%) MySQL
12 6 (1.50%) Apache Cassandra
12 6 (1.50%) Couchbase
13 5 (1.25%) Amazon Aurora
13 5 (1.25%) Big Data
14 4 (1.00%) Power Query
14 4 (1.00%) Redis
15 3 (0.75%) Data Warehouse
15 3 (0.75%) Tableau
Development Applications
1 82 (20.50%) JIRA
2 58 (14.50%) Git
3 54 (13.50%) Jenkins
4 43 (10.75%) JUnit
5 31 (7.75%) JMeter
6 20 (5.00%) Mockito
7 15 (3.75%) GitLab
8 14 (3.50%) Selenium
9 11 (2.75%) Cypress.io
10 9 (2.25%) Gatling
10 9 (2.25%) Postman
10 9 (2.25%) SonarQube
11 8 (2.00%) Maven
12 7 (1.75%) DbUnit
12 7 (1.75%) jMock
12 7 (1.75%) REST Assured
13 6 (1.50%) Burp Suite
14 5 (1.25%) Visual Studio
15 4 (1.00%) TestCafe
15 4 (1.00%) TestNG
General
1 116 (29.00%) Social Skills
2 80 (20.00%) Analytical Skills
3 68 (17.00%) Finance
4 55 (13.75%) Inclusion and Diversity
5 53 (13.25%) Public Sector
6 18 (4.50%) Banking
6 18 (4.50%) Retail
7 15 (3.75%) Marketing
8 10 (2.50%) Presentation Skills
9 8 (2.00%) Back Office
10 7 (1.75%) Manufacturing
10 7 (1.75%) Telecoms
11 6 (1.50%) Advertising
12 5 (1.25%) Publishing
13 4 (1.00%) Front Office
13 4 (1.00%) Games
13 4 (1.00%) iGaming
13 4 (1.00%) Organisational Skills
14 3 (0.75%) Aerospace
14 3 (0.75%) Electronics
Job Titles
1 177 (44.25%) Developer
2 94 (23.50%) Senior
3 72 (18.00%) Software Developer
4 53 (13.25%) Senior Developer
5 37 (9.25%) Java Developer
6 29 (7.25%) Architect
7 27 (6.75%) .NET Developer
7 27 (6.75%) Software Engineer
8 26 (6.50%) Lead
9 21 (5.25%) Analyst
9 21 (5.25%) Delivery Manager
9 21 (5.25%) Senior Software Developer
10 20 (5.00%) Full-Stack Developer
11 18 (4.50%) Solutions Architect
12 17 (4.25%) Product Owner
13 13 (3.25%) Project Manager
14 12 (3.00%) Agile Delivery Manager
15 11 (2.75%) Senior Analyst
15 11 (2.75%) Senior Full-Stack Developer
16 9 (2.25%) Business Analyst
Libraries, Frameworks & Software Standards
1 107 (26.75%) Node.js
2 101 (25.25%) .NET
3 71 (17.75%) React
4 56 (14.00%) REST
5 49 (12.25%) Pandas
6 48 (12.00%) RESTful
7 45 (11.25%) Web Services
8 44 (11.00%) GraphQL
9 40 (10.00%) HTML
10 38 (9.50%) Spring
11 37 (9.25%) Spring Boot
12 31 (7.75%) .NET Core
12 31 (7.75%) AngularJS
13 27 (6.75%) Apache Camel
13 27 (6.75%) CSS
14 23 (5.75%) ASP.NET Web API
14 23 (5.75%) SOAP
15 22 (5.50%) ActiveMQ
16 21 (5.25%) Hibernate
17 16 (4.00%) ASP.NET
Miscellaneous
1 49 (12.25%) Cyberattack
2 41 (10.25%) Product Ownership
3 35 (8.75%) Distributed Systems
4 16 (4.00%) Cloud Native
5 13 (3.25%) Mobile App
6 11 (2.75%) Virtual Team
7 10 (2.50%) Private Cloud
8 8 (2.00%) Data Structures
8 8 (2.00%) Management Information System
9 7 (1.75%) Public Cloud
10 5 (1.25%) PKI
10 5 (1.25%) PMI
10 5 (1.25%) Social Media
11 4 (1.00%) Data Centre
11 4 (1.00%) IVR
11 4 (1.00%) Legacy Systems
11 4 (1.00%) Mobile Games
11 4 (1.00%) Self-Motivation
11 4 (1.00%) Sports Betting
12 3 (0.75%) Distributed Architecture
Operating Systems
1 69 (17.25%) Linux
2 50 (12.50%) Android
3 4 (1.00%) Windows
4 2 (0.50%) Unix
4 2 (0.50%) Windows Server
5 1 (0.25%) Apple iOS
5 1 (0.25%) Debian
5 1 (0.25%) Mac OS
5 1 (0.25%) Red Hat Enterprise Linux
Processes & Methodologies
1 352 (88.00%) Agile
2 269 (67.25%) Scrum
3 161 (40.25%) CI/CD
4 120 (30.00%) Microservices
5 110 (27.50%) DevOps
6 107 (26.75%) Software Engineering
7 84 (21.00%) Containerisation
7 84 (21.00%) Secure Coding
8 83 (20.75%) Collaborative Working
9 73 (18.25%) Full-Stack Development
10 69 (17.25%) Problem-Solving
11 67 (16.75%) TDD
12 65 (16.25%) Continuous Improvement
12 65 (16.25%) OOP
13 63 (15.75%) Design Patterns
13 63 (15.75%) Test Automation
14 61 (15.25%) BDD
14 61 (15.25%) OO
15 59 (14.75%) Project Management
16 57 (14.25%) OWASP
Programming Languages
1 117 (29.25%) Java
1 117 (29.25%) JavaScript
2 108 (27.00%) Python
3 85 (21.25%) SQL
4 66 (16.50%) TypeScript
5 61 (15.25%) C#
6 59 (14.75%) Go
7 52 (13.00%) C++
8 49 (12.25%) Rust
9 16 (4.00%) Shell Script
10 6 (1.50%) Bash
10 6 (1.50%) PowerShell
10 6 (1.50%) Scala
11 3 (0.75%) Ruby
12 2 (0.50%) PL/SQL
12 2 (0.50%) T-SQL
13 1 (0.25%) Ada
13 1 (0.25%) MATLAB
13 1 (0.25%) PHP
13 1 (0.25%) SPARQL
Qualifications
1 118 (29.50%) Security Cleared
2 68 (17.00%) DV Cleared
3 55 (13.75%) SC Cleared
4 42 (10.50%) Degree
5 16 (4.00%) Computer Science Degree
6 15 (3.75%) ISTQB
7 11 (2.75%) Azure Certification
8 10 (2.50%) ISTQB Foundation Certification
9 7 (1.75%) AWS Certification
9 7 (1.75%) BPSS Clearance
10 6 (1.50%) PMI Certification
11 5 (1.25%) Master's Degree
12 4 (1.00%) CSPO
12 4 (1.00%) PMP
13 3 (0.75%) AWS Certified Solutions Architect
13 3 (0.75%) CISSP
13 3 (0.75%) TOGAF Certification
14 2 (0.50%) Postgraduate
15 1 (0.25%) Microsoft Certification
15 1 (0.25%) PRINCE2 Certification
Quality Assurance & Compliance
1 26 (6.50%) QA
2 13 (3.25%) SLA
3 9 (2.25%) Accessibility
4 7 (1.75%) GDPR
5 3 (0.75%) PCI DSS
6 2 (0.50%) EMIR
6 2 (0.50%) GxP
6 2 (0.50%) ISO 20022
6 2 (0.50%) MiFID
6 2 (0.50%) PMO
6 2 (0.50%) SEPA
6 2 (0.50%) WCAG
7 1 (0.25%) Cyber Essentials
7 1 (0.25%) Data Quality
7 1 (0.25%) DO-254
7 1 (0.25%) ISO/IEC 27001
System Software
1 120 (30.00%) Docker
2 4 (1.00%) Active Directory
2 4 (1.00%) Postfix
2 4 (1.00%) VMware Infrastructure
3 3 (0.75%) Hyper-V
3 3 (0.75%) vSphere
4 1 (0.25%) Firmware
4 1 (0.25%) RACF
4 1 (0.25%) VMware ESXi
Systems Management
1 114 (28.50%) Kubernetes
2 76 (19.00%) Terraform
3 75 (18.75%) Ansible
4 17 (4.25%) Kibana
5 11 (2.75%) Grafana
6 9 (2.25%) Single Sign-On
7 6 (1.50%) Puppet
8 5 (1.25%) Progress Chef
8 5 (1.25%) Prometheus
9 4 (1.00%) Microsoft Intune
10 3 (0.75%) Argo
10 3 (0.75%) HP Quality Center
11 2 (0.50%) Kustomize
12 1 (0.25%) Istio
12 1 (0.25%) Jamf Pro
12 1 (0.25%) SCCM
12 1 (0.25%) vCenter Server
Vendors
1 47 (11.75%) Microsoft
2 19 (4.75%) Google
3 18 (4.50%) Splunk
4 16 (4.00%) Oracle
5 14 (3.50%) Salesforce
6 13 (3.25%) Dynatrace
7 10 (2.50%) MuleSoft
7 10 (2.50%) VMware
8 8 (2.00%) Atlassian
9 7 (1.75%) IBM
10 5 (1.25%) CA Agile Central
10 5 (1.25%) Databricks
11 3 (0.75%) Adobe
11 3 (0.75%) Bloomberg
11 3 (0.75%) Murex
11 3 (0.75%) Red Hat
12 2 (0.50%) Calypso
12 2 (0.50%) Charles River
12 2 (0.50%) OpenLink
12 2 (0.50%) SAP