Manufacturing
UK

The table below looks at the prevalence of the term Manufacturing in permanent job vacancies. Included is a benchmarking guide to the salaries offered in vacancies that have cited Manufacturing over the 6 months to 26 April 2024 with a comparison to the same period over the previous 2 years.

6 months to
26 Apr 2024
Same period 2023 Same period 2022
Rank 65 150 141
Rank change year-on-year +85 -9 +4
Permanent jobs citing Manufacturing 3,726 2,540 4,452
As % of all permanent jobs advertised in the UK 3.80% 2.42% 2.89%
As % of the General category 6.34% 3.53% 4.55%
Number of salaries quoted 2,378 1,256 2,253
10th Percentile £27,044 £29,250 £29,750
25th Percentile £33,500 £41,250 £37,500
Median annual salary (50th Percentile) £45,000 £55,000 £50,500
Median % change year-on-year -18.18% +8.91% -3.81%
75th Percentile £60,000 £72,500 £65,000
90th Percentile £75,750 £87,500 £85,000
UK excluding London median annual salary £45,000 £50,000 £46,500
% change year-on-year -10.00% +7.53% +3.33%

All General Skills
UK

Manufacturing is in the General Skills category. The following table is for comparison with the above and provides summary statistics for all permanent job vacancies with a requirement for common skills.

Permanent vacancies with a requirement for common skills 58,747 72,001 97,948
As % of all permanent jobs advertised in the UK 59.84% 68.71% 63.55%
Number of salaries quoted 39,559 38,660 51,043
10th Percentile £27,500 £32,500 £32,500
25th Percentile £36,250 £43,750 £42,500
Median annual salary (50th Percentile) £52,500 £60,000 £60,000
Median % change year-on-year -12.50% - +9.09%
75th Percentile £72,500 £82,500 £80,000
90th Percentile £92,500 £102,000 £97,500
UK excluding London median annual salary £47,500 £52,500 £50,000
% change year-on-year -9.52% +5.00% +5.26%

Manufacturing
Job Vacancy Trend

Job postings citing Manufacturing as a proportion of all IT jobs advertised.
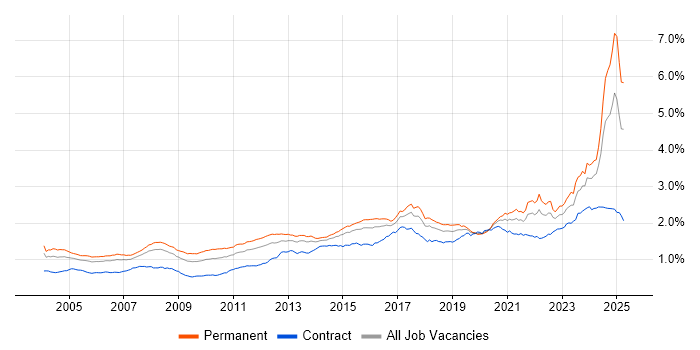
Job vacancy trend for Manufacturing in the UK

Manufacturing
Salary Trend

3-month moving average salary quoted in jobs citing Manufacturing.

Salary trend for Manufacturing in the UK

Manufacturing
Salary Histogram

Salary distribution for jobs citing Manufacturing over the 6 months to 26 April 2024.

Salary histogram for Manufacturing in the UK

Manufacturing
Top 17 Job Locations

The table below looks at the demand and provides a guide to the median salaries quoted in IT jobs citing Manufacturing within the UK over the 6 months to 26 April 2024. The 'Rank Change' column provides an indication of the change in demand within each location based on the same 6 month period last year.

Location Rank Change
on Same Period
Last Year
Matching
Permanent
IT Job Ads
Median Salary
Past 6 Months
Median Salary
% Change
on Same Period
Last Year
Live
Jobs
UK excluding London +60 3,324 £45,000 -10.00% 3,106
England +83 3,224 £45,000 -18.18% 3,139
South East +56 792 £42,300 -15.40% 649
North of England +92 786 £45,000 -2.17% 744
Work from Home +50 755 £54,000 -1.82% 636
Midlands +13 688 £45,000 -18.18% 696
West Midlands +7 421 £45,000 -28.00% 425
South West +39 374 £42,500 -19.05% 417
North West +75 359 £47,500 - 378
Yorkshire +110 342 £42,500 - 286
East of England +127 307 £51,250 -6.82% 406
East Midlands +29 260 £42,500 -5.56% 271
London +67 235 £70,000 +3.70% 251
Wales +98 180 £35,000 +12.00% 141
Scotland +4 142 £47,500 -2.56% 166
North East +37 85 £42,500 +21.43% 110
Northern Ireland +57 56 £35,000 -6.67% 31

Manufacturing
Co-occurring Skills and Capabilities by Category

The follow tables expand on the table above by listing co-occurrences grouped by category. The same employment type, locality and period is covered with up to 20 co-occurrences shown in each of the following categories:

Application Platforms
1 137 (3.68%) SharePoint
2 69 (1.85%) Microsoft Exchange
3 19 (0.51%) Confluence
4 13 (0.35%) IIS
5 10 (0.27%) Documentum
6 7 (0.19%) Apache
7 6 (0.16%) CMS
7 6 (0.16%) nginx
8 5 (0.13%) SAS
9 4 (0.11%) Jupyter
9 4 (0.11%) Tomcat
9 4 (0.11%) WebSphere
9 4 (0.11%) WordPress
10 3 (0.081%) Anypoint
10 3 (0.081%) Apache Spark
10 3 (0.081%) Drupal
10 3 (0.081%) JBoss
11 2 (0.054%) Resin
11 2 (0.054%) WebLogic
11 2 (0.054%) WildFly
Applications
1 166 (4.46%) Microsoft Office
2 132 (3.54%) Microsoft Excel
3 50 (1.34%) Microsoft PowerPoint
4 49 (1.32%) Microsoft Project
5 35 (0.94%) AutoCAD
6 22 (0.59%) SOLIDWORKS
7 13 (0.35%) Simulink
8 11 (0.30%) OrCAD
9 10 (0.27%) Adobe Illustrator
9 10 (0.27%) Photoshop
9 10 (0.27%) Solid Edge
10 9 (0.24%) MS Visio
10 9 (0.24%) Siemens NX
11 8 (0.21%) EPLAN
12 7 (0.19%) Revit
13 5 (0.13%) CANalyzer
14 4 (0.11%) Doxygen
14 4 (0.11%) Fusion 360
14 4 (0.11%) InfoPath
15 3 (0.081%) InDesign
Business Applications
1 55 (1.48%) SAP S/4HANA
2 43 (1.15%) Dynamics CRM
3 41 (1.10%) Dynamics NAV
4 27 (0.72%) NetSuite
4 27 (0.72%) SAP PP
5 17 (0.46%) SAP IBP
6 14 (0.38%) SAP QM
7 13 (0.35%) SAP CO
7 13 (0.35%) SAP FI
7 13 (0.35%) SAP FI/CO
8 12 (0.32%) Sage X3
9 11 (0.30%) Oracle EBS
9 11 (0.30%) SAP Oil and Gas
9 11 (0.30%) SAP SCM
9 11 (0.30%) Teamcenter
10 10 (0.27%) TrackWise
11 9 (0.24%) Sage 200
12 8 (0.21%) Dynamics AX
12 8 (0.21%) Dynamics GP
12 8 (0.21%) Infor CloudSuite Industrial (formerly SyteLine)
Cloud Services
1 266 (7.14%) Azure
2 265 (7.11%) Microsoft 365
3 166 (4.46%) Power Platform
4 128 (3.44%) Dynamics 365
5 77 (2.07%) AWS
6 67 (1.80%) SaaS
7 64 (1.72%) Entra ID
8 45 (1.21%) Azure DevOps
9 41 (1.10%) PowerApps
10 32 (0.86%) OneDrive
11 30 (0.81%) Power Automate
12 26 (0.70%) Cloud Computing
13 22 (0.59%) GitHub
14 19 (0.51%) Serverless
15 13 (0.35%) Azure Data Factory
16 12 (0.32%) PaaS
17 10 (0.27%) WhatsApp
18 9 (0.24%) GCP
19 7 (0.19%) Azure Event Grid
19 7 (0.19%) Azure Service Bus
Communications & Networking
1 90 (2.42%) Firewall
2 87 (2.33%) Wireless
3 63 (1.69%) Ethernet
4 62 (1.66%) Wi-Fi
5 48 (1.29%) LAN
6 40 (1.07%) WAN
7 35 (0.94%) DNS
7 35 (0.94%) RS-232
7 35 (0.94%) TCP/IP
8 33 (0.89%) Internet
9 29 (0.78%) HTTP
10 28 (0.75%) Network Security
10 28 (0.75%) VPN
11 27 (0.72%) LTE
12 22 (0.59%) DHCP
13 21 (0.56%) SAN
14 17 (0.46%) MQTT
14 17 (0.46%) VLAN
15 15 (0.40%) 4G
15 15 (0.40%) Intranet
Database & Business Intelligence
1 151 (4.05%) SQL Server
2 135 (3.62%) Power BI
3 47 (1.26%) PostgreSQL
4 42 (1.13%) MySQL
5 36 (0.97%) SQL Server Reporting Services
6 30 (0.81%) MongoDB
7 28 (0.75%) Data Warehouse
8 24 (0.64%) Tableau
9 22 (0.59%) Relational Database
10 18 (0.48%) SQLite
11 14 (0.38%) Crystal Reports
11 14 (0.38%) MS Access
12 13 (0.35%) SQL Server Integration Services
13 12 (0.32%) Redis
14 10 (0.27%) Amazon RDS
14 10 (0.27%) Power Query
15 9 (0.24%) SQL Server Analysis Services
16 6 (0.16%) GIS
16 6 (0.16%) Metadata
16 6 (0.16%) SAP BW
Development Applications
1 119 (3.19%) Git
2 58 (1.56%) JIRA
3 51 (1.37%) LabVIEW
4 45 (1.21%) Visual Studio
5 24 (0.64%) Subversion
6 17 (0.46%) Jenkins
7 13 (0.35%) Eclipse
7 13 (0.35%) GitLab
8 10 (0.27%) Rational DOORS
9 7 (0.19%) CANoe
9 7 (0.19%) TeamCity
10 6 (0.16%) Maven
11 5 (0.13%) Octopus Deploy
11 5 (0.13%) Selenium
12 4 (0.11%) Bitbucket
12 4 (0.11%) Postman
12 4 (0.11%) Visual Studio Code
12 4 (0.11%) WebDriver
12 4 (0.11%) Zephyr
13 3 (0.081%) TestNG
General
1 1,035 (27.78%) Social Skills
2 642 (17.23%) Finance
3 520 (13.96%) Electronics
4 418 (11.22%) Analytical Skills
5 290 (7.78%) Marketing
6 284 (7.62%) Pharmaceutical
7 240 (6.44%) Retail
8 229 (6.15%) Aerospace
9 223 (5.98%) Telecoms
10 206 (5.53%) Public Sector
11 203 (5.45%) Automotive
12 188 (5.05%) Inclusion and Diversity
13 174 (4.67%) Influencing Skills
14 172 (4.62%) Presentation Skills
15 167 (4.48%) Law
16 120 (3.22%) Legal
17 92 (2.47%) Organisational Skills
18 44 (1.18%) Games
19 40 (1.07%) Military
20 33 (0.89%) Advertising
Job Titles
1 346 (9.29%) Senior
2 270 (7.25%) Analyst
3 257 (6.90%) Developer
4 255 (6.84%) Graduate
5 239 (6.41%) Project Manager
6 238 (6.39%) Software Engineer
7 233 (6.25%) Lead
8 197 (5.29%) Systems Engineer
9 174 (4.67%) IT Engineer
10 155 (4.16%) Electronics Engineer
11 145 (3.89%) Consultant
12 129 (3.46%) Support Engineer
13 127 (3.41%) Automation Engineer
14 120 (3.22%) IT Graduate
15 116 (3.11%) IT Support
16 115 (3.09%) Graduate IT Engineer
17 113 (3.03%) Embedded Engineer
18 105 (2.82%) Architect
19 104 (2.79%) Junior
20 101 (2.71%) Technical Support
Libraries, Frameworks & Software Standards
1 133 (3.57%) .NET
2 84 (2.25%) HTML
3 54 (1.45%) CSS
4 50 (1.34%) React
5 49 (1.32%) ASP.NET
6 45 (1.21%) .NET Framework
7 36 (0.97%) RESTful
8 34 (0.91%) AngularJS
9 27 (0.72%) .NET Core
10 26 (0.70%) WPF
10 26 (0.70%) Yocto
11 24 (0.64%) Django
12 22 (0.59%) Flask
13 20 (0.54%) Blazor
14 19 (0.51%) Entity Framework
14 19 (0.51%) Node.js
15 18 (0.48%) ASP.NET MVC
15 18 (0.48%) XML
16 16 (0.43%) YAML
17 14 (0.38%) HTML5
Miscellaneous
1 245 (6.58%) FMCG
2 219 (5.88%) Management Information System
3 125 (3.35%) Self-Motivation
4 87 (2.33%) IoT
5 83 (2.23%) Driving Licence
6 68 (1.83%) Operational Technology
7 60 (1.61%) Embedded Systems
8 53 (1.42%) Data Centre
9 50 (1.34%) Life Science
10 49 (1.32%) Analytical Mindset
11 41 (1.10%) Algorithms
12 39 (1.05%) Industrial Internet of Things
13 36 (0.97%) Renewable Energy
14 32 (0.86%) Onboarding
15 31 (0.83%) FPGA
15 31 (0.83%) Robotics
16 29 (0.78%) Biopharmaceutical
17 28 (0.75%) PMI
18 26 (0.70%) Analogue Electronics
18 26 (0.70%) SCADA
Operating Systems
1 282 (7.57%) Windows
2 182 (4.88%) Linux
3 98 (2.63%) Windows Server
4 73 (1.96%) Windows 10
5 35 (0.94%) Android
6 26 (0.70%) Embedded Linux
7 22 (0.59%) Apple iOS
8 18 (0.48%) FreeRTOS
9 17 (0.46%) Windows Server 2019
10 14 (0.38%) VMS
11 13 (0.35%) Windows Server 2012
12 11 (0.30%) Windows Server 2016
13 10 (0.27%) Mac OS
14 8 (0.21%) Debian
15 5 (0.13%) Windows 7
16 4 (0.11%) Red Hat Enterprise Linux
16 4 (0.11%) Ubuntu
16 4 (0.11%) VxWorks
17 3 (0.081%) CatOS
18 2 (0.054%) Windows Embedded Compact
Processes & Methodologies
1 703 (18.87%) Problem-Solving
2 541 (14.52%) ERP
3 428 (11.49%) Project Management
4 359 (9.63%) Software Engineering
5 358 (9.61%) Continuous Improvement
6 336 (9.02%) Business Intelligence
7 262 (7.03%) Agile
8 254 (6.82%) Computer Science
9 209 (5.61%) Programme Management
10 184 (4.94%) Mentoring
11 179 (4.80%) Digital Marketing
12 176 (4.72%) QMS
13 171 (4.59%) Logistics
14 165 (4.43%) Customer Service
15 156 (4.19%) Change Management
16 154 (4.13%) Coaching
16 154 (4.13%) Six Sigma
17 150 (4.03%) Validation
18 141 (3.78%) Project Delivery
19 135 (3.62%) Lean Six Sigma
Programming Languages
1 399 (10.71%) SQL
2 243 (6.52%) C#
3 219 (5.88%) C
4 208 (5.58%) Python
5 130 (3.49%) JavaScript
6 123 (3.30%) C++
7 59 (1.58%) Java
8 56 (1.50%) Embedded C
9 49 (1.32%) PowerShell
10 45 (1.21%) T-SQL
11 43 (1.15%) TypeScript
12 36 (0.97%) Bash
13 30 (0.81%) PHP
14 22 (0.59%) XAML
15 21 (0.56%) VB
15 21 (0.56%) VBA
16 20 (0.54%) MATLAB
16 20 (0.54%) VB.NET
17 12 (0.32%) Data Analysis Expressions
17 12 (0.32%) R
Qualifications
1 1,086 (29.15%) Degree
2 160 (4.29%) Security Cleared
3 129 (3.46%) Computer Science Degree
4 116 (3.11%) Six Sigma Yellow Belt
5 80 (2.15%) Master's Degree
6 74 (1.99%) HNC
6 74 (1.99%) HND
7 56 (1.50%) SC Cleared
8 44 (1.18%) Microsoft Certification
9 43 (1.15%) BPSS Clearance
10 34 (0.91%) PMI Certification
11 33 (0.89%) Cisco Certification
12 31 (0.83%) CISSP
13 26 (0.70%) CCNA
14 16 (0.43%) CISA
15 14 (0.38%) Azure Certification
16 13 (0.35%) CISM
16 13 (0.35%) DV Cleared
16 13 (0.35%) MCSE
17 12 (0.32%) PMP
Quality Assurance & Compliance
1 463 (12.43%) QA
2 199 (5.34%) GMP
3 47 (1.26%) ISO 9001
4 43 (1.15%) PMO
5 42 (1.13%) SLA
6 31 (0.83%) ISO/IEC 27001
7 28 (0.75%) GDPR
8 20 (0.54%) Accessibility
9 19 (0.51%) ISO 13485
10 14 (0.38%) ISO 14001
10 14 (0.38%) ISO 26262
11 13 (0.35%) Cyber Essentials
11 13 (0.35%) NIST
12 12 (0.32%) GxP
13 11 (0.30%) Data Quality
13 11 (0.30%) Good Clinical Practice
14 10 (0.27%) Sarbanes-Oxley
15 8 (0.21%) PCI DSS
16 6 (0.16%) GAMP
16 6 (0.16%) HIPAA
System Software
1 184 (4.94%) Firmware
2 167 (4.48%) Active Directory
3 118 (3.17%) Embedded Firmware
4 49 (1.32%) VMware Infrastructure
5 46 (1.23%) Hyper-V
6 31 (0.83%) Docker
7 14 (0.38%) Virtual Machines
8 10 (0.27%) Virtual Servers
9 6 (0.16%) VMware ESXi
10 4 (0.11%) Terminal Services
10 4 (0.11%) VMware Server
11 3 (0.081%) KVM
11 3 (0.081%) NFS
12 2 (0.054%) vSphere
13 1 (0.027%) Microsoft Virtual Server
13 1 (0.027%) VMware NSX
Systems Management
1 22 (0.59%) Microsoft Intune
2 19 (0.51%) Terraform
3 11 (0.30%) Kubernetes
4 8 (0.21%) SCCM
5 7 (0.19%) FortiGate
5 7 (0.19%) Functional Safety
6 5 (0.13%) WSUS
7 4 (0.11%) Active Directory Federation Services
7 4 (0.11%) Puppet
8 3 (0.081%) Ansible
8 3 (0.081%) Progress Chef
8 3 (0.081%) vCenter Server
9 2 (0.054%) Nessus
10 1 (0.027%) systemd
Vendors
1 543 (14.57%) Microsoft
2 388 (10.41%) SAP
3 104 (2.79%) EMC
4 103 (2.76%) VMware
5 74 (1.99%) Oracle
6 73 (1.96%) IFS
7 45 (1.21%) Sage
8 38 (1.02%) Google
9 34 (0.91%) Epicor
10 33 (0.89%) Cisco
10 33 (0.89%) Siemens
10 33 (0.89%) Veeam
11 19 (0.51%) HP
11 19 (0.51%) Salesforce
11 19 (0.51%) Workday
12 18 (0.48%) Citrix
12 18 (0.48%) IBM
13 14 (0.38%) Aruba
14 12 (0.32%) Adobe
15 10 (0.27%) BT