Virtual Team (including Distributed Team, Remote Team, Dispersed Team)
UK

The table below looks at the prevalence of the term Virtual Team in permanent job vacancies. Included is a benchmarking guide to the salaries offered in vacancies that have cited Virtual Team over the 6 months to 5 May 2024 with a comparison to the same period over the previous 2 years.

6 months to
5 May 2024
Same period 2023 Same period 2022
Rank 441 212 197
Rank change year-on-year -229 -15 +137
Permanent jobs citing Virtual Team 544 1,850 3,247
As % of all permanent jobs advertised in the UK 0.55% 1.79% 2.07%
As % of the Miscellaneous category 1.56% 4.19% 4.38%
Number of salaries quoted 323 534 1,332
10th Percentile £42,500 £38,250 £45,000
25th Percentile £50,000 £56,250 £57,500
Median annual salary (50th Percentile) £65,000 £64,000 £70,000
Median % change year-on-year +1.56% -8.57% +12.00%
75th Percentile £87,500 £83,750 £95,000
90th Percentile £119,000 £102,105 £96,125
UK excluding London median annual salary £57,500 £60,800 £70,000
% change year-on-year -5.43% -13.14% +21.74%

All Generic Skills
UK

Virtual Team is in the General and Transferable Skills category. The following table is for comparison with the above and provides summary statistics for all permanent job vacancies with a requirement for generic IT skills.

Permanent vacancies with a requirement for generic IT skills 34,939 44,188 74,195
As % of all permanent jobs advertised in the UK 35.46% 42.71% 47.36%
Number of salaries quoted 23,008 23,913 34,286
10th Percentile £28,000 £35,001 £34,500
25th Percentile £38,000 £46,250 £45,750
Median annual salary (50th Percentile) £55,000 £65,000 £62,500
Median % change year-on-year -15.38% +4.00% +4.17%
75th Percentile £75,000 £86,250 £84,056
90th Percentile £97,500 £107,500 £102,500
UK excluding London median annual salary £50,000 £55,000 £52,500
% change year-on-year -9.09% +4.76% +5.00%

Virtual Team
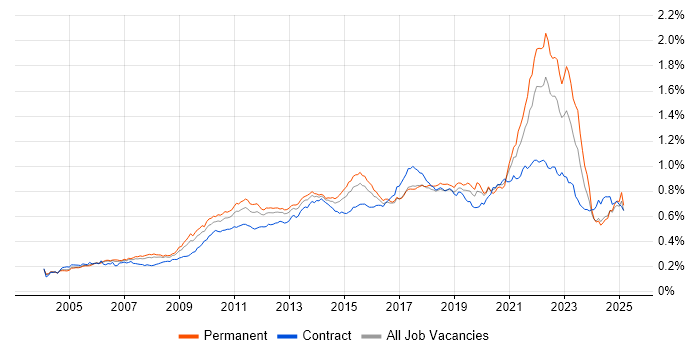
Job Vacancy Trend

Job postings citing Virtual Team as a proportion of all IT jobs advertised.

Job vacancy trend for Virtual Team in the UK

Virtual Team
Salary Trend

3-month moving average salary quoted in jobs citing Virtual Team.

Salary trend for Virtual Team in the UK

Virtual Team
Salary Histogram

Salary distribution for jobs citing Virtual Team over the 6 months to 5 May 2024.

Salary histogram for Virtual Team in the UK

Virtual Team
Top 17 Job Locations

The table below looks at the demand and provides a guide to the median salaries quoted in IT jobs citing Virtual Team within the UK over the 6 months to 5 May 2024. The 'Rank Change' column provides an indication of the change in demand within each location based on the same 6 month period last year.

Location Rank Change
on Same Period
Last Year
Matching
Permanent
IT Job Ads
Median Salary
Past 6 Months
Median Salary
% Change
on Same Period
Last Year
Live
Jobs
England -227 440 £62,500 -3.85% 228
UK excluding London -292 305 £57,500 -5.43% 105
Work from Home +34 297 £60,000 -14.29% 121
London -76 187 £80,000 +1.59% 115
Midlands +7 74 £57,500 +4.55% 16
West Midlands +49 60 £57,500 -5.43% 6
North of England -107 53 £55,000 -9.54% 19
South West -29 50 £51,250 -15.84% 15
South East -190 50 £60,000 -7.69% 34
Scotland -148 46 £75,000 +23.36% 5
North West -54 32 £57,500 -5.43% 12
Yorkshire -11 15 £55,000 -9.54% 7
Wales -60 15 £60,000 +4.35% 2
East Midlands -49 12 £82,500 +57.14% 10
East of England -113 12 £48,900 -11.73% 13
North East -10 6 £55,000 -9.69%
Northern Ireland +7 5 - - 1

Virtual Team
Co-occurring Skills and Capabilities by Category

The follow tables expand on the table above by listing co-occurrences grouped by category. The same employment type, locality and period is covered with up to 20 co-occurrences shown in each of the following categories:

Application Platforms
1 27 (4.96%) Microsoft Exchange
2 18 (3.31%) SharePoint
3 12 (2.21%) Confluence
4 7 (1.29%) Apache
5 4 (0.74%) Adobe Experience Manager
5 4 (0.74%) CMS
6 2 (0.37%) Apache Spark
6 2 (0.37%) ArcGIS
6 2 (0.37%) Jupyter
6 2 (0.37%) nginx
6 2 (0.37%) Tomcat
6 2 (0.37%) WordPress
7 1 (0.18%) Apache Airflow
7 1 (0.18%) Apache Pulsar
7 1 (0.18%) Drupal
7 1 (0.18%) NServiceBus
7 1 (0.18%) Oracle SOA Suite
7 1 (0.18%) SAS
Applications
1 20 (3.68%) Microsoft Excel
2 19 (3.49%) Microsoft PowerPoint
3 7 (1.29%) Microsoft Office
3 7 (1.29%) Microsoft Project
3 7 (1.29%) MS Visio
4 2 (0.37%) Photoshop
4 2 (0.37%) Trello
5 1 (0.18%) Blender
5 1 (0.18%) Chatbot
Business Applications
1 22 (4.04%) Dynamics CRM
2 17 (3.13%) SAP S/4HANA
3 11 (2.02%) Endur
4 9 (1.65%) SAP CO
4 9 (1.65%) SAP FI
4 9 (1.65%) SAP FI/CO
5 8 (1.47%) Dynamics NAV
5 8 (1.47%) OpenLink RightAngle
6 4 (0.74%) SAP CRM
6 4 (0.74%) SAP CX
6 4 (0.74%) SAP GTS
6 4 (0.74%) SAP SD
6 4 (0.74%) SAP WM
7 2 (0.37%) Oracle ERP
7 2 (0.37%) SAP SCM
8 1 (0.18%) SAP ERP
8 1 (0.18%) SAP MM
8 1 (0.18%) SAP PM
8 1 (0.18%) Workday HCM
Cloud Services
1 103 (18.93%) Azure
2 81 (14.89%) AWS
3 45 (8.27%) Azure DevOps
4 44 (8.09%) Power Platform
5 36 (6.62%) SaaS
6 34 (6.25%) Microsoft 365
7 23 (4.23%) GCP
7 23 (4.23%) GitHub
8 22 (4.04%) Dynamics 365
9 20 (3.68%) Serverless
10 18 (3.31%) AWS Lambda
11 16 (2.94%) Power Automate
12 15 (2.76%) GitHub Actions
13 14 (2.57%) PowerApps
14 7 (1.29%) Amazon EKS
14 7 (1.29%) Entra ID
14 7 (1.29%) Firebase
15 6 (1.10%) IaaS
15 6 (1.10%) PaaS
16 5 (0.92%) Amazon S3
Communications & Networking
1 19 (3.49%) Firewall
2 17 (3.13%) Network Security
3 13 (2.39%) BGP
3 13 (2.39%) DNS
3 13 (2.39%) OSPF
4 12 (2.21%) WAN
5 9 (1.65%) DHCP
6 8 (1.47%) VPN
6 8 (1.47%) Wireless
7 7 (1.29%) LAN
7 7 (1.29%) Multicast
8 5 (0.92%) MPLS
8 5 (0.92%) SD-WAN
8 5 (0.92%) WLAN
9 4 (0.74%) Internet
9 4 (0.74%) IPsec
9 4 (0.74%) PBX
9 4 (0.74%) VoIP
10 3 (0.55%) Ethernet VPN
10 3 (0.55%) VXLAN
Database & Business Intelligence
1 39 (7.17%) SQL Server
2 28 (5.15%) Power BI
3 21 (3.86%) Relational Database
4 16 (2.94%) RDBMS
5 10 (1.84%) MySQL
6 6 (1.10%) NoSQL
6 6 (1.10%) Tableau
7 5 (0.92%) Metadata
8 4 (0.74%) Azure SQL Database
8 4 (0.74%) Data Lake
8 4 (0.74%) Data Warehouse
8 4 (0.74%) PostgreSQL
8 4 (0.74%) Redis
9 3 (0.55%) Azure SQL Data Warehouse
9 3 (0.55%) Big Data
9 3 (0.55%) BigQuery
9 3 (0.55%) GIS
9 3 (0.55%) Jackrabbit
10 2 (0.37%) Apache Pinot
10 2 (0.37%) Spatial Data
Development Applications
1 59 (10.85%) Git
2 22 (4.04%) Jenkins
3 20 (3.68%) JIRA
4 11 (2.02%) Maven
5 10 (1.84%) CircleCI
6 9 (1.65%) git-flow
7 8 (1.47%) Selenium
8 7 (1.29%) GitLab
9 6 (1.10%) Crashlytics
9 6 (1.10%) Cypress.io
9 6 (1.10%) SonarQube
10 5 (0.92%) Xcode
11 4 (0.74%) Ant
12 3 (0.55%) SpecFlow
13 2 (0.37%) Artifactory
13 2 (0.37%) Mercurial
13 2 (0.37%) Subversion
13 2 (0.37%) Team Foundation Server
14 1 (0.18%) NUnit
14 1 (0.18%) TeamCity
General
1 182 (33.46%) Social Skills
2 151 (27.76%) Finance
3 80 (14.71%) Analytical Skills
4 59 (10.85%) Inclusion and Diversity
5 40 (7.35%) Presentation Skills
6 35 (6.43%) Marketing
7 26 (4.78%) Banking
8 23 (4.23%) Law
9 22 (4.04%) Games
10 20 (3.68%) Manufacturing
11 16 (2.94%) Pharmaceutical
12 13 (2.39%) Influencing Skills
13 11 (2.02%) Organisational Skills
14 9 (1.65%) Back Office
14 9 (1.65%) Public Sector
14 9 (1.65%) Tech for Good
15 8 (1.47%) Legal
16 7 (1.29%) Health Technology
17 6 (1.10%) French Language
17 6 (1.10%) Retail
Job Titles
1 100 (18.38%) Lead
2 87 (15.99%) Senior
3 85 (15.63%) Developer
4 45 (8.27%) Architect
4 45 (8.27%) Project Manager
5 44 (8.09%) Software Engineer
6 28 (5.15%) Analyst
7 24 (4.41%) Senior Developer
8 20 (3.68%) Business Analyst
8 20 (3.68%) Consultant
8 20 (3.68%) Software Developer
9 19 (3.49%) Software Manager
10 17 (3.13%) Senior Manager
10 17 (3.13%) Senior Software Engineer
11 15 (2.76%) .NET Developer
11 15 (2.76%) Data Engineer
11 15 (2.76%) DevOps Engineer
11 15 (2.76%) Technical Manager
12 14 (2.57%) C# Developer
12 14 (2.57%) Windows Engineer
Libraries, Frameworks & Software Standards
1 51 (9.38%) .NET
1 51 (9.38%) HTML
2 39 (7.17%) CSS
3 27 (4.96%) React
4 22 (4.04%) AngularJS
5 21 (3.86%) SOAP
6 20 (3.68%) ASP.NET
6 20 (3.68%) Node.js
6 20 (3.68%) RESTful
7 19 (3.49%) LESS
8 17 (3.13%) .NET Core
9 16 (2.94%) .NET Framework
9 16 (2.94%) Entity Framework
9 16 (2.94%) HTML5 Canvas
9 16 (2.94%) Spring
10 15 (2.76%) Spring Boot
11 13 (2.39%) Redux
12 10 (1.84%) Hibernate
12 10 (1.84%) SAP Fiori
13 9 (1.65%) BAPI
Miscellaneous
1 30 (5.51%) Data Centre
2 26 (4.78%) Management Information System
3 25 (4.60%) Self-Motivation
4 23 (4.23%) Cloud Native
4 23 (4.23%) Data Structures
5 22 (4.04%) Onboarding
6 17 (3.13%) Product Ownership
7 15 (2.76%) Algorithms
8 14 (2.57%) Public Cloud
9 13 (2.39%) Client/Server
10 12 (2.21%) Distributed Systems
10 12 (2.21%) IoT
10 12 (2.21%) Mobile App
11 11 (2.02%) Biopharmaceutical
11 11 (2.02%) Swaptions
12 10 (1.84%) Data Protection Act
13 7 (1.29%) Freedom of Information
13 7 (1.29%) Hybrid Cloud
14 6 (1.10%) Private Cloud
14 6 (1.10%) Security Posture
Operating Systems
1 55 (10.11%) Windows
2 40 (7.35%) Linux
3 18 (3.31%) Windows Server
4 16 (2.94%) Apple iOS
5 11 (2.02%) Android
6 9 (1.65%) Mac OS
7 8 (1.47%) Windows 10
8 4 (0.74%) Windows Server 2016
8 4 (0.74%) Windows Vista
9 3 (0.55%) Windows Server 2003
10 2 (0.37%) Unix
10 2 (0.37%) VMS
10 2 (0.37%) Windows Server 2012
11 1 (0.18%) Debian
11 1 (0.18%) Solaris
11 1 (0.18%) Ubuntu
11 1 (0.18%) Windows Server 2019
Processes & Methodologies
1 181 (33.27%) Agile
2 148 (27.21%) Problem-Solving
3 110 (20.22%) Software Engineering
4 105 (19.30%) Virtual Team Management
5 91 (16.73%) Project Management
6 72 (13.24%) DevOps
7 70 (12.87%) Business Strategy
7 70 (12.87%) Computer Science
8 62 (11.40%) Continuous Improvement
9 60 (11.03%) Business Development
9 60 (11.03%) Project Delivery
10 57 (10.48%) Mentoring
11 55 (10.11%) Actionable Insight
12 53 (9.74%) SDLC
13 52 (9.56%) Data Science
13 52 (9.56%) Scrum
14 49 (9.01%) CI/CD
15 39 (7.17%) Presales
15 39 (7.17%) Process Improvement
16 37 (6.80%) Coaching
Programming Languages
1 83 (15.26%) JavaScript
2 51 (9.38%) Python
3 48 (8.82%) C#
3 48 (8.82%) Java
4 40 (7.35%) TypeScript
5 29 (5.33%) SQL
6 17 (3.13%) Go
7 15 (2.76%) C++
8 14 (2.57%) Bash
8 14 (2.57%) PHP
8 14 (2.57%) PowerShell
9 11 (2.02%) VB
10 10 (1.84%) Kotlin
10 10 (1.84%) Rust
11 9 (1.65%) Swift
12 8 (1.47%) Shell Script
13 7 (1.29%) Scala
14 6 (1.10%) C
15 4 (0.74%) R
16 3 (0.55%) Objective-C
Qualifications
1 151 (27.76%) Degree
2 110 (20.22%) Security Cleared
3 101 (18.57%) SC Cleared
4 20 (3.68%) Microsoft Certification
5 18 (3.31%) Computer Science Degree
6 15 (2.76%) Master's Degree
7 10 (1.84%) MCSE
8 9 (1.65%) BPSS Clearance
8 9 (1.65%) Cisco Certification
8 9 (1.65%) PMI Certification
9 8 (1.47%) DV Cleared
9 8 (1.47%) PMP
9 8 (1.47%) PRINCE2 Practitioner
10 7 (1.29%) PRINCE2 Certification
11 6 (1.10%) CISSP
12 5 (0.92%) AWS Certification
12 5 (0.92%) CCNP
13 4 (0.74%) APMP
13 4 (0.74%) Azure Certification
14 3 (0.55%) CCSK
Quality Assurance & Compliance
1 38 (6.99%) QA
2 12 (2.21%) Accessibility
3 8 (1.47%) SLA
4 7 (1.29%) ISO/IEC 27001
5 6 (1.10%) Data Quality
5 6 (1.10%) GxP
6 5 (0.92%) Sarbanes-Oxley
7 4 (0.74%) GDPR
7 4 (0.74%) NIST
7 4 (0.74%) PCI DSS
8 3 (0.55%) Cyber Essentials
9 2 (0.37%) HIPAA
10 1 (0.18%) 21 CFR Part 11
10 1 (0.18%) AUTOSAR
10 1 (0.18%) CDISC
10 1 (0.18%) Good Clinical Practice
10 1 (0.18%) ISO 22301
10 1 (0.18%) ISO 9001
10 1 (0.18%) PMO
10 1 (0.18%) UCITS
System Software
1 29 (5.33%) Active Directory
2 27 (4.96%) Docker
3 13 (2.39%) VMware Infrastructure
4 5 (0.92%) VMware ESXi
4 5 (0.92%) vSphere
5 2 (0.37%) Hyper-V
6 1 (0.18%) KVM
6 1 (0.18%) LXC
6 1 (0.18%) Virtual Machines
Systems Management
1 33 (6.07%) Terraform
2 30 (5.51%) Kubernetes
3 16 (2.94%) Ansible
4 12 (2.21%) SCCM
5 7 (1.29%) Argo
5 7 (1.29%) Progress Chef
5 7 (1.29%) Puppet
6 3 (0.55%) CASB
6 3 (0.55%) Grafana
6 3 (0.55%) SCOM
6 3 (0.55%) WSUS
7 2 (0.37%) FortiGate
7 2 (0.37%) Microsoft Intune
7 2 (0.37%) Nessus
7 2 (0.37%) SolarWinds Orion
7 2 (0.37%) WebSphere Cast Iron
8 1 (0.18%) Hadoop YARN
8 1 (0.18%) Jamf Pro
8 1 (0.18%) Juju
8 1 (0.18%) PaperCut
Vendors
1 86 (15.81%) Microsoft
2 25 (4.60%) SAP
3 18 (3.31%) Dell
3 18 (3.31%) Oracle
4 17 (3.13%) Cisco
4 17 (3.13%) VMware
5 13 (2.39%) Google
6 12 (2.21%) Sybase
7 11 (2.02%) OpenLink
7 11 (2.02%) TIBCO
8 9 (1.65%) Salesforce
9 8 (1.47%) McAfee
9 8 (1.47%) Meraki
10 7 (1.29%) Symantec
11 6 (1.10%) Amplitude
11 6 (1.10%) SolarWinds
12 5 (0.92%) CrowdStrike
12 5 (0.92%) Juniper
12 5 (0.92%) ServiceNow
13 4 (0.74%) Adobe