Waterfall Jobs

Waterfall Model
UK

The table below provides summary statistics for permanent job vacancies requiring Waterfall skills. It includes a benchmarking guide to the annual salaries offered in vacancies that cited Waterfall over the 6 months leading up to 10 May 2025, comparing them to the same period in the previous two years.

6 months to
10 May 2025
Same period 2024 Same period 2023
Rank 219 275 165
Rank change year-on-year +56 -110 +19
Permanent jobs citing Waterfall 799 1,062 2,291
As % of all permanent jobs advertised in the UK 1.46% 1.07% 2.26%
As % of the Processes & Methodologies category 1.56% 1.25% 2.36%
Number of salaries quoted 552 881 1,387
10th Percentile £46,250 £37,500 £42,500
25th Percentile £55,000 £46,250 £50,000
Median annual salary (50th Percentile) £60,000 £55,000 £60,000
Median % change year-on-year +9.09% -8.33% +4.35%
75th Percentile £70,000 £72,500 £77,500
90th Percentile £87,250 £86,250 £88,750
UK excluding London median annual salary £60,000 £54,000 £57,500
% change year-on-year +11.11% -6.09% +4.55%

All Process and Methodology Skills
UK

Waterfall falls under the Processes and Methodologies category. For comparison with the information above, the following table provides summary statistics for all permanent job vacancies requiring process or methodology skills.

Permanent vacancies with a requirement for process or methodology skills 51,147 84,812 96,895
As % of all permanent jobs advertised in the UK 93.75% 85.58% 95.62%
Number of salaries quoted 26,984 59,843 56,946
10th Percentile £30,000 £29,000 £34,000
25th Percentile £42,500 £40,000 £45,000
Median annual salary (50th Percentile) £57,500 £55,000 £61,180
Median % change year-on-year +4.55% -10.10% +1.97%
75th Percentile £75,000 £72,500 £81,250
90th Percentile £98,474 £92,500 £100,000
UK excluding London median annual salary £52,500 £50,000 £55,000
% change year-on-year +5.00% -9.09% +4.76%

Waterfall
Job Vacancy Trend

Job postings citing Waterfall as a proportion of all IT jobs advertised.
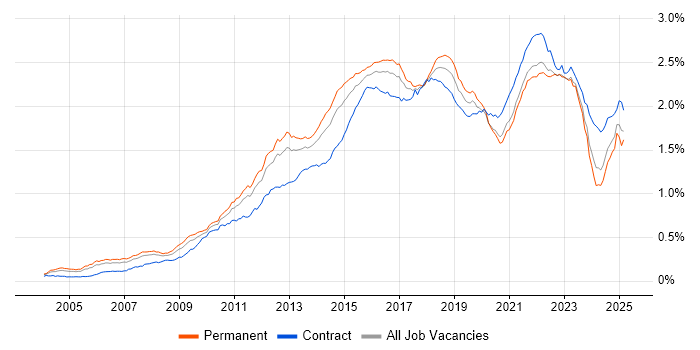
Job vacancy trend for Waterfall in the UK

Waterfall
Salary Trend

3-month moving average salary quoted in jobs citing Waterfall.

Salary trend for Waterfall in the UK

Waterfall
Salary Histogram

Salary distribution for jobs citing Waterfall over the 6 months to 10 May 2025.

Salary histogram for Waterfall in the UK

Waterfall
Top 17 Job Locations

The table below looks at the demand and provides a guide to the median salaries quoted in IT jobs citing Waterfall within the UK over the 6 months to 10 May 2025. The 'Rank Change' column provides an indication of the change in demand within each location based on the same 6 month period last year.

Location Rank Change
on Same Period
Last Year
Matching
Permanent
IT Job Ads
Median Salary
Past 6 Months
Median Salary
% Change
on Same Period
Last Year
Live
Jobs
England +25 713 £60,000 +9.09% 505
UK excluding London +57 604 £60,000 +11.11% 340
South East +106 249 £65,000 +20.37% 133
Work from Home +9 190 £57,500 +7.11% 254
London +59 163 £67,500 +3.85% 232
Midlands +26 134 £57,750 +6.94% 49
North of England -13 111 £54,793 +1.47% 71
West Midlands +43 92 £57,500 +4.55% 27
North West +14 79 £54,793 +5.70% 44
East Midlands +18 42 £60,000 +11.11% 21
South West +54 32 £60,000 +20.00% 44
Wales +63 31 £65,000 +23.96% 6
Yorkshire +3 25 £56,250 -6.25% 25
Scotland +119 23 £55,000 - 23
East of England -15 23 £70,000 +27.27% 23
North East +28 7 £47,500 -9.52% 6
Northern Ireland +34 1 - - 3

Waterfall
Co-occurring Skills and Capabilities by Category

The follow tables expand on the table above by listing co-occurrences grouped by category. The same employment type, locality and period is covered with up to 20 co-occurrences shown in each of the following categories:

Application Platforms
1 32 (4.01%) Confluence
2 8 (1.00%) Apache Spark
3 7 (0.88%) SharePoint
4 5 (0.63%) CMS
5 4 (0.50%) Apache
5 4 (0.50%) Umbraco
6 2 (0.25%) Apache Airflow
7 1 (0.13%) Appian
7 1 (0.13%) CICS
7 1 (0.13%) ColdFusion
7 1 (0.13%) Kentico
7 1 (0.13%) Microsoft Exchange
7 1 (0.13%) OpenEdge
7 1 (0.13%) SAS
7 1 (0.13%) Sitecore CMS
7 1 (0.13%) Sitefinity
Applications
1 52 (6.51%) Microsoft Project
2 23 (2.88%) Microsoft Excel
3 22 (2.75%) Microsoft Office
4 20 (2.50%) MS Visio
5 14 (1.75%) Microsoft PowerPoint
6 11 (1.38%) Trello
7 1 (0.13%) Chatbot
7 1 (0.13%) Spreadsheet
Business Applications
1 10 (1.25%) Dynamics CRM
2 8 (1.00%) Oracle ERP
3 7 (0.88%) SAP S/4HANA
4 4 (0.50%) Salesforce CRM
5 3 (0.38%) SAP ERP
6 2 (0.25%) Adobe Campaign
6 2 (0.25%) Oracle EBS
6 2 (0.25%) Oracle EBS R12
6 2 (0.25%) Siebel CRM
7 1 (0.13%) Distributed Ledger
7 1 (0.13%) Elite 3E
7 1 (0.13%) Finacle
7 1 (0.13%) ResourceLink
7 1 (0.13%) SAP MDG
7 1 (0.13%) SAP PP
7 1 (0.13%) SAP SD
7 1 (0.13%) Sparx Enterprise Architect
Cloud Services
1 95 (11.89%) Azure
2 57 (7.13%) AWS
3 49 (6.13%) Azure DevOps
4 46 (5.76%) SaaS
5 45 (5.63%) Power Platform
6 30 (3.75%) PaaS
7 29 (3.63%) Power Automate
8 28 (3.50%) IaaS
9 25 (3.13%) Azure Service Bus
10 21 (2.63%) Dynamics 365
11 19 (2.38%) Microsoft 365
12 18 (2.25%) Azure AI
13 16 (2.00%) Azure ExpressRoute
13 16 (2.00%) Azure Key Vault
13 16 (2.00%) Azure Monitor
13 16 (2.00%) Entra ID
13 16 (2.00%) GitHub
14 14 (1.75%) GCP
15 11 (1.38%) Amazon S3
15 11 (1.38%) Serverless
Communications & Networking
1 33 (4.13%) Firewall
2 27 (3.38%) WAN
3 24 (3.00%) SD-WAN
4 17 (2.13%) DNS
5 16 (2.00%) VPN
6 8 (1.00%) 5G
7 5 (0.63%) Network Security
8 4 (0.50%) Wireless
9 3 (0.38%) Ethernet
10 2 (0.25%) Broadband
10 2 (0.25%) DWDM
10 2 (0.25%) GPON
10 2 (0.25%) IPv4
10 2 (0.25%) IPv6
10 2 (0.25%) MPLS
11 1 (0.13%) DHCP
11 1 (0.13%) LoRaWAN
11 1 (0.13%) Modbus
Database & Business Intelligence
1 36 (4.51%) Power BI
2 18 (2.25%) Data Lake
2 18 (2.25%) MySQL
3 16 (2.00%) SQL Server
4 15 (1.88%) Data Warehouse
5 14 (1.75%) Relational Database
5 14 (1.75%) Tableau
6 10 (1.25%) PostgreSQL
7 9 (1.13%) SQL Server Integration Services
8 6 (0.75%) RDBMS
9 5 (0.63%) Oracle Database
10 4 (0.50%) Amazon Redshift
10 4 (0.50%) Big Data
11 3 (0.38%) NoSQL
11 3 (0.38%) SQL Server Reporting Services
12 2 (0.25%) Apache Hive
12 2 (0.25%) Data Mining
12 2 (0.25%) OLTP
12 2 (0.25%) Snowflake Schema
12 2 (0.25%) SQL Server Analysis Services
Development Applications
1 89 (11.14%) JIRA
2 27 (3.38%) Git
3 21 (2.63%) eggPlant
4 9 (1.13%) Selenium
5 7 (0.88%) Postman
6 5 (0.63%) Cypress.io
7 4 (0.50%) JMeter
7 4 (0.50%) Visual Studio
7 4 (0.50%) Visual Studio Code
8 3 (0.38%) Jenkins
8 3 (0.38%) LoadRunner
8 3 (0.38%) Oracle Forms
9 2 (0.25%) HP UFT
9 2 (0.25%) Oracle APEX
9 2 (0.25%) Subversion
9 2 (0.25%) TestNG
10 1 (0.13%) Bugzilla
10 1 (0.13%) Eclipse
10 1 (0.13%) JUnit
10 1 (0.13%) Team Foundation Server
General
1 193 (24.16%) Social Skills
2 149 (18.65%) Finance
3 83 (10.39%) Analytical Skills
4 32 (4.01%) Organisational Skills
5 28 (3.50%) Law
6 26 (3.25%) Manufacturing
6 26 (3.25%) Retail
7 24 (3.00%) Inclusion and Diversity
8 23 (2.88%) Banking
9 22 (2.75%) Presentation Skills
10 18 (2.25%) Electronics
11 16 (2.00%) Marketing
12 13 (1.63%) Influencing Skills
12 13 (1.63%) Public Sector
13 8 (1.00%) Legal
14 7 (0.88%) Telecoms
15 5 (0.63%) French Language
15 5 (0.63%) Publishing
16 4 (0.50%) Documentation Skills
16 4 (0.50%) Retail Banking
Job Titles
1 220 (27.53%) Senior
2 178 (22.28%) Principal Engineer
3 154 (19.27%) Project Manager
4 116 (14.52%) Software Engineer
5 107 (13.39%) Analyst
6 82 (10.26%) Architect
7 73 (9.14%) Principal Software Engineer
8 53 (6.63%) Business Analyst
9 52 (6.51%) Test Engineer
10 50 (6.26%) Senior Software Test Engineer
10 50 (6.26%) Senior Test Engineer
10 50 (6.26%) Software Test Engineer
11 45 (5.63%) Senior Manager
12 43 (5.38%) Senior Analyst
13 38 (4.76%) Senior Software Engineer
13 38 (4.76%) Test Analyst
14 36 (4.51%) Lead
15 35 (4.38%) Senior Project Manager
15 35 (4.38%) Software Architect
16 33 (4.13%) IT Manager
Libraries, Frameworks & Software Standards
1 38 (4.76%) Middleware
2 23 (2.88%) .NET
3 15 (1.88%) HTML
4 12 (1.50%) React
5 10 (1.25%) CSS
6 9 (1.13%) AngularJS
6 9 (1.13%) JSON
6 9 (1.13%) REST
6 9 (1.13%) RESTful
7 8 (1.00%) .NET Framework
8 7 (0.88%) ASP.NET Web API
8 7 (0.88%) XML
9 6 (0.75%) Bootstrap
9 6 (0.75%) SOAP
9 6 (0.75%) Tailwind CSS
9 6 (0.75%) Web Services
10 4 (0.50%) Kafka
10 4 (0.50%) NgRx
10 4 (0.50%) Playwright
10 4 (0.50%) RxJS
Miscellaneous
1 27 (3.38%) Product Ownership
2 22 (2.75%) Management Information System
3 21 (2.63%) Data Centre
4 19 (2.38%) NHS
5 13 (1.63%) Self-Motivation
6 8 (1.00%) PMI
6 8 (1.00%) Self-Driving Car
6 8 (1.00%) Social Media
7 7 (0.88%) Client/Server
7 7 (0.88%) Onboarding
8 6 (0.75%) Analytical Mindset
8 6 (0.75%) Data Protection Act
8 6 (0.75%) Virtual Team
9 5 (0.63%) Driving Licence
9 5 (0.63%) Greenfield Project
9 5 (0.63%) Legacy Systems
10 4 (0.50%) Algorithms
10 4 (0.50%) Legacy Applications
10 4 (0.50%) Marketing Technology
10 4 (0.50%) Reinsurance
Operating Systems
1 15 (1.88%) Windows
2 8 (1.00%) Windows Vista
3 4 (0.50%) Linux
4 2 (0.25%) Android
4 2 (0.25%) Apple iOS
5 1 (0.13%) AIX
5 1 (0.13%) CentOS
5 1 (0.13%) Debian
5 1 (0.13%) Unix
5 1 (0.13%) Windows Server
5 1 (0.13%) zOS
Processes & Methodologies
1 748 (93.62%) Agile
2 276 (34.54%) Project Management
3 231 (28.91%) Software Engineering
4 226 (28.29%) Computer Science
5 217 (27.16%) UML
6 171 (21.40%) Configuration Management
7 164 (20.53%) Stakeholder Management
8 162 (20.28%) Project Delivery
9 161 (20.15%) SDLC
10 153 (19.15%) Software Testing
11 131 (16.40%) Scrum
12 114 (14.27%) Test Automation
13 113 (14.14%) DevOps
14 103 (12.89%) Continuous Improvement
15 98 (12.27%) PRINCE2
16 96 (12.02%) Problem-Solving
17 92 (11.51%) Mentoring
18 73 (9.14%) Roadmaps
19 71 (8.89%) Validation
20 58 (7.26%) Migration
Programming Languages
1 77 (9.64%) Ada
2 64 (8.01%) SQL
3 38 (4.76%) Python
4 30 (3.75%) JavaScript
5 28 (3.50%) Java
6 27 (3.38%) C#
7 21 (2.63%) Ada 95
8 18 (2.25%) PowerShell
9 16 (2.00%) Bicep
10 9 (1.13%) C++
10 9 (1.13%) T-SQL
11 7 (0.88%) C
11 7 (0.88%) R
12 6 (0.75%) Bash
12 6 (0.75%) TypeScript
13 5 (0.63%) PL/SQL
14 4 (0.50%) VBA
15 3 (0.38%) Apex Code
16 2 (0.25%) Go
17 1 (0.13%) ActionScript 2.0
Qualifications
1 391 (48.94%) Degree
2 238 (29.79%) BPSS Clearance
3 135 (16.90%) Chartered Engineer
4 78 (9.76%) PMP
5 57 (7.13%) PMI Certification
6 50 (6.26%) Computer Science Degree
7 35 (4.38%) Security Cleared
8 27 (3.38%) DBS Check
9 24 (3.00%) Azure Certification
9 24 (3.00%) SC Cleared
10 22 (2.75%) ISTQB
11 16 (2.00%) PRINCE2 Practitioner
12 13 (1.63%) Master's Degree
13 6 (0.75%) Microsoft Certification
14 5 (0.63%) ISEB
15 4 (0.50%) PRINCE2 Certification
15 4 (0.50%) SAP Certification
16 3 (0.38%) CISSP
16 3 (0.38%) ITIL Certification
16 3 (0.38%) MBA
Quality Assurance & Compliance
1 141 (17.65%) ISO/IEC 12207
2 63 (7.88%) QA
3 47 (5.88%) PMO
4 17 (2.13%) Data Quality
5 5 (0.63%) ISO/IEC 27001
6 4 (0.50%) GDPR
6 4 (0.50%) NCSC
7 3 (0.38%) NIST
8 2 (0.25%) Accessibility
8 2 (0.25%) HIPAA
9 1 (0.13%) Basel III
9 1 (0.13%) Cyber Essentials
9 1 (0.13%) ISO 9001
9 1 (0.13%) MiFID
9 1 (0.13%) P3O
9 1 (0.13%) PCI DSS
9 1 (0.13%) PSD2
9 1 (0.13%) Software Quality Assurance
System Software
1 16 (2.00%) Virtual Machines
2 6 (0.75%) Embedded Firmware
2 6 (0.75%) Firmware
3 3 (0.38%) Docker
Systems Management
1 16 (2.00%) Single Sign-On
2 3 (0.38%) Kubernetes
3 2 (0.25%) Ansible
3 2 (0.25%) HP Quality Center
3 2 (0.25%) Microsoft Intune
4 1 (0.13%) CA Service Virtualization
4 1 (0.13%) Terraform
Vendors
1 94 (11.76%) Microsoft
2 72 (9.01%) Siemens
3 30 (3.75%) Atlassian
4 28 (3.50%) Salesforce
5 27 (3.38%) Micro Focus
6 26 (3.25%) Oracle
7 21 (2.63%) Keysight
8 20 (2.50%) Databricks
9 19 (2.38%) Google
10 16 (2.00%) Meraki
11 15 (1.88%) SAP
12 9 (1.13%) IBM
13 8 (1.00%) ServiceNow
14 7 (0.88%) Cisco
15 5 (0.63%) Blue Prism
15 5 (0.63%) UiPath
16 4 (0.50%) Siebel
17 2 (0.25%) Adobe
17 2 (0.25%) Ariba
17 2 (0.25%) Informatica