Design Patterns Jobs

Design Patterns
UK

The table below provides summary statistics for permanent job vacancies requiring Design Patterns skills. It includes a benchmarking guide to the annual salaries offered in vacancies that cited Design Patterns over the 6 months leading up to 5 June 2025, comparing them to the same period in the previous two years.

6 months to
5 Jun 2025
Same period 2024 Same period 2023
Rank 184 180 166
Rank change year-on-year -4 -14 -71
Permanent jobs citing Design Patterns 987 1,616 2,108
As % of all permanent jobs advertised in the UK 1.76% 1.53% 2.24%
As % of the Processes & Methodologies category 1.89% 1.83% 2.35%
Number of salaries quoted 386 1,056 1,270
10th Percentile £48,125 £41,250 £47,500
25th Percentile £57,500 £52,500 £57,500
Median annual salary (50th Percentile) £70,000 £62,500 £72,500
Median % change year-on-year +12.00% -13.79% +11.54%
75th Percentile £82,500 £80,000 £92,500
90th Percentile £91,875 £93,750 £113,750
UK excluding London median annual salary £70,000 £60,000 £65,000
% change year-on-year +16.67% -7.69% +13.04%

All Process and Methodology Skills
UK

Design Patterns falls under the Processes and Methodologies category. For comparison with the information above, the following table provides summary statistics for all permanent job vacancies requiring process or methodology skills.

Permanent vacancies with a requirement for process or methodology skills 52,264 88,302 89,653
As % of all permanent jobs advertised in the UK 93.43% 83.46% 95.47%
Number of salaries quoted 25,878 61,362 54,143
10th Percentile £28,500 £29,290 £34,000
25th Percentile £40,750 £40,000 £45,000
Median annual salary (50th Percentile) £56,000 £55,000 £60,899
Median % change year-on-year +1.82% -9.69% +1.50%
75th Percentile £75,000 £72,500 £81,250
90th Percentile £97,500 £92,500 £100,000
UK excluding London median annual salary £51,500 £50,000 £55,000
% change year-on-year +3.00% -9.09% +4.76%

Design Patterns
Job Vacancy Trend

Job postings citing Design Patterns as a proportion of all IT jobs advertised.
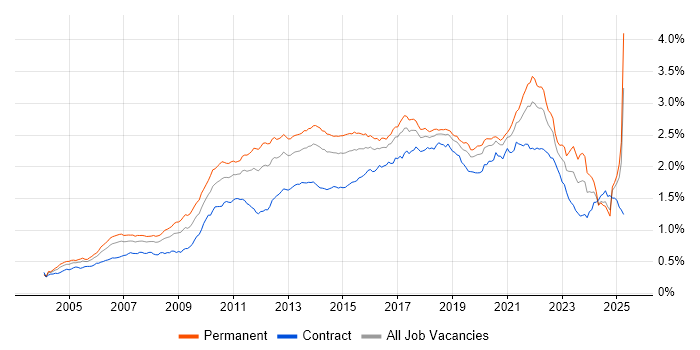
Job vacancy trend for Design Patterns in the UK

Design Patterns
Salary Trend

3-month moving average salary quoted in jobs citing Design Patterns.

Salary trend for Design Patterns in the UK

Design Patterns
Salary Histogram

Salary distribution for jobs citing Design Patterns over the 6 months to 5 June 2025.

Salary histogram for Design Patterns in the UK

Design Patterns
Top 17 Job Locations

The table below looks at the demand and provides a guide to the median salaries quoted in IT jobs citing Design Patterns within the UK over the 6 months to 5 June 2025. The 'Rank Change' column provides an indication of the change in demand within each location based on the same 6 month period last year.

Location Rank Change
on Same Period
Last Year
Matching
Permanent
IT Job Ads
Median Salary
Past 6 Months
Median Salary
% Change
on Same Period
Last Year
Live
Jobs
England -13 927 £70,000 +9.81% 2,420
UK excluding London +17 780 £70,000 +16.67% 2,178
North of England +24 469 £57,500 -6.05% 541
North West +27 435 £50,055 -18.22% 279
Work from Home -58 278 £65,000 +4.00% 1,536
South East +21 171 £73,000 +21.67% 589
London -29 164 £70,000 -12.50% 543
Midlands -56 41 £60,000 -3.00% 386
West Midlands +4 36 £60,000 -4.00% 203
South West -9 32 £69,263 +38.53% 247
Yorkshire -1 28 £70,000 +14.37% 191
East of England +22 25 £71,250 -5.00% 294
Wales +49 21 £73,000 +24.15% 58
Scotland +40 17 £77,500 +29.17% 98
North East +7 6 £85,000 +36.05% 74
East Midlands -45 5 £51,250 +2.50% 156
Northern Ireland +38 4 - - 29

Design Patterns
Co-occurring Skills and Capabilities by Category

The follow tables expand on the table above by listing co-occurrences grouped by category. The same employment type, locality and period is covered with up to 20 co-occurrences shown in each of the following categories:

Application Platforms
1 13 (1.32%) CMS
2 12 (1.22%) Apache
2 12 (1.22%) WordPress
3 9 (0.91%) Confluence
4 4 (0.41%) Apache Spark
4 4 (0.41%) GemFire
5 3 (0.30%) Apache Airflow
6 2 (0.20%) IIS
6 2 (0.20%) nginx
6 2 (0.20%) NServiceBus
6 2 (0.20%) OpenStack
6 2 (0.20%) WebSphere
6 2 (0.20%) WebSphere Application Server
7 1 (0.10%) Drupal
7 1 (0.10%) Microsoft Exchange
7 1 (0.10%) Oracle SOA Suite
7 1 (0.10%) SAS
7 1 (0.10%) SharePoint
7 1 (0.10%) Tomcat
7 1 (0.10%) Umbraco
Applications
1 5 (0.51%) Microsoft Excel
2 4 (0.41%) MS Visio
3 3 (0.30%) UserZoom
4 2 (0.20%) Adobe XD
4 2 (0.20%) Microsoft PowerPoint
4 2 (0.20%) Sketch
5 1 (0.10%) S-PLUS
5 1 (0.10%) Trello
Business Applications
1 8 (0.81%) Oracle EBS
2 2 (0.20%) Magento
3 1 (0.10%) iTrent
Cloud Services
1 211 (21.38%) Azure
2 178 (18.03%) AWS
3 63 (6.38%) AWS CloudFormation
4 62 (6.28%) Azure DevOps
5 49 (4.96%) Amazon EKS
6 47 (4.76%) GCP
7 44 (4.46%) Serverless
8 38 (3.85%) Azure Service Bus
9 29 (2.94%) Azure Cosmos DB
10 28 (2.84%) AWS Lambda
10 28 (2.84%) SonarCloud
11 25 (2.53%) SaaS
11 25 (2.53%) Salesforce Sales Cloud
12 24 (2.43%) GitHub
13 15 (1.52%) GitHub Actions
14 14 (1.42%) Figma
15 11 (1.11%) AWS KMS
16 7 (0.71%) PaaS
17 6 (0.61%) IaaS
17 6 (0.61%) Power Platform
Communications & Networking
1 400 (40.53%) VPN
2 397 (40.22%) DNS
3 17 (1.72%) Network Security
4 9 (0.91%) HTTP
5 2 (0.20%) Firewall
5 2 (0.20%) Internet
5 2 (0.20%) S/MIME
5 2 (0.20%) SSL
5 2 (0.20%) X.509
6 1 (0.10%) BGP
6 1 (0.10%) Broadband
6 1 (0.10%) Cisco IOS
6 1 (0.10%) Intrusion Detection
6 1 (0.10%) IOS XR
6 1 (0.10%) MPLS
6 1 (0.10%) Multicast
6 1 (0.10%) OSPF
6 1 (0.10%) SSH
6 1 (0.10%) TCP/IP
6 1 (0.10%) Unified Communications
Database & Business Intelligence
1 83 (8.41%) Elasticsearch
2 62 (6.28%) SQL Server
3 45 (4.56%) MongoDB
4 36 (3.65%) MySQL
5 33 (3.34%) NoSQL
6 25 (2.53%) PostgreSQL
7 24 (2.43%) Relational Database
8 16 (1.62%) Redis
9 12 (1.22%) RDBMS
10 5 (0.51%) Big Data
10 5 (0.51%) Data Lake
10 5 (0.51%) Power BI
11 4 (0.41%) Apache Hive
11 4 (0.41%) Apache Ignite
11 4 (0.41%) Hadoop
11 4 (0.41%) InterSystems Cache
12 3 (0.30%) Apache Cassandra
12 3 (0.30%) Azure SQL Database
12 3 (0.30%) Data Warehouse
12 3 (0.30%) Looker
Development Applications
1 116 (11.75%) Git
2 37 (3.75%) Octopus Deploy
3 36 (3.65%) JIRA
4 35 (3.55%) Visual Studio
5 31 (3.14%) Jenkins
6 29 (2.94%) MSBuild
7 28 (2.84%) Team Foundation Server
8 20 (2.03%) Atlassian Bamboo
9 16 (1.62%) Bitbucket
9 16 (1.62%) JUnit
10 15 (1.52%) Jasmine
10 15 (1.52%) Rational DOORS
11 14 (1.42%) Gradle
11 14 (1.42%) NUnit
12 12 (1.22%) GitLab
13 11 (1.11%) Maven
13 11 (1.11%) SonarQube
14 10 (1.01%) PHPUnit
15 9 (0.91%) Mocha
16 7 (0.71%) webpack
General
1 496 (50.25%) Finance
2 486 (49.24%) Inclusion and Diversity
3 472 (47.82%) Analytical Skills
4 130 (13.17%) Social Skills
5 53 (5.37%) Retail
6 36 (3.65%) Law
7 32 (3.24%) Banking
8 29 (2.94%) Marketing
9 19 (1.93%) Public Sector
10 14 (1.42%) Games
11 13 (1.32%) Front Office
12 7 (0.71%) Back Office
13 6 (0.61%) Influencing Skills
13 6 (0.61%) Presentation Skills
13 6 (0.61%) Retail Banking
13 6 (0.61%) Telecoms
14 5 (0.51%) Automotive
14 5 (0.51%) Documentation Skills
14 5 (0.51%) Manufacturing
15 3 (0.30%) Electronics
Job Titles
1 637 (64.54%) Developer
2 467 (47.32%) Software Developer
3 179 (18.14%) Architect
4 92 (9.32%) Senior
5 78 (7.90%) Software Engineer
6 76 (7.70%) Software Architect
7 73 (7.40%) .NET Developer
8 70 (7.09%) Lead
9 45 (4.56%) Senior Developer
10 44 (4.46%) C# Developer
11 43 (4.36%) Technical Architect
12 32 (3.24%) Java Engineer
13 30 (3.04%) C# .NET Developer
13 30 (3.04%) Lead Developer
14 29 (2.94%) Senior Software Engineer
15 26 (2.63%) Salesforce Architect
16 24 (2.43%) Enterprise Architect
17 20 (2.03%) Java Software Engineer
18 19 (1.93%) Cloud Architect
18 19 (1.93%) Full-Stack Developer
Libraries, Frameworks & Software Standards
1 212 (21.48%) .NET
2 102 (10.33%) REST
3 101 (10.23%) Middleware
4 94 (9.52%) CSS
5 83 (8.41%) HTML
6 82 (8.31%) React
7 76 (7.70%) Node.js
8 57 (5.78%) ASP.NET
8 57 (5.78%) Kafka
9 54 (5.47%) AngularJS
10 49 (4.96%) Pandas
11 46 (4.66%) RESTful
12 44 (4.46%) .NET Core
12 44 (4.46%) Spring
13 39 (3.95%) JSON
14 37 (3.75%) Bootstrap
15 35 (3.55%) XML
16 33 (3.34%) .NET Framework
17 29 (2.94%) gRPC
18 28 (2.84%) SOAP
Miscellaneous
1 446 (45.19%) Cyberattack
2 35 (3.55%) Product Ownership
3 34 (3.44%) Cloud Native
4 31 (3.14%) Algorithms
4 31 (3.14%) Mobile App
5 29 (2.94%) Enterprise Software
6 28 (2.84%) Data Structures
7 26 (2.63%) Distributed Systems
8 20 (2.03%) Legacy Systems
8 20 (2.03%) Management Information System
9 17 (1.72%) Greenfield Project
10 14 (1.42%) Foreign Exchange (FX)
11 13 (1.32%) Fixed Income
12 12 (1.22%) Mobile Games
13 8 (0.81%) Hedge funds
13 8 (0.81%) Public Cloud
14 7 (0.71%) Equities
15 5 (0.51%) N-Tier
15 5 (0.51%) Self-Motivation
15 5 (0.51%) Smartphone
Operating Systems
1 469 (47.52%) Linux
2 468 (47.42%) Android
3 24 (2.43%) Apple iOS
4 11 (1.11%) Windows
5 5 (0.51%) Unix
6 1 (0.10%) Embedded Linux
6 1 (0.10%) Solaris
Processes & Methodologies
1 730 (73.96%) Agile
2 542 (54.91%) OOP
3 537 (54.41%) OO
4 457 (46.30%) Android Development
5 455 (46.10%) Mathematics
6 453 (45.90%) Line Management
7 257 (26.04%) DevOps
8 213 (21.58%) CI/CD
8 213 (21.58%) Software Engineering
9 171 (17.33%) Computer Science
10 168 (17.02%) Microservices
11 153 (15.50%) Mentoring
12 125 (12.66%) Continuous Improvement
13 114 (11.55%) Problem-Solving
14 107 (10.84%) SDLC
15 98 (9.93%) Containerisation
16 92 (9.32%) Configuration Management
17 91 (9.22%) TDD
18 89 (9.02%) Open Source
18 89 (9.02%) UML
Programming Languages
1 573 (58.05%) Java
2 482 (48.83%) Python
3 464 (47.01%) C++
4 458 (46.40%) Go
5 192 (19.45%) JavaScript
6 182 (18.44%) C#
7 110 (11.14%) SQL
8 57 (5.78%) Rust
9 53 (5.37%) TypeScript
10 33 (3.34%) PHP
11 26 (2.63%) Apex Code
12 23 (2.33%) C
13 17 (1.72%) Swift
14 15 (1.52%) Ada
14 15 (1.52%) VB
15 13 (1.32%) Kotlin
15 13 (1.32%) Ruby
16 11 (1.11%) Objective-C
17 4 (0.41%) Bash
18 3 (0.30%) PowerShell
Qualifications
1 490 (49.65%) Security Cleared
2 449 (45.49%) DV Cleared
3 191 (19.35%) Degree
4 148 (14.99%) Computer Science Degree
5 90 (9.12%) BPSS Clearance
6 74 (7.50%) Chartered Engineer
7 33 (3.34%) SC Cleared
8 28 (2.84%) Master's Degree
9 26 (2.63%) AWS Certification
10 20 (2.03%) AWS Certified Solutions Architect
11 6 (0.61%) Numerate Degree
12 4 (0.41%) CISM
12 4 (0.41%) CISSP
12 4 (0.41%) TOGAF Certification
13 2 (0.20%) CEH
13 2 (0.20%) CompTIA Security+
13 2 (0.20%) GIAC
13 2 (0.20%) ISSAP
13 2 (0.20%) PhD
13 2 (0.20%) SANS
Quality Assurance & Compliance
1 74 (7.50%) ISO/IEC 12207
2 57 (5.78%) GDPR
3 38 (3.85%) QA
4 21 (2.13%) Data Quality
5 20 (2.03%) HIPAA
6 13 (1.32%) ISO/IEC 27001
7 11 (1.11%) SOC 2
8 8 (0.81%) Accessibility
9 7 (0.71%) COBIT
10 6 (0.61%) PCI DSS
11 4 (0.41%) California Consumer Privacy Act
11 4 (0.41%) NIST
12 3 (0.30%) Def Stans
12 3 (0.30%) IEC 61508
12 3 (0.30%) SLA
13 2 (0.20%) Cyber Essentials
13 2 (0.20%) Cyber Essentials PLUS
13 2 (0.20%) NCSC
14 1 (0.10%) HL7
14 1 (0.10%) WCAG
System Software
1 565 (57.24%) Docker
2 4 (0.41%) Active Directory
3 1 (0.10%) Embedded Firmware
3 1 (0.10%) Firmware
3 1 (0.10%) Virtual Machines
Systems Management
1 450 (45.59%) Ansible
2 129 (13.07%) Kubernetes
3 69 (6.99%) Terraform
4 19 (1.93%) Prometheus
5 16 (1.62%) Grafana
6 5 (0.51%) Argo
7 4 (0.41%) Progress Chef
7 4 (0.41%) Puppet
8 2 (0.20%) Computer Emergency Response Teams
9 1 (0.10%) Kibana
9 1 (0.10%) logstash
Vendors
1 42 (4.26%) Microsoft
2 29 (2.94%) Salesforce
3 22 (2.23%) Oracle
4 21 (2.13%) Salesforce Marketing Cloud
5 19 (1.93%) Google
6 13 (1.32%) New Relic
7 8 (0.81%) Okta
8 7 (0.71%) Sybase
9 5 (0.51%) MuleSoft
9 5 (0.51%) Splunk
10 4 (0.41%) Adobe
10 4 (0.41%) Dell
10 4 (0.41%) Informatica
10 4 (0.41%) Solace
10 4 (0.41%) TIBCO
10 4 (0.41%) Trayport
11 3 (0.30%) Atlassian
11 3 (0.30%) IBM
11 3 (0.30%) Snowplow
12 2 (0.20%) Thales