Line Management Jobs

Line Management
UK

The table below provides summary statistics for permanent job vacancies requiring Line Management skills. It includes a benchmarking guide to the annual salaries offered in vacancies that cited Line Management over the 6 months leading up to 29 May 2025, comparing them to the same period in the previous two years.

6 months to
29 May 2025
Same period 2024 Same period 2023
Rank 64 108 123
Rank change year-on-year +44 +15 +16
Permanent jobs citing Line Management 2,174 2,464 2,846
As % of all permanent jobs advertised in the UK 3.96% 2.40% 2.92%
As % of the Processes & Methodologies category 4.23% 2.85% 3.06%
Number of salaries quoted 656 1,737 1,382
10th Percentile £25,313 £28,250 £36,250
25th Percentile £42,000 £38,500 £46,250
Median annual salary (50th Percentile) £54,793 £52,396 £65,262
Median % change year-on-year +4.58% -19.72% +8.77%
75th Percentile £70,208 £75,000 £84,056
90th Percentile £87,500 £115,000 £102,500
UK excluding London median annual salary £52,600 £47,500 £60,000
% change year-on-year +10.74% -20.83% +12.97%

All Process and Methodology Skills
UK

Line Management falls under the Processes and Methodologies category. For comparison with the information above, the following table provides summary statistics for all permanent job vacancies requiring process or methodology skills.

Permanent vacancies with a requirement for process or methodology skills 51,417 86,448 93,028
As % of all permanent jobs advertised in the UK 93.74% 84.24% 95.56%
Number of salaries quoted 25,323 60,550 54,986
10th Percentile £29,000 £29,250 £34,000
25th Percentile £41,250 £40,000 £45,000
Median annual salary (50th Percentile) £57,500 £55,000 £61,000
Median % change year-on-year +4.55% -9.84% +1.67%
75th Percentile £75,000 £72,500 £81,250
90th Percentile £97,500 £92,500 £100,000
UK excluding London median annual salary £51,564 £50,000 £55,000
% change year-on-year +3.13% -9.09% +4.76%

Line Management
Job Vacancy Trend

Job postings citing Line Management as a proportion of all IT jobs advertised.
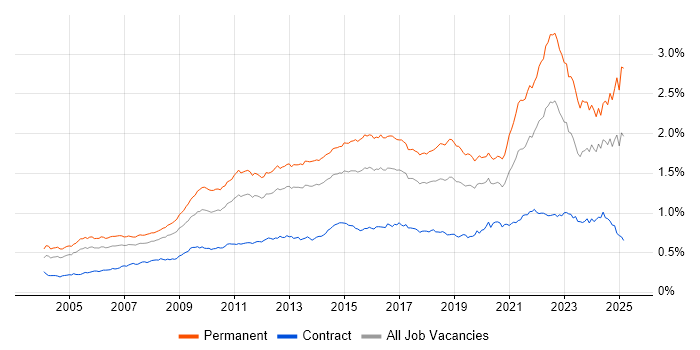
Job vacancy trend for Line Management in the UK

Line Management
Salary Trend

3-month moving average salary quoted in jobs citing Line Management.

Salary trend for Line Management in the UK

Line Management
Salary Histogram

Salary distribution for jobs citing Line Management over the 6 months to 29 May 2025.

Salary histogram for Line Management in the UK

Line Management
Top 16 Job Locations

The table below looks at the demand and provides a guide to the median salaries quoted in IT jobs citing Line Management within the UK over the 6 months to 29 May 2025. The 'Rank Change' column provides an indication of the change in demand within each location based on the same 6 month period last year.

Location Rank Change
on Same Period
Last Year
Matching
Permanent
IT Job Ads
Median Salary
Past 6 Months
Median Salary
% Change
on Same Period
Last Year
Live
Jobs
England +50 2,048 £54,793 +0.17% 1,365
UK excluding London +69 1,833 £52,600 +10.74% 1,299
North of England +88 1,139 £54,793 +4.37% 329
North West +89 988 £56,000 +7.69% 136
Work from Home +46 957 £54,282 -7.68% 675
London -84 249 £78,500 +4.79% 245
South East +17 243 £50,250 +5.79% 393
Midlands +6 167 £62,500 +41.74% 208
South West +46 147 £52,600 +9.60% 147
Yorkshire +43 146 £25,625 -51.19% 153
West Midlands +6 103 £60,000 +29.03% 127
East of England -44 74 £62,000 +73.15% 167
East Midlands +26 64 £65,000 +62.50% 71
Scotland +66 52 £52,207 +4.41% 52
Wales +7 14 £60,000 +41.18% 33
North East -7 5 £45,000 +2.06% 42

Line Management
Co-occurring Skills and Capabilities by Category

The follow tables expand on the table above by listing co-occurrences grouped by category. The same employment type, locality and period is covered with up to 20 co-occurrences shown in each of the following categories:

Application Platforms
1 23 (1.06%) Microsoft Exchange
2 20 (0.92%) SharePoint
3 16 (0.74%) WordPress
4 7 (0.32%) CMS
4 7 (0.32%) Confluence
5 3 (0.14%) Apache Airflow
5 3 (0.14%) OpenEdge
5 3 (0.14%) SharePoint Server
6 2 (0.092%) Apache
6 2 (0.092%) BizTalk Server
6 2 (0.092%) ColdFusion
6 2 (0.092%) MTS
7 1 (0.046%) Adobe Experience Manager
7 1 (0.046%) Apache Spark
7 1 (0.046%) IIS
7 1 (0.046%) Luigi
7 1 (0.046%) Sitecore CMS
7 1 (0.046%) Tomcat
Applications
1 89 (4.09%) Microsoft Office
2 54 (2.48%) Microsoft Excel
3 25 (1.15%) Simulink
4 13 (0.60%) Microsoft PowerPoint
5 6 (0.28%) MS Visio
6 5 (0.23%) Adobe Creative Suite
7 4 (0.18%) Adobe Illustrator
7 4 (0.18%) Photoshop
8 3 (0.14%) InDesign
8 3 (0.14%) Trello
9 2 (0.092%) Adobe Premiere
9 2 (0.092%) Spreadsheet
10 1 (0.046%) Final Cut Pro
10 1 (0.046%) Microsoft Project
10 1 (0.046%) Revit
Business Applications
1 12 (0.55%) Dynamics CRM
2 8 (0.37%) Magento
2 8 (0.37%) Shopify
3 6 (0.28%) Raiser’s Edge
4 4 (0.18%) Adobe Campaign
5 3 (0.14%) Dynamics GP
5 3 (0.14%) Salesforce CRM
5 3 (0.14%) SAP Business One
5 3 (0.14%) Sparx Enterprise Architect
6 2 (0.092%) Infor M3
7 1 (0.046%) Distributed Ledger
7 1 (0.046%) Maximo
7 1 (0.046%) Oracle ERP
7 1 (0.046%) Oracle Payables
7 1 (0.046%) Remedy ITSM
7 1 (0.046%) Sprinklr
Cloud Services
1 222 (10.21%) AWS
2 168 (7.73%) Azure
3 83 (3.82%) Microsoft 365
4 50 (2.30%) Amazon EKS
5 49 (2.25%) AWS CloudFormation
6 46 (2.12%) SaaS
7 39 (1.79%) Power Platform
8 22 (1.01%) Serverless
9 19 (0.87%) Dynamics 365
10 17 (0.78%) AWS Lambda
10 17 (0.78%) Azure DevOps
11 16 (0.74%) Entra ID
12 15 (0.69%) AWS Step Functions
13 14 (0.64%) Amazon CloudWatch
13 14 (0.64%) Amazon SQS
13 14 (0.64%) AWS CodeBuild
13 14 (0.64%) AWS CodeDeploy
13 14 (0.64%) AWS CodePipeline
13 14 (0.64%) Boomi
13 14 (0.64%) Salsify
Communications & Networking
1 673 (30.96%) VPN
2 413 (19.00%) DNS
3 262 (12.05%) Cisco IOS
4 29 (1.33%) Firewall
5 22 (1.01%) WAN
6 20 (0.92%) Internet
6 20 (0.92%) Network Security
7 17 (0.78%) TCP/IP
8 13 (0.60%) LAN
9 11 (0.51%) OSPF
10 10 (0.46%) HTTP
10 10 (0.46%) Wi-Fi
11 9 (0.41%) DHCP
12 8 (0.37%) FTP
12 8 (0.37%) SMTP
13 7 (0.32%) SSH
13 7 (0.32%) VLAN
13 7 (0.32%) Wireless
14 6 (0.28%) RIP
14 6 (0.28%) SNMP
Database & Business Intelligence
1 50 (2.30%) Elasticsearch
2 25 (1.15%) Power BI
3 22 (1.01%) SQL Server
4 21 (0.97%) Metadata
5 19 (0.87%) Relational Database
6 18 (0.83%) Big Data
7 10 (0.46%) Data Warehouse
8 8 (0.37%) SQL Server Reporting Services
9 7 (0.32%) PostgreSQL
10 3 (0.14%) Semantic Layer
10 3 (0.14%) SQL Server Integration Services
11 2 (0.092%) Data Lake
11 2 (0.092%) MySQL
11 2 (0.092%) NoSQL
12 1 (0.046%) Amazon Aurora
12 1 (0.046%) Azkaban
12 1 (0.046%) BigQuery
12 1 (0.046%) Looker
12 1 (0.046%) Presto
12 1 (0.046%) SAP HANA
Development Applications
1 21 (0.97%) JIRA
2 19 (0.87%) Jenkins
3 17 (0.78%) Git
4 8 (0.37%) Maven
5 4 (0.18%) Balsamiq
6 3 (0.14%) Bitbucket
6 3 (0.14%) ERwin
6 3 (0.14%) TeamCity
7 2 (0.092%) JUnit
7 2 (0.092%) Octopus Deploy
7 2 (0.092%) Subversion
7 2 (0.092%) Team Foundation Server
8 1 (0.046%) Atlassian Bamboo
8 1 (0.046%) Eclipse
8 1 (0.046%) GitLab
8 1 (0.046%) Snyk
8 1 (0.046%) Visual Studio
8 1 (0.046%) WaveMaker
General
1 1,078 (49.59%) Inclusion and Diversity
2 803 (36.94%) Analytical Skills
3 695 (31.97%) Finance
4 490 (22.54%) Social Skills
5 366 (16.84%) Law
6 331 (15.23%) Legal
7 148 (6.81%) Presentation Skills
8 101 (4.65%) Organisational Skills
9 98 (4.51%) Banking
10 76 (3.50%) Marketing
11 56 (2.58%) Retail
12 47 (2.16%) Public Sector
13 45 (2.07%) Financial Institution
14 33 (1.52%) Esports
15 25 (1.15%) Aerospace
16 19 (0.87%) Local Government
17 16 (0.74%) Police
17 16 (0.74%) Telecoms
18 14 (0.64%) Manufacturing
19 13 (0.60%) Publishing
Job Titles
1 490 (22.54%) Developer
2 458 (21.07%) Software Developer
3 272 (12.51%) Infrastructure Engineer
4 218 (10.03%) Lead
5 188 (8.65%) Senior
6 142 (6.53%) IT Support
7 118 (5.43%) Systems Engineer
8 98 (4.51%) Senior Systems Engineer
9 69 (3.17%) Team Leader
10 54 (2.48%) Project Manager
11 51 (2.35%) Product Manager
12 49 (2.25%) Senior Manager
13 40 (1.84%) Lead Systems Engineer
14 33 (1.52%) Credit Risk Manager
14 33 (1.52%) Risk Manager
15 27 (1.24%) Analyst
16 25 (1.15%) Administrator
16 25 (1.15%) Delivery Project Manager
16 25 (1.15%) Programme Manager
17 24 (1.10%) IT Manager
Libraries, Frameworks & Software Standards
1 262 (12.05%) Elastic Stack
2 91 (4.19%) .NET
3 60 (2.76%) Software Packaging
4 56 (2.58%) Node.js
5 49 (2.25%) Pandas
6 27 (1.24%) HTML
7 26 (1.20%) RESTful
8 22 (1.01%) CSS
8 22 (1.01%) React
9 17 (0.78%) .NET Core
9 17 (0.78%) OAuth
10 14 (0.64%) EDI
10 14 (0.64%) JWT
11 11 (0.51%) AngularJS
12 9 (0.41%) REST
13 8 (0.37%) Android Jetpack
13 8 (0.37%) Jetpack Compose
13 8 (0.37%) LDAP
14 7 (0.32%) Lambda Expressions
15 6 (0.28%) WinForms
Miscellaneous
1 993 (45.68%) Cyberattack
2 139 (6.39%) Enterprise Software
3 96 (4.42%) Management Information System
4 75 (3.45%) Social Media
5 63 (2.90%) Product Ownership
6 34 (1.56%) Self-Motivation
7 33 (1.52%) Credit Risk
8 28 (1.29%) Virtual Team
9 25 (1.15%) Onboarding
10 20 (0.92%) Data Protection Act
10 20 (0.92%) FMCG
11 19 (0.87%) PMI
12 16 (0.74%) Taxonomies
13 15 (0.69%) Driving Licence
13 15 (0.69%) Mobile App
14 11 (0.51%) NHS
14 11 (0.51%) Online Banking
15 10 (0.46%) Cloud Native
15 10 (0.46%) Security Operations Centre
16 8 (0.37%) EPoS
Operating Systems
1 717 (32.98%) Android
1 717 (32.98%) Linux
2 490 (22.54%) Windows
3 33 (1.52%) Windows Vista
4 13 (0.60%) Windows Server
5 12 (0.55%) Windows 10
6 9 (0.41%) Mac OS
7 7 (0.32%) Apple iOS
8 6 (0.28%) Windows Server 2016
9 5 (0.23%) Windows Server 2019
10 2 (0.092%) Unix
11 1 (0.046%) Debian
11 1 (0.046%) Robot Operating System
11 1 (0.046%) Solaris
11 1 (0.046%) Ubuntu
Processes & Methodologies
1 969 (44.57%) Mathematics
2 730 (33.58%) Agile
3 516 (23.74%) Problem-Solving
4 454 (20.88%) Android Development
5 453 (20.84%) Design Patterns
6 447 (20.56%) OO
6 447 (20.56%) OOP
7 390 (17.94%) Cybersecurity
8 361 (16.61%) DevOps
9 359 (16.51%) Risk Management
10 296 (13.62%) Creative Thinking
11 276 (12.70%) Infrastructure Engineering
12 268 (12.33%) Platform Engineering
13 263 (12.10%) Task Automation
14 262 (12.05%) Storage Management
15 205 (9.43%) Project Management
16 196 (9.02%) Software Engineering
17 177 (8.14%) Continuous Improvement
18 143 (6.58%) Artificial Intelligence
19 139 (6.39%) Coaching
Programming Languages
1 739 (33.99%) Python
2 505 (23.23%) Java
3 456 (20.98%) C++
4 449 (20.65%) Go
5 280 (12.88%) PowerShell
6 273 (12.56%) Bash
7 86 (3.96%) JavaScript
8 71 (3.27%) C#
9 70 (3.22%) Rust
10 49 (2.25%) SQL
11 19 (0.87%) TypeScript
12 18 (0.83%) C
13 15 (0.69%) PHP
14 8 (0.37%) Delphi
14 8 (0.37%) Kotlin
15 7 (0.32%) Ruby
16 6 (0.28%) Perl
17 4 (0.18%) T-SQL
18 3 (0.14%) Apex Code
18 3 (0.14%) Progress 4GL
Qualifications
1 524 (24.10%) Security Cleared
2 488 (22.45%) DV Cleared
3 278 (12.79%) Degree
4 82 (3.77%) DBS Check
5 65 (2.99%) BPSS Clearance
6 36 (1.66%) SC Cleared
7 21 (0.97%) PMI Certification
8 16 (0.74%) HND
9 8 (0.37%) Computer Science Degree
9 8 (0.37%) Master's Degree
9 8 (0.37%) Microsoft Certification
10 6 (0.28%) CISSP
10 6 (0.28%) PRINCE2 Practitioner
11 5 (0.23%) Azure Certification
11 5 (0.23%) Chartered Engineer
11 5 (0.23%) CISM
11 5 (0.23%) MCSE
11 5 (0.23%) PMP
12 4 (0.18%) AWS Certification
13 3 (0.14%) CSPO
Quality Assurance & Compliance
1 286 (13.16%) NCSC
2 47 (2.16%) Accessibility
3 34 (1.56%) QA
4 33 (1.52%) SLA
5 30 (1.38%) GDPR
6 24 (1.10%) Data Quality
7 15 (0.69%) PMO
8 13 (0.60%) ISO/IEC 27001
9 11 (0.51%) WCAG
10 8 (0.37%) NIST
11 4 (0.18%) ISO 9001
11 4 (0.18%) Sarbanes-Oxley
12 3 (0.14%) PCI DSS
13 2 (0.092%) GRC
13 2 (0.092%) PERC
14 1 (0.046%) COBIT
14 1 (0.046%) ECSS
14 1 (0.046%) ITGC
System Software
1 728 (33.49%) Docker
2 269 (12.37%) Hyper-V
3 262 (12.05%) VMware NSX
3 262 (12.05%) vSphere
4 65 (2.99%) Active Directory
5 16 (0.74%) Virtual Machines
6 7 (0.32%) VMware Infrastructure
7 5 (0.23%) BitLocker
7 5 (0.23%) Firmware
8 3 (0.14%) Virtual Desktop
9 1 (0.046%) LXC
9 1 (0.046%) Microsoft App-V
9 1 (0.046%) Samba
9 1 (0.046%) Snort
9 1 (0.046%) Virtual Servers
Systems Management
1 716 (32.93%) Ansible
2 337 (15.50%) Terraform
3 71 (3.27%) Kubernetes
4 19 (0.87%) Microsoft Intune
5 10 (0.46%) SCCM
6 6 (0.28%) QRadar
6 6 (0.28%) Single Sign-On
7 5 (0.23%) FortiGate
7 5 (0.23%) WSUS
8 3 (0.14%) Progress Chef
9 2 (0.092%) Autotask
9 2 (0.092%) Puppet
10 1 (0.046%) Active Directory Federation Services
10 1 (0.046%) Failover Clustering
10 1 (0.046%) Grafana
10 1 (0.046%) Systems Management Server (SMS)
Vendors
1 278 (12.79%) Splunk
2 275 (12.65%) Cisco
3 265 (12.19%) Juniper
4 262 (12.05%) 3PAR
5 248 (11.41%) Microsoft
6 47 (2.16%) SAP
7 33 (1.52%) Avaloq
8 28 (1.29%) Google
9 25 (1.15%) MathWorks
9 25 (1.15%) Salesforce
10 19 (0.87%) Adobe
10 19 (0.87%) ServiceNow
11 18 (0.83%) VMware
12 15 (0.69%) Informatica
13 14 (0.64%) Apple
13 14 (0.64%) MuleSoft
13 14 (0.64%) Oracle
14 8 (0.37%) HP
14 8 (0.37%) JD Edwards
15 7 (0.32%) Databricks