Performance Optimisation Jobs

Performance Optimisation
UK

The table below provides summary statistics for permanent job vacancies requiring Performance Optimisation skills. It includes a benchmarking guide to the annual salaries offered in vacancies that cited Performance Optimisation over the 6 months leading up to 30 May 2025, comparing them to the same period in the previous two years.

6 months to
30 May 2025
Same period 2024 Same period 2023
Rank 190 529 703
Rank change year-on-year +339 +174 +35
Permanent jobs citing Performance Optimisation 953 418 261
As % of all permanent jobs advertised in the UK 1.72% 0.40% 0.27%
As % of the Processes & Methodologies category 1.84% 0.48% 0.28%
Number of salaries quoted 375 323 148
10th Percentile £49,484 £38,250 £45,500
25th Percentile £56,250 £48,750 £53,750
Median annual salary (50th Percentile) £69,315 £62,500 £70,000
Median % change year-on-year +10.90% -10.71% +12.90%
75th Percentile £81,250 £81,250 £83,750
90th Percentile £87,500 £97,000 £95,000
UK excluding London median annual salary £69,315 £60,000 £62,500
% change year-on-year +15.53% -4.00% +2.39%

All Process and Methodology Skills
UK

Performance Optimisation falls under the Processes and Methodologies category. For comparison with the information above, the following table provides summary statistics for all permanent job vacancies requiring process or methodology skills.

Permanent vacancies with a requirement for process or methodology skills 51,902 86,889 92,846
As % of all permanent jobs advertised in the UK 93.67% 84.13% 95.56%
Number of salaries quoted 25,611 60,763 54,796
10th Percentile £28,822 £29,250 £34,000
25th Percentile £41,250 £40,000 £45,000
Median annual salary (50th Percentile) £57,443 £55,000 £60,899
Median % change year-on-year +4.44% -9.69% +1.50%
75th Percentile £75,000 £72,500 £81,250
90th Percentile £97,500 £92,500 £100,000
UK excluding London median annual salary £51,574 £50,000 £55,000
% change year-on-year +3.15% -9.09% +4.76%

Performance Optimisation
Job Vacancy Trend

Job postings citing Performance Optimisation as a proportion of all IT jobs advertised.
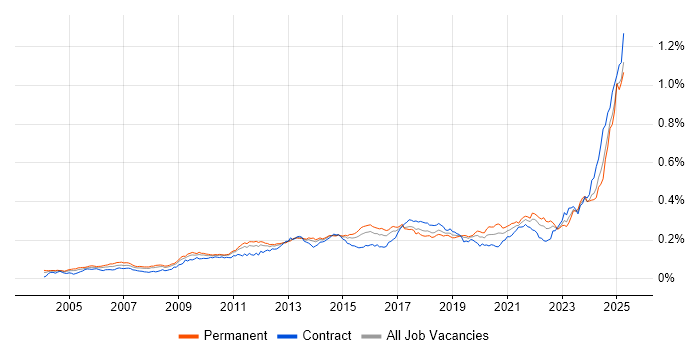
Job vacancy trend for Performance Optimisation in the UK

Performance Optimisation
Salary Trend

3-month moving average salary quoted in jobs citing Performance Optimisation.

Salary trend for Performance Optimisation in the UK

Performance Optimisation
Salary Histogram

Salary distribution for jobs citing Performance Optimisation over the 6 months to 30 May 2025.

Salary histogram for Performance Optimisation in the UK

Performance Optimisation
Top 16 Job Locations

The table below looks at the demand and provides a guide to the median salaries quoted in IT jobs citing Performance Optimisation within the UK over the 6 months to 30 May 2025. The 'Rank Change' column provides an indication of the change in demand within each location based on the same 6 month period last year.

Location Rank Change
on Same Period
Last Year
Matching
Permanent
IT Job Ads
Median Salary
Past 6 Months
Median Salary
% Change
on Same Period
Last Year
Live
Jobs
England +308 854 £69,315 +10.90% 2,475
Work from Home +302 626 £75,000 +7.14% 1,419
UK excluding London +312 624 £69,315 +15.53% 2,528
North of England +203 297 £69,315 +15.53% 561
North West +161 274 £69,315 +2.69% 259
London +154 183 £75,000 - 251
South East +111 91 £82,500 +50.68% 700
Midlands +139 88 £40,000 -36.00% 480
East of England +94 66 £58,250 +1.30% 388
Scotland +143 54 £56,250 +7.14% 92
East Midlands +86 48 £52,500 -40.00% 189
West Midlands +72 40 £40,000 -36.00% 259
South West +78 24 £70,000 +40.00% 288
Yorkshire +59 12 £60,000 +4.35% 235
North East +41 11 £60,000 +9.09% 69
Wales +43 5 £52,000 +11.58% 70

Performance Optimisation
Co-occurring Skills and Capabilities by Category

The follow tables expand on the table above by listing co-occurrences grouped by category. The same employment type, locality and period is covered with up to 20 co-occurrences shown in each of the following categories:

Application Platforms
1 160 (16.79%) Confluence
2 15 (1.57%) Microsoft Exchange
3 13 (1.36%) Apache Spark
3 13 (1.36%) WordPress
4 11 (1.15%) Apache
5 9 (0.94%) CMS
6 6 (0.63%) SharePoint
7 5 (0.52%) Headless CMS
8 4 (0.42%) Apache Airflow
9 2 (0.21%) IIS
10 1 (0.10%) CICS
10 1 (0.10%) Drupal
10 1 (0.10%) nginx
10 1 (0.10%) Umbraco
Applications
1 10 (1.05%) Photoshop
2 5 (0.52%) Simulink
3 3 (0.31%) Chatbot
4 2 (0.21%) Adobe Illustrator
5 1 (0.10%) Adobe After Effects
5 1 (0.10%) Adobe Creative Suite
5 1 (0.10%) Adobe XD
5 1 (0.10%) Elementor
5 1 (0.10%) InDesign
5 1 (0.10%) Microsoft Excel
5 1 (0.10%) Microsoft Office
5 1 (0.10%) Sketch
Business Applications
1 9 (0.94%) Dynamics CRM
1 9 (0.94%) NetSuite
2 4 (0.42%) Payment Gateway
3 2 (0.21%) SAP S/4HANA
4 1 (0.10%) Magento
Cloud Services
1 569 (59.71%) AWS
2 399 (41.87%) Azure
3 215 (22.56%) Pulumi
4 203 (21.30%) GCP
5 45 (4.72%) Azure DevOps
6 36 (3.78%) Serverless
7 34 (3.57%) Azure Service Bus
8 32 (3.36%) Azure Cosmos DB
9 30 (3.15%) Power Platform
9 30 (3.15%) SonarCloud
10 27 (2.83%) Google Analytics
10 27 (2.83%) Snowflake
11 22 (2.31%) GitHub
12 20 (2.10%) AWS Lambda
12 20 (2.10%) Azure Logic Apps
12 20 (2.10%) PowerApps
13 19 (1.99%) Cloud Computing
13 19 (1.99%) Power Automate
14 17 (1.78%) Amazon S3
15 16 (1.68%) Adobe Analytics
Communications & Networking
1 215 (22.56%) Broadband
2 21 (2.20%) Firewall
3 17 (1.78%) WAN
4 11 (1.15%) OSPF
5 10 (1.05%) BGP
5 10 (1.05%) Network Security
5 10 (1.05%) SAN
5 10 (1.05%) VPN
6 8 (0.84%) LAN
6 8 (0.84%) SD-WAN
7 7 (0.73%) DNS
7 7 (0.73%) MPLS
7 7 (0.73%) VSAN
8 6 (0.63%) DHCP
8 6 (0.63%) IPsec
8 6 (0.63%) Wireless
9 5 (0.52%) Intrusion Detection
9 5 (0.52%) NAS
9 5 (0.52%) VLAN
10 2 (0.21%) Cisco ISE
Database & Business Intelligence
1 303 (31.79%) SQL Server
2 244 (25.60%) NoSQL
3 232 (24.34%) Relational Database
4 216 (22.67%) RDBMS
5 31 (3.25%) Elasticsearch
6 27 (2.83%) MongoDB
7 26 (2.73%) Data Warehouse
8 20 (2.10%) Tableau
9 18 (1.89%) MySQL
9 18 (1.89%) PostgreSQL
10 16 (1.68%) Data Lake
11 15 (1.57%) DynamoDB
11 15 (1.57%) Power BI
12 14 (1.47%) Amazon RDS
13 13 (1.36%) Amazon Redshift
14 12 (1.26%) BigQuery
15 10 (1.05%) Hadoop
16 8 (0.84%) Big Data
16 8 (0.84%) SQL Server Integration Services
17 5 (0.52%) Azure SQL Database
Development Applications
1 268 (28.12%) GitLab
2 261 (27.39%) JIRA
3 252 (26.44%) Maven
3 252 (26.44%) Selenium
4 250 (26.23%) Bitbucket
5 248 (26.02%) Cucumber
6 247 (25.92%) SonarQube
6 247 (25.92%) Sonatype Nexus
7 216 (22.67%) Jaeger
8 83 (8.71%) Git
9 30 (3.15%) MSBuild
9 30 (3.15%) Octopus Deploy
9 30 (3.15%) Team Foundation Server
9 30 (3.15%) Visual Studio
10 21 (2.20%) Jenkins
11 8 (0.84%) CircleCI
12 5 (0.52%) Gradle
12 5 (0.52%) Oracle Forms
12 5 (0.52%) Vite
13 4 (0.42%) webpack
General
1 486 (51.00%) Inclusion and Diversity
2 318 (33.37%) Finance
3 272 (28.54%) Banking
4 260 (27.28%) Social Skills
5 124 (13.01%) Retail
6 97 (10.18%) Investment Banking
7 90 (9.44%) Corporate Banking
8 56 (5.88%) Analytical Skills
9 47 (4.93%) Marketing
10 38 (3.99%) Law
11 18 (1.89%) Advertising
12 14 (1.47%) Public Sector
13 8 (0.84%) Police
14 7 (0.73%) Games
14 7 (0.73%) Organisational Skills
15 6 (0.63%) Back Office
15 6 (0.63%) Front Office
16 4 (0.42%) Aerospace
16 4 (0.42%) Electronics
16 4 (0.42%) Manufacturing
Job Titles
1 277 (29.07%) Software Engineer
2 264 (27.70%) Lead
3 218 (22.88%) Team Leader
4 121 (12.70%) Commissioning Manager
5 109 (11.44%) Developer
6 70 (7.35%) Senior
7 61 (6.40%) Architect
8 39 (4.09%) Senior Developer
9 35 (3.67%) Technical Architect
10 32 (3.36%) Cloud Engineer
11 26 (2.73%) Infrastructure Engineer
12 24 (2.52%) Data Engineer
13 23 (2.41%) Cloud Infrastructure Engineer
14 18 (1.89%) Azure Engineer
15 16 (1.68%) Front-End Developer (Client-Side Developer)
16 15 (1.57%) Software Developer
17 14 (1.47%) Azure Infrastructure Engineer
17 14 (1.47%) Data Scientist
17 14 (1.47%) DevOps Engineer
17 14 (1.47%) Senior Data Scientist
Libraries, Frameworks & Software Standards
1 334 (35.05%) CSS
2 331 (34.73%) HTML
3 293 (30.75%) React
4 276 (28.96%) Kafka
5 261 (27.39%) Spring
6 258 (27.07%) Redux
7 256 (26.86%) Spring Boot
8 250 (26.23%) JPA
9 221 (23.19%) Elastic Stack
9 221 (23.19%) OpenTelemetry
10 162 (17.00%) Hibernate
11 132 (13.85%) RESTful
12 131 (13.75%) REST
13 105 (11.02%) HTML5
14 104 (10.91%) CSS3
15 101 (10.60%) Jest
16 95 (9.97%) Sass
17 70 (7.35%) .NET
18 44 (4.62%) XML
19 40 (4.20%) JSON
Miscellaneous
1 253 (26.55%) Product Ownership
2 252 (26.44%) Enterprise Software
3 38 (3.99%) Cloud Native
4 22 (2.31%) Mobile App
4 22 (2.31%) Self-Motivation
5 18 (1.89%) Virtual Team
6 17 (1.78%) Legacy Systems
7 14 (1.47%) Algorithms
8 12 (1.26%) Social Media
9 11 (1.15%) Management Information System
10 10 (1.05%) Data Structures
11 8 (0.84%) Blockchain
11 8 (0.84%) Distributed Systems
11 8 (0.84%) Web3
12 7 (0.73%) Embedded Systems
12 7 (0.73%) Foreign Exchange (FX)
12 7 (0.73%) IoT
12 7 (0.73%) Learning Management System
13 6 (0.63%) Hybrid Cloud
14 5 (0.52%) Mobile Games
Operating Systems
1 233 (24.45%) Linux
2 218 (22.88%) Unix
3 28 (2.94%) Windows
4 18 (1.89%) Windows Server
5 9 (0.94%) Apple iOS
6 7 (0.73%) Android
7 1 (0.10%) Debian
7 1 (0.10%) Ubuntu
7 1 (0.10%) zOS
Processes & Methodologies
1 589 (61.80%) DevOps
2 565 (59.29%) Agile
3 507 (53.20%) Containerisation
4 356 (37.36%) CI/CD
5 353 (37.04%) Mentoring
6 321 (33.68%) Microservices
7 313 (32.84%) Software Engineering
8 283 (29.70%) Front End Development
9 277 (29.07%) Test Automation
10 263 (27.60%) Full-Stack Development
11 260 (27.28%) Infrastructure as Code
12 257 (26.97%) SDLC
13 244 (25.60%) High Availability
14 239 (25.08%) Roadmaps
15 236 (24.76%) Continuous Integration
16 229 (24.03%) Product Management
17 223 (23.40%) Cost Optimisation
18 220 (23.08%) GitOps
19 216 (22.67%) Task Automation
20 215 (22.56%) Budget Control
Programming Languages
1 566 (59.39%) JavaScript
2 500 (52.47%) Java
3 375 (39.35%) SQL
4 301 (31.58%) Python
5 227 (23.82%) Go
6 220 (23.08%) Bash
7 124 (13.01%) TypeScript
8 62 (6.51%) C#
9 26 (2.73%) PowerShell
10 18 (1.89%) PHP
11 13 (1.36%) C++
12 12 (1.26%) MATLAB
13 8 (0.84%) T-SQL
14 5 (0.52%) Kusto Query Language
14 5 (0.52%) PL/SQL
15 4 (0.42%) C
16 3 (0.31%) Apex Code
16 3 (0.31%) Kotlin
16 3 (0.31%) Scala
17 2 (0.21%) Swift
Qualifications
1 229 (24.03%) AWS Certification
2 197 (20.67%) Degree
3 160 (16.79%) Master's Degree
4 121 (12.70%) MBA
5 113 (11.86%) BPSS Clearance
6 31 (3.25%) Computer Science Degree
7 16 (1.68%) Azure Certification
7 16 (1.68%) Microsoft Certification
8 14 (1.47%) Security Cleared
9 10 (1.05%) AWS Certified Solutions Architect
10 9 (0.94%) DBS Check
10 9 (0.94%) SC Cleared
11 7 (0.73%) CCNP
11 7 (0.73%) Cisco Certification
12 6 (0.63%) CCIE
13 5 (0.52%) VMware Certified Professional (VCP)
14 3 (0.31%) CISSP
14 3 (0.31%) PhD
15 2 (0.21%) DV Cleared
15 2 (0.21%) SAP Certification
Quality Assurance & Compliance
1 274 (28.75%) QA
2 112 (11.75%) Accessibility
3 43 (4.51%) GDPR
4 16 (1.68%) Data Quality
5 13 (1.36%) WCAG
6 10 (1.05%) ISO/IEC 27001
7 6 (0.63%) PCI DSS
8 4 (0.42%) Sarbanes-Oxley
8 4 (0.42%) SLA
9 1 (0.10%) Actionable Recommendations
9 1 (0.10%) California Consumer Privacy Act
9 1 (0.10%) ISO 9001
9 1 (0.10%) NCSC
9 1 (0.10%) NEBOSH
9 1 (0.10%) NIST
System Software
1 549 (57.61%) Docker
2 7 (0.73%) HDFS
3 5 (0.52%) Active Directory
3 5 (0.52%) VMware NSX
4 4 (0.42%) Firmware
5 3 (0.31%) Hyper-V
5 3 (0.31%) VMware Infrastructure
6 2 (0.21%) vSphere
Systems Management
1 519 (54.46%) Kubernetes
2 252 (26.44%) Terraform
3 242 (25.39%) Prometheus
4 228 (23.92%) Ansible
5 220 (23.08%) Argo
6 215 (22.56%) Kustomize
7 15 (1.57%) Grafana
8 11 (1.15%) Single Sign-On
9 10 (1.05%) Progress Chef
10 4 (0.42%) FortiGate
11 2 (0.21%) Kubeflow
11 2 (0.21%) Microsoft Clustering
12 1 (0.10%) Kiali
12 1 (0.10%) Kibana
12 1 (0.10%) Microsoft Intune
12 1 (0.10%) ZABBIX
Vendors
1 268 (28.12%) Google
2 247 (25.92%) Solace
3 78 (8.18%) Microsoft
4 20 (2.10%) Salesforce
5 19 (1.99%) Adobe
6 14 (1.47%) Databricks
6 14 (1.47%) Marketo
6 14 (1.47%) Salesforce Marketing Cloud
7 12 (1.26%) Oracle
8 11 (1.15%) MuleSoft
8 11 (1.15%) SAP
9 8 (0.84%) VMware
10 7 (0.73%) Splunk
11 6 (0.63%) New Relic
12 5 (0.52%) Cisco
12 5 (0.52%) Nimble Storage
13 4 (0.42%) Informatica
13 4 (0.42%) Meraki
13 4 (0.42%) Teradata
14 2 (0.21%) Dell