PostgreSQL Jobs

PostgreSQL (Postgres)
UK

The table below provides summary statistics for permanent job vacancies requiring PostgreSQL skills. It includes a benchmarking guide to the annual salaries offered in vacancies that cited PostgreSQL over the 6 months leading up to 1 May 2025, comparing them to the same period in the previous two years.

6 months to
1 May 2025
Same period 2024 Same period 2023
Rank 231 142 186
Rank change year-on-year -89 +44 -112
Permanent jobs citing PostgreSQL 679 2,019 2,071
As % of all permanent jobs advertised in the UK 1.30% 2.05% 1.99%
As % of the Database & Business Intelligence category 9.14% 11.10% 9.27%
Number of salaries quoted 519 1,188 1,258
10th Percentile £47,446 £42,500 £42,500
25th Percentile £59,000 £47,500 £52,500
Median annual salary (50th Percentile) £75,000 £65,000 £70,000
Median % change year-on-year +15.38% -7.14% -
75th Percentile £97,987 £87,500 £92,500
90th Percentile £137,500 £110,000 £110,000
UK excluding London median annual salary £65,000 £55,000 £57,500
% change year-on-year +18.18% -4.35% -8.00%

All Database and Business Intelligence Skills
UK

PostgreSQL falls under the Databases and Business Intelligence category. For comparison with the information above, the following table provides summary statistics for all permanent job vacancies requiring database or business intelligence skills.

Permanent vacancies with a requirement for database or business intelligence skills 7,431 18,186 22,342
As % of all permanent jobs advertised in the UK 14.28% 18.47% 21.50%
Number of salaries quoted 5,213 12,623 13,902
10th Percentile £37,500 £35,000 £37,500
25th Percentile £47,500 £42,725 £47,500
Median annual salary (50th Percentile) £62,500 £57,500 £65,000
Median % change year-on-year +8.70% -11.54% +8.33%
75th Percentile £83,750 £76,250 £83,750
90th Percentile £115,000 £95,000 £103,750
UK excluding London median annual salary £55,000 £52,500 £55,000
% change year-on-year +4.76% -4.55% +4.76%

PostgreSQL
Job Vacancy Trend

Job postings citing PostgreSQL as a proportion of all IT jobs advertised.
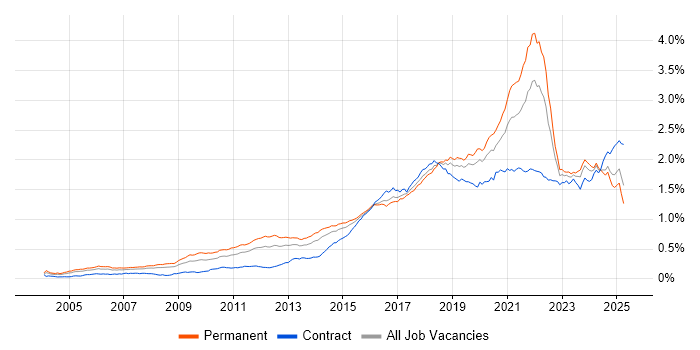
Job vacancy trend for PostgreSQL in the UK

PostgreSQL
Salary Trend

3-month moving average salary quoted in jobs citing PostgreSQL.

Salary trend for PostgreSQL in the UK

PostgreSQL
Salary Histogram

Salary distribution for jobs citing PostgreSQL over the 6 months to 1 May 2025.

Salary histogram for PostgreSQL in the UK

PostgreSQL
Top 17 Job Locations

The table below looks at the demand and provides a guide to the median salaries quoted in IT jobs citing PostgreSQL within the UK over the 6 months to 1 May 2025. The 'Rank Change' column provides an indication of the change in demand within each location based on the same 6 month period last year.

Location Rank Change
on Same Period
Last Year
Matching
Permanent
IT Job Ads
Median Salary
Past 6 Months
Median Salary
% Change
on Same Period
Last Year
Live
Jobs
England -85 591 £75,000 +15.38% 875
London -14 344 £87,500 +9.38% 544
UK excluding London -118 340 £65,000 +18.18% 484
Work from Home -41 311 £70,000 +7.69% 670
South East -29 114 £67,500 +17.39% 192
North of England -114 77 £67,500 +22.73% 140
North West -120 52 £67,626 +28.81% 108
East of England +19 36 £55,000 -15.38% 46
Scotland +54 33 £66,367 +32.73% 18
Midlands -72 31 £65,000 +30.00% 43
South West +36 30 £65,000 +8.33% 49
Wales +18 27 £65,000 +27.32% 9
West Midlands +4 22 £65,000 +30.00% 23
Yorkshire +9 19 £59,869 +8.85% 28
East Midlands -64 9 £70,000 +40.00% 17
Northern Ireland +2 7 £55,000 -26.67% 5
North East +13 6 £69,384 +5.99% 4

PostgreSQL
Co-occurring Skills and Capabilities by Category

The follow tables expand on the table above by listing co-occurrences grouped by category. The same employment type, locality and period is covered with up to 20 co-occurrences shown in each of the following categories:

Application Platforms
1 48 (7.07%) Apache Airflow
2 30 (4.42%) Confluence
3 15 (2.21%) CMS
4 14 (2.06%) Apache Spark
4 14 (2.06%) nginx
4 14 (2.06%) Tomcat
5 13 (1.91%) JBoss
6 12 (1.77%) Red Hat Fuse
7 7 (1.03%) Headless CMS
7 7 (1.03%) OpenStack
7 7 (1.03%) WordPress
8 6 (0.88%) SharePoint
9 5 (0.74%) Apache
9 5 (0.74%) IIS
10 3 (0.44%) Microsoft Exchange
10 3 (0.44%) SAS
11 2 (0.29%) Jupyter
12 1 (0.15%) Camunda
12 1 (0.15%) Sitefinity
12 1 (0.15%) Strapi
Applications
1 5 (0.74%) Microsoft Office
2 4 (0.59%) Microsoft Excel
3 2 (0.29%) MS Visio
4 1 (0.15%) Spreadsheet
Business Applications
1 3 (0.44%) Dynamics CRM
2 1 (0.15%) Odoo
2 1 (0.15%) Salesforce CRM
2 1 (0.15%) SAP Business One
Cloud Services
1 400 (58.91%) AWS
2 185 (27.25%) Azure
3 161 (23.71%) GCP
4 83 (12.22%) Serverless
5 67 (9.87%) Amazon EC2
6 63 (9.28%) GitHub
7 60 (8.84%) Amazon ECS
8 54 (7.95%) dbt
9 51 (7.51%) Amazon S3
10 50 (7.36%) Amazon EKS
11 48 (7.07%) SaaS
12 34 (5.01%) Power Platform
13 32 (4.71%) GitHub Actions
14 29 (4.27%) Amazon SQS
14 29 (4.27%) AWS Lambda
15 28 (4.12%) Azure DevOps
16 20 (2.95%) Amazon ElastiCache
17 19 (2.80%) Amazon OpenSearch
18 17 (2.50%) AWS CloudFormation
18 17 (2.50%) Cloud Computing
Communications & Networking
1 19 (2.80%) TCP/IP
2 18 (2.65%) Network Security
3 13 (1.91%) Internet
4 11 (1.62%) DNS
5 10 (1.47%) MQTT
6 8 (1.18%) SSL
6 8 (1.18%) VPN
7 6 (0.88%) Bluetooth
7 6 (0.88%) DHCP
7 6 (0.88%) Firewall
7 6 (0.88%) SAN
8 5 (0.74%) Modbus
8 5 (0.74%) NAS
8 5 (0.74%) SMS
8 5 (0.74%) VSAN
9 4 (0.59%) DMARC
10 2 (0.29%) Broadband
10 2 (0.29%) Wireshark
11 1 (0.15%) LAN
11 1 (0.15%) OpenVPN
Database & Business Intelligence
1 129 (19.00%) MySQL
2 125 (18.41%) MongoDB
3 121 (17.82%) Relational Database
4 120 (17.67%) SQL Server
5 85 (12.52%) NoSQL
6 50 (7.36%) RDBMS
7 48 (7.07%) Amazon RDS
8 42 (6.19%) Amazon Athena
9 40 (5.89%) Redis
10 37 (5.45%) Apache Arrow
10 37 (5.45%) Apache Iceberg
10 37 (5.45%) Dremio
10 37 (5.45%) Elasticsearch
11 27 (3.98%) Power BI
12 18 (2.65%) Amazon Aurora
13 15 (2.21%) Data Warehouse
14 14 (2.06%) Data Lake
14 14 (2.06%) DynamoDB
14 14 (2.06%) Tableau
15 11 (1.62%) Big Data
Development Applications
1 139 (20.47%) Git
2 112 (16.49%) Jenkins
3 56 (8.25%) JUnit
4 48 (7.07%) GitLab
4 48 (7.07%) JIRA
5 38 (5.60%) Mockito
6 29 (4.27%) Maven
7 27 (3.98%) SonarQube
8 23 (3.39%) JMeter
9 19 (2.80%) Bitbucket
9 19 (2.80%) Postman
10 18 (2.65%) IntelliJ
11 15 (2.21%) Selenium
12 11 (1.62%) Gradle
13 10 (1.47%) Visual Studio
14 9 (1.33%) Oracle Forms
14 9 (1.33%) Robot Framework
14 9 (1.33%) TestNG
15 8 (1.18%) Cucumber
16 7 (1.03%) Atlassian Bamboo
General
1 198 (29.16%) Social Skills
2 176 (25.92%) Finance
3 83 (12.22%) Front Office
4 76 (11.19%) Public Sector
5 56 (8.25%) Analytical Skills
6 50 (7.36%) Banking
7 37 (5.45%) Inclusion and Diversity
8 24 (3.53%) Manufacturing
9 21 (3.09%) Marketing
10 18 (2.65%) Games
11 16 (2.36%) Law
12 15 (2.21%) Retail
12 15 (2.21%) Telecoms
13 12 (1.77%) Legal
13 12 (1.77%) Presentation Skills
14 11 (1.62%) Electronics
14 11 (1.62%) Pharmaceutical
15 10 (1.47%) Tech for Good
16 9 (1.33%) Documentation Skills
16 9 (1.33%) Organisational Skills
Job Titles
1 303 (44.62%) Developer
2 160 (23.56%) Software Engineer
3 152 (22.39%) Senior
4 79 (11.63%) Lead
5 73 (10.75%) Java Developer
6 67 (9.87%) Developer/Software Engineer
7 60 (8.84%) Senior Developer
8 56 (8.25%) Python Developer
9 54 (7.95%) Full-Stack Developer
10 50 (7.36%) AWS Engineer
11 49 (7.22%) Java Engineer
12 42 (6.19%) AWS Developer
13 40 (5.89%) AWS Software Engineer
14 37 (5.45%) React Developer
15 35 (5.15%) Senior Software Engineer
16 33 (4.86%) Full-Stack Engineer
17 29 (4.27%) Python Engineer
18 27 (3.98%) Python Software Engineer
19 25 (3.68%) Team Leader
20 24 (3.53%) Data Engineer
Libraries, Frameworks & Software Standards
1 263 (38.73%) React
2 166 (24.45%) Node.js
3 157 (23.12%) REST
4 113 (16.64%) RESTful
5 106 (15.61%) AngularJS
6 95 (13.99%) Spring
7 86 (12.67%) .NET
8 83 (12.22%) Spring Boot
9 80 (11.78%) HTML
10 74 (10.90%) Django
11 73 (10.75%) Kafka
12 70 (10.31%) Vue
13 67 (9.87%) Web Services
14 66 (9.72%) CSS
15 42 (6.19%) Pandas
16 40 (5.89%) NumPy
17 38 (5.60%) SciPy
18 37 (5.45%) Hibernate
19 36 (5.30%) Next.js
20 34 (5.01%) FastAPI
Miscellaneous
1 66 (9.72%) Distributed Systems
1 66 (9.72%) Fixed Income
2 42 (6.19%) Cloud Native
3 34 (5.01%) Foreign Exchange (FX)
4 33 (4.86%) Equities
5 31 (4.57%) IoT
6 25 (3.68%) Mobile App
7 17 (2.50%) Self-Motivation
8 16 (2.36%) Algorithms
8 16 (2.36%) Product Ownership
9 15 (2.21%) Onboarding
10 12 (1.77%) Legacy Systems
11 11 (1.62%) Greenfield Project
12 10 (1.47%) Management Information System
13 9 (1.33%) Hybrid Cloud
13 9 (1.33%) Life Science
14 8 (1.18%) Enterprise Software
15 7 (1.03%) Renewable Energy
16 6 (0.88%) Embedded Systems
16 6 (0.88%) Public Cloud
Operating Systems
1 134 (19.73%) Linux
2 53 (7.81%) Unix
3 45 (6.63%) Windows
4 9 (1.33%) Rocky
5 6 (0.88%) Ubuntu
6 5 (0.74%) Apple iOS
7 4 (0.59%) Red Hat Enterprise Linux
7 4 (0.59%) Windows Server
8 3 (0.44%) Debian
8 3 (0.44%) VMS
9 2 (0.29%) Android
10 1 (0.15%) Windows 10
10 1 (0.15%) Windows Server 2012
Processes & Methodologies
1 331 (48.75%) Agile
2 244 (35.94%) Software Engineering
3 227 (33.43%) Problem-Solving
4 225 (33.14%) CI/CD
5 175 (25.77%) Microservices
6 164 (24.15%) DevOps
7 149 (21.94%) Full-Stack Development
8 117 (17.23%) Containerisation
9 109 (16.05%) Fintech
10 108 (15.91%) Mentoring
11 89 (13.11%) TDD
12 88 (12.96%) Scrum
13 87 (12.81%) Roadmaps
14 73 (10.75%) Test Automation
15 69 (10.16%) User Experience
16 66 (9.72%) Asset Management
17 65 (9.57%) Investment Management
18 54 (7.95%) BDD
19 52 (7.66%) Analytics
19 52 (7.66%) Clean Code
Programming Languages
1 310 (45.66%) Python
2 258 (38.00%) JavaScript
3 251 (36.97%) SQL
4 198 (29.16%) TypeScript
5 194 (28.57%) Java
6 79 (11.63%) C#
7 40 (5.89%) C++
8 38 (5.60%) PHP
9 31 (4.57%) Go
10 28 (4.12%) Shell Script
11 22 (3.24%) C
12 19 (2.80%) Rust
13 18 (2.65%) PowerShell
14 17 (2.50%) Ruby
15 13 (1.91%) Bash
16 11 (1.62%) PL/SQL
17 7 (1.03%) Perl
17 7 (1.03%) Scala
17 7 (1.03%) T-SQL
18 6 (0.88%) Ladder Logic
Qualifications
1 98 (14.43%) Security Cleared
2 78 (11.49%) SC Cleared
3 77 (11.34%) Degree
4 32 (4.71%) Computer Science Degree
5 31 (4.57%) Master's Degree
6 15 (2.21%) PhD
7 11 (1.62%) DV Cleared
8 10 (1.47%) Azure Certification
9 9 (1.33%) BPSS Clearance
10 8 (1.18%) AWS Certification
10 8 (1.18%) DBS Check
10 8 (1.18%) Oracle Certification
11 6 (0.88%) AWS Certified Solutions Architect
11 6 (0.88%) Microsoft Certification
12 5 (0.74%) VMware Certified Professional (VCP)
13 4 (0.59%) OCP
14 3 (0.44%) ISTQB
14 3 (0.44%) ISTQB Foundation Certification
15 2 (0.29%) CISSP
15 2 (0.29%) Postgraduate
Quality Assurance & Compliance
1 46 (6.77%) QA
2 15 (2.21%) ISO 9001
3 14 (2.06%) SLA
4 13 (1.91%) Accessibility
5 11 (1.62%) Data Quality
6 7 (1.03%) GDPR
7 6 (0.88%) CDISC
7 6 (0.88%) ISO/IEC 27001
8 4 (0.59%) GMP
9 3 (0.44%) MiFID
10 2 (0.29%) NCSC
11 1 (0.15%) NIST
System Software
1 254 (37.41%) Docker
2 15 (2.21%) Active Directory
3 5 (0.74%) Firmware
3 5 (0.74%) VMware NSX
4 2 (0.29%) Postfix
4 2 (0.29%) VMware ESXi
5 1 (0.15%) Slurm Workload Manager
5 1 (0.15%) VMware Infrastructure
5 1 (0.15%) VMware Workstation
Systems Management
1 222 (32.70%) Kubernetes
2 73 (10.75%) Terraform
3 39 (5.74%) Ansible
4 27 (3.98%) Prometheus
5 23 (3.39%) Grafana
6 20 (2.95%) Kibana
7 14 (2.06%) Argo
8 12 (1.77%) Packer
9 11 (1.62%) AWS Copilot
10 10 (1.47%) Progress Chef
11 9 (1.33%) Kustomize
12 7 (1.03%) Single Sign-On
13 6 (0.88%) Microsoft Intune
14 4 (0.59%) HAProxy
14 4 (0.59%) Istio
14 4 (0.59%) Oozie
14 4 (0.59%) Puppet
15 2 (0.29%) Control-M
15 2 (0.29%) HP Quality Center
16 1 (0.15%) SCCM
Vendors
1 70 (10.31%) Microsoft
2 57 (8.39%) Google
3 56 (8.25%) Oracle
4 25 (3.68%) Dynatrace
4 25 (3.68%) Splunk
5 20 (2.95%) Red Hat
6 17 (2.50%) Databricks
7 13 (1.91%) Cisco
8 12 (1.77%) Atlassian
8 12 (1.77%) SAP
9 9 (1.33%) New Relic
10 8 (1.18%) VMware
11 6 (0.88%) CA Agile Central
11 6 (0.88%) Siemens
12 5 (0.74%) IBM
13 4 (0.59%) Juniper
13 4 (0.59%) Palo Alto
14 3 (0.44%) Sophis
14 3 (0.44%) StreamSets
15 2 (0.29%) Ping Identity