Power Platform Jobs

Microsoft Power Platform
UK

The table below provides summary statistics for permanent job vacancies requiring Power Platform skills. It includes a benchmarking guide to the annual salaries offered in vacancies that cited Power Platform over the 6 months leading up to 1 May 2025, comparing them to the same period in the previous two years.

6 months to
1 May 2025
Same period 2024 Same period 2023
Rank 54 48 58
Rank change year-on-year -6 +10 +33
Permanent jobs citing Power Platform 2,242 4,596 5,356
As % of all permanent jobs advertised in the UK 4.31% 4.67% 5.15%
As % of the Cloud Services category 14.88% 12.98% 11.98%
Number of salaries quoted 1,632 3,729 3,372
10th Percentile £37,500 £35,000 £35,750
25th Percentile £45,000 £42,500 £44,525
Median annual salary (50th Percentile) £60,000 £55,000 £56,750
Median % change year-on-year +9.09% -3.08% +3.18%
75th Percentile £76,000 £71,000 £75,000
90th Percentile £93,778 £88,750 £92,500
UK excluding London median annual salary £55,000 £50,000 £47,500
% change year-on-year +10.00% +5.26% -

All Cloud Skills
UK

Power Platform falls under the Cloud Services category. For comparison with the information above, the following table provides summary statistics for all permanent job vacancies requiring cloud computing skills.

Permanent vacancies with a requirement for cloud computing skills 15,072 35,400 44,718
As % of all permanent jobs advertised in the UK 28.96% 35.94% 43.03%
Number of salaries quoted 11,031 26,787 29,292
10th Percentile £31,250 £30,000 £35,000
25th Percentile £44,670 £41,250 £46,250
Median annual salary (50th Percentile) £61,000 £57,500 £65,000
Median % change year-on-year +6.09% -11.54% +4.00%
75th Percentile £83,738 £77,500 £85,000
90th Percentile £103,750 £96,250 £102,500
UK excluding London median annual salary £55,000 £50,000 £55,000
% change year-on-year +10.00% -9.09% +4.76%

Power Platform
Job Vacancy Trend

Job postings citing Power Platform as a proportion of all IT jobs advertised.
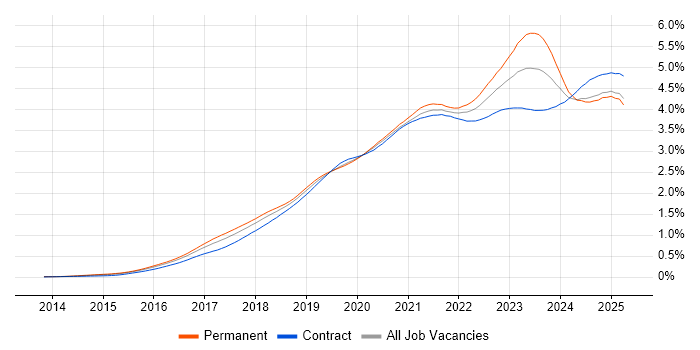
Job vacancy trend for Power Platform in the UK

Power Platform
Salary Trend

3-month moving average salary quoted in jobs citing Power Platform.

Salary trend for Power Platform in the UK

Power Platform
Salary Histogram

Salary distribution for jobs citing Power Platform over the 6 months to 1 May 2025.

Salary histogram for Power Platform in the UK

Power Platform
Top 19 Job Locations

The table below looks at the demand and provides a guide to the median salaries quoted in IT jobs citing Power Platform within the UK over the 6 months to 1 May 2025. The 'Rank Change' column provides an indication of the change in demand within each location based on the same 6 month period last year.

Location Rank Change
on Same Period
Last Year
Matching
Permanent
IT Job Ads
Median Salary
Past 6 Months
Median Salary
% Change
on Same Period
Last Year
Live
Jobs
England -14 2,049 £60,000 +9.09% 2,329
UK excluding London -16 1,291 £55,000 +10.00% 1,693
Work from Home -2 844 £60,000 +9.09% 1,257
London -10 778 £69,500 +2.96% 937
North of England -56 340 £55,000 +15.79% 411
South East +2 334 £55,000 +4.76% 537
Midlands -30 266 £53,688 +2.26% 299
North West -50 243 £57,500 +21.05% 241
West Midlands -27 199 £53,688 -2.39% 176
East of England 0 160 £65,000 +36.84% 150
South West -10 110 £54,500 +11.22% 190
Yorkshire -30 81 £48,000 -4.00% 126
East Midlands -24 66 £50,000 +11.11% 105
Scotland +13 53 £50,000 +5.26% 84
North East -23 16 £60,000 +41.18% 45
Wales -6 14 £43,000 -21.82% 37
Northern Ireland +34 9 £65,000 -1.89% 32
Isle of Man +17 3 £38,000 +5.56%
Channel Islands +2 2 £78,750 +36.96% 2

Power Platform
Co-occurring Skills and Capabilities by Category

The follow tables expand on the table above by listing co-occurrences grouped by category. The same employment type, locality and period is covered with up to 20 co-occurrences shown in each of the following categories:

Application Platforms
1 298 (13.29%) SharePoint
2 51 (2.27%) Microsoft Exchange
3 46 (2.05%) Apache Spark
4 21 (0.94%) CMS
5 15 (0.67%) Apache
5 15 (0.67%) OpenEdge
6 13 (0.58%) Confluence
7 9 (0.40%) Apache Airflow
7 9 (0.40%) IIS
8 6 (0.27%) SAS
9 4 (0.18%) Moodle
10 3 (0.13%) EPiServer
10 3 (0.13%) SharePoint Server
10 3 (0.13%) SugarCRM
10 3 (0.13%) WordPress
11 2 (0.089%) ArcGIS
11 2 (0.089%) Jupyter
11 2 (0.089%) nginx
11 2 (0.089%) Oracle SOA Suite
11 2 (0.089%) Umbraco
Applications
1 384 (17.13%) Microsoft Excel
2 90 (4.01%) Microsoft Office
3 52 (2.32%) Microsoft PowerPoint
4 23 (1.03%) Trello
5 19 (0.85%) MS Visio
6 12 (0.54%) Spreadsheet
7 9 (0.40%) Microsoft Project
8 8 (0.36%) Maya
9 5 (0.22%) Chatbot
9 5 (0.22%) SPSS
10 1 (0.045%) Simulink
10 1 (0.045%) Sketch
10 1 (0.045%) SPSS Modeler
Business Applications
1 234 (10.44%) Dynamics CRM
2 10 (0.45%) Dynamics AX
2 10 (0.45%) Dynamics NAV
2 10 (0.45%) Elite 3E
3 8 (0.36%) Dynamics GP
4 6 (0.27%) Infor M3
4 6 (0.27%) SAP S/4HANA
5 4 (0.18%) IBM Planning Analytics
5 4 (0.18%) Infor LN
5 4 (0.18%) iTrent
5 4 (0.18%) Salesforce CRM
5 4 (0.18%) Sparx Enterprise Architect
6 3 (0.13%) Aladdin
6 3 (0.13%) Payment Gateway
6 3 (0.13%) Sage 200
6 3 (0.13%) Shopify
7 2 (0.089%) Cloudability
7 2 (0.089%) NEC Housing
7 2 (0.089%) Oracle Payables
7 2 (0.089%) Oracle Receivables
Cloud Services
1 952 (42.46%) Azure
2 463 (20.65%) Dynamics 365
3 443 (19.76%) PowerApps
4 379 (16.90%) Power Automate
5 277 (12.36%) Microsoft 365
6 181 (8.07%) Azure DevOps
7 174 (7.76%) Azure Data Factory
8 162 (7.23%) AWS
9 126 (5.62%) Azure Logic Apps
10 120 (5.35%) Azure Synapse Analytics
11 83 (3.70%) GCP
12 81 (3.61%) Snowflake
13 60 (2.68%) Serverless
14 56 (2.50%) Entra ID
15 52 (2.32%) SaaS
16 49 (2.19%) GitHub
17 45 (2.01%) Azure Functions
18 43 (1.92%) Google Analytics
18 43 (1.92%) Microsoft Copilot
19 33 (1.47%) OneDrive
Communications & Networking
1 27 (1.20%) Firewall
2 21 (0.94%) DNS
3 18 (0.80%) DHCP
4 13 (0.58%) VPN
5 10 (0.45%) Internet
5 10 (0.45%) Intranet
6 9 (0.40%) TCP/IP
7 8 (0.36%) Wi-Fi
8 7 (0.31%) FTP
8 7 (0.31%) VLAN
9 6 (0.27%) LAN
9 6 (0.27%) SAN
9 6 (0.27%) VoIP
10 5 (0.22%) WAN
11 4 (0.18%) ADSL
12 3 (0.13%) IP Telephony
12 3 (0.13%) Wireless
13 2 (0.089%) CHAP
13 2 (0.089%) Network Security
13 2 (0.089%) Reverse Proxy
Database & Business Intelligence
1 1,666 (74.31%) Power BI
2 329 (14.67%) Tableau
3 323 (14.41%) SQL Server
4 292 (13.02%) Data Warehouse
5 195 (8.70%) SQL Server Reporting Services
6 173 (7.72%) Power Query
7 161 (7.18%) Data Lake
8 135 (6.02%) SQL Server Integration Services
9 98 (4.37%) GIS
10 95 (4.24%) Geospatial Data
11 82 (3.66%) Big Data
12 80 (3.57%) Azure SQL Database
13 69 (3.08%) Metadata
14 58 (2.59%) Relational Database
15 40 (1.78%) SQL Server Analysis Services
16 39 (1.74%) Looker
17 34 (1.52%) BigQuery
17 34 (1.52%) PostgreSQL
18 27 (1.20%) NoSQL
19 25 (1.12%) Azure SQL Data Warehouse
Development Applications
1 68 (3.03%) JIRA
2 55 (2.45%) Visual Studio
3 47 (2.10%) Git
4 30 (1.34%) SQL Server Management Studio (SSMS)
5 10 (0.45%) Jenkins
5 10 (0.45%) Postman
6 8 (0.36%) JMeter
7 7 (0.31%) Cypress.io
7 7 (0.31%) ERwin
7 7 (0.31%) Selenium
7 7 (0.31%) Visual Studio Code
8 6 (0.27%) NUnit
8 6 (0.27%) SoapUI
9 5 (0.22%) GitLab
10 4 (0.18%) SpecFlow
11 3 (0.13%) Bitbucket
11 3 (0.13%) Burp Suite
11 3 (0.13%) ER Studio
11 3 (0.13%) Gatling
11 3 (0.13%) MSTest
General
1 791 (35.28%) Social Skills
2 574 (25.60%) Finance
3 441 (19.67%) Analytical Skills
4 188 (8.39%) Law
5 165 (7.36%) Marketing
6 162 (7.23%) Inclusion and Diversity
7 110 (4.91%) Retail
8 109 (4.86%) Organisational Skills
9 100 (4.46%) Presentation Skills
10 83 (3.70%) Legal
11 79 (3.52%) Public Sector
12 72 (3.21%) Banking
13 52 (2.32%) Manufacturing
14 37 (1.65%) Documentation Skills
15 34 (1.52%) Automotive
16 28 (1.25%) Advertising
17 26 (1.16%) Influencing Skills
18 24 (1.07%) Games
19 22 (0.98%) Billing
19 22 (0.98%) Telecoms
Job Titles
1 557 (24.84%) Analyst
2 465 (20.74%) Developer
3 295 (13.16%) Senior
4 226 (10.08%) Lead
5 187 (8.34%) Data Analyst
6 151 (6.74%) Data Engineer
7 128 (5.71%) Architect
8 113 (5.04%) Power Platform Developer
9 104 (4.64%) Dynamics 365 Developer
10 101 (4.50%) Consultant
11 92 (4.10%) Business Intelligence Developer
11 92 (4.10%) Senior Analyst
12 73 (3.26%) Senior Developer
13 72 (3.21%) Digital Analyst
14 71 (3.17%) Business Intelligence Analyst
15 64 (2.85%) Financial Analyst
16 59 (2.63%) Power BI Developer
17 52 (2.32%) Data Manager
18 51 (2.27%) Solutions Architect
19 47 (2.10%) Business Analyst
Libraries, Frameworks & Software Standards
1 242 (10.79%) .NET
2 75 (3.35%) CSS
3 68 (3.03%) HTML
4 63 (2.81%) REST
5 60 (2.68%) .NET Framework
6 54 (2.41%) ASP.NET
7 49 (2.19%) React
8 48 (2.14%) JSON
9 46 (2.05%) XML
10 39 (1.74%) ASP.NET Web API
11 38 (1.69%) SOAP
12 36 (1.61%) Web Services
13 32 (1.43%) PySpark
14 28 (1.25%) HTML5 Canvas
15 24 (1.07%) AngularJS
15 24 (1.07%) EDI
15 24 (1.07%) RESTful
16 23 (1.03%) ADO
16 23 (1.03%) Kafka
17 17 (0.76%) Middleware
Miscellaneous
1 136 (6.07%) Management Information System
2 120 (5.35%) Algorithms
3 64 (2.85%) Product Ownership
4 48 (2.14%) Data Structures
5 45 (2.01%) Low-Code
6 41 (1.83%) Analytical Mindset
7 37 (1.65%) Legacy Systems
8 33 (1.47%) Cloud Native
9 32 (1.43%) Self-Motivation
10 30 (1.34%) Social Media
11 22 (0.98%) Enterprise Software
11 22 (0.98%) Mobile App
11 22 (0.98%) Onboarding
12 20 (0.89%) Reinsurance
13 18 (0.80%) Legacy Applications
14 17 (0.76%) NHS
15 12 (0.54%) FMCG
15 12 (0.54%) Greenfield Project
16 11 (0.49%) Virtual Team
17 10 (0.45%) Linux Command Line
Operating Systems
1 81 (3.61%) Windows
2 25 (1.12%) Windows Server
3 20 (0.89%) Linux
4 14 (0.62%) Windows 10
4 14 (0.62%) Windows Vista
5 4 (0.18%) Apple iOS
5 4 (0.18%) Windows Server 2016
6 2 (0.089%) Mac OS
6 2 (0.089%) SUSE
6 2 (0.089%) Unix
7 1 (0.045%) Android
7 1 (0.045%) Ubuntu
7 1 (0.045%) Windows Server 2012
Processes & Methodologies
1 1,470 (65.57%) Business Intelligence
2 693 (30.91%) Analytics
3 635 (28.32%) Problem-Solving
4 511 (22.79%) Visualisation
5 460 (20.52%) Agile
6 365 (16.28%) Data Analysis
7 364 (16.24%) Decision-Making
8 342 (15.25%) CRM
9 328 (14.63%) Data Visualisation
10 325 (14.50%) Data Management
10 325 (14.50%) Data Modelling
11 321 (14.32%) DevOps
12 301 (13.43%) Actionable Insight
13 262 (11.69%) ETL
14 259 (11.55%) Data Analytics
15 253 (11.28%) Artificial Intelligence
16 229 (10.21%) Mentoring
17 211 (9.41%) Project Management
18 205 (9.14%) Data Governance
19 185 (8.25%) Data Engineering
Programming Languages
1 1,047 (46.70%) SQL
2 385 (17.17%) Python
3 293 (13.07%) C#
4 200 (8.92%) JavaScript
5 141 (6.29%) T-SQL
6 134 (5.98%) Data Analysis Expressions
7 120 (5.35%) PowerShell
8 92 (4.10%) R
9 60 (2.68%) Java
10 58 (2.59%) TypeScript
11 20 (0.89%) VB.NET
12 19 (0.85%) VBA
13 18 (0.80%) PL/SQL
14 15 (0.67%) Scala
14 15 (0.67%) X++
15 14 (0.62%) C++
16 9 (0.40%) Bash
16 9 (0.40%) VB
17 7 (0.31%) PHP
18 6 (0.27%) C
Qualifications
1 489 (21.81%) Degree
2 123 (5.49%) Security Cleared
3 113 (5.04%) Microsoft Certification
4 102 (4.55%) DBS Check
5 76 (3.39%) SC Cleared
6 69 (3.08%) Computer Science Degree
7 61 (2.72%) Azure Certification
8 41 (1.83%) ACCA
9 39 (1.74%) CIMA
10 34 (1.52%) Master's Degree
11 24 (1.07%) BPSS Clearance
12 17 (0.76%) TOGAF Certification
13 12 (0.54%) CISSP
13 12 (0.54%) DV Cleared
14 11 (0.49%) ISTQB
15 10 (0.45%) AAT
16 9 (0.40%) Numerate Degree
17 8 (0.36%) ISTQB Foundation Certification
17 8 (0.36%) PMI Certification
18 7 (0.31%) ITIL Foundation Certificate
Quality Assurance & Compliance
1 260 (11.60%) Data Quality
2 89 (3.97%) QA
3 83 (3.70%) GDPR
4 63 (2.81%) Accessibility
5 19 (0.85%) ISO/IEC 27001
6 13 (0.58%) Actionable Recommendations
7 12 (0.54%) SLA
8 11 (0.49%) PMO
9 10 (0.45%) Cyber Essentials
10 7 (0.31%) California Consumer Privacy Act
11 6 (0.27%) GxP
11 6 (0.27%) NIST
11 6 (0.27%) PCI DSS
12 5 (0.22%) IFRS
13 4 (0.18%) GRC
14 3 (0.13%) COBIT
14 3 (0.13%) MiFID
14 3 (0.13%) NCSC
14 3 (0.13%) SOC 2
15 2 (0.089%) SNOMED CT
System Software
1 56 (2.50%) Active Directory
2 30 (1.34%) Docker
3 18 (0.80%) VMware Infrastructure
4 10 (0.45%) Hyper-V
5 6 (0.27%) Virtual Machines
6 4 (0.18%) HDFS
7 3 (0.13%) vSphere
8 2 (0.089%) Virtual Desktop
8 2 (0.089%) VMware ESXi
9 1 (0.045%) Virtual Servers
9 1 (0.045%) XenApp
Systems Management
1 24 (1.07%) Terraform
2 21 (0.94%) Microsoft Intune
3 20 (0.89%) Kubernetes
4 9 (0.40%) SCCM
5 8 (0.36%) Failover Clustering
6 7 (0.31%) Ansible
7 4 (0.18%) Single Sign-On
8 2 (0.089%) FortiGate
8 2 (0.089%) Grafana
8 2 (0.089%) HP Quality Center
8 2 (0.089%) Nessus
8 2 (0.089%) SCOM
9 1 (0.045%) Active Directory Federation Services
9 1 (0.045%) Istio
9 1 (0.045%) OpenVAS
9 1 (0.045%) QRadar
9 1 (0.045%) RSA Archer
Vendors
1 1,036 (46.21%) Microsoft
2 168 (7.49%) Databricks
3 100 (4.46%) Google
4 91 (4.06%) SAP
5 85 (3.79%) Alteryx
6 63 (2.81%) Salesforce
7 53 (2.36%) ServiceNow
8 44 (1.96%) Oracle
9 28 (1.25%) IBM
9 28 (1.25%) Informatica
10 19 (0.85%) VMware
11 18 (0.80%) Cognos
11 18 (0.80%) Dell
12 17 (0.76%) Aderant
13 16 (0.71%) Cisco
14 14 (0.62%) Adobe
15 13 (0.58%) Intapp
16 11 (0.49%) Anaplan
16 11 (0.49%) OpenAI
17 10 (0.45%) Meraki