Bash Shell
UK

The table below provides summary statistics for permanent job vacancies requiring Bash skills. It includes a benchmarking guide to the annual salaries offered in vacancies that cited Bash over the 6 months leading up to 1 May 2025, comparing them to the same period in the previous two years.

6 months to
1 May 2025
Same period 2024 Same period 2023
Rank 268 212 153
Rank change year-on-year -56 -59 +15
Permanent jobs citing Bash 570 1,396 2,451
As % of all permanent jobs advertised in the UK 1.10% 1.42% 2.36%
As % of the Programming Languages category 3.65% 4.19% 5.44%
Number of salaries quoted 398 859 1,423
10th Percentile £44,723 £41,500 £42,874
25th Percentile £52,500 £47,500 £53,750
Median annual salary (50th Percentile) £70,000 £60,000 £70,000
Median % change year-on-year +16.67% -14.29% -
75th Percentile £87,188 £80,000 £89,736
90th Percentile £97,792 £92,500 £117,236
UK excluding London median annual salary £63,750 £55,000 £61,000
% change year-on-year +15.91% -9.84% +4.27%

All Programming Languages
UK

Bash falls under the Programming Languages category. For comparison with the information above, the following table provides summary statistics for all permanent job vacancies requiring coding skills.

Permanent vacancies with a requirement for coding skills 15,622 33,278 45,076
As % of all permanent jobs advertised in the UK 30.02% 33.79% 43.37%
Number of salaries quoted 11,533 25,047 28,788
10th Percentile £37,500 £35,000 £38,750
25th Percentile £47,683 £45,000 £49,500
Median annual salary (50th Percentile) £60,000 £60,000 £65,000
Median % change year-on-year - -7.69% +4.00%
75th Percentile £82,500 £77,500 £86,250
90th Percentile £107,250 £100,000 £106,250
UK excluding London median annual salary £55,000 £53,635 £55,000
% change year-on-year +2.54% -2.48% +2.33%

Bash
Job Vacancy Trend

Job postings citing Bash as a proportion of all IT jobs advertised.
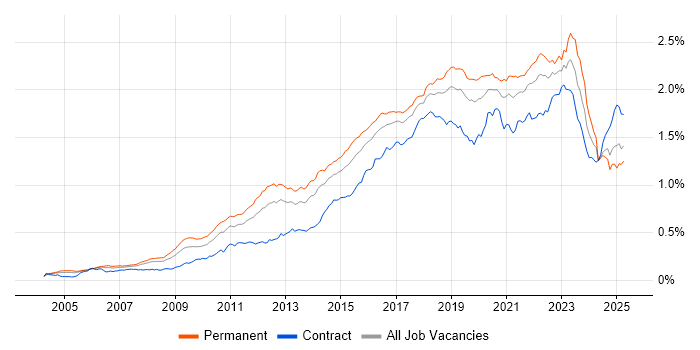
Job vacancy trend for Bash in the UK

Bash
Salary Trend

3-month moving average salary quoted in jobs citing Bash.

Salary trend for Bash in the UK

Bash
Salary Histogram

Salary distribution for jobs citing Bash over the 6 months to 1 May 2025.

Salary histogram for Bash in the UK

Bash
Top 16 Job Locations

The table below looks at the demand and provides a guide to the median salaries quoted in IT jobs citing Bash within the UK over the 6 months to 1 May 2025. The 'Rank Change' column provides an indication of the change in demand within each location based on the same 6 month period last year.

Location Rank Change
on Same Period
Last Year
Matching
Permanent
IT Job Ads
Median Salary
Past 6 Months
Median Salary
% Change
on Same Period
Last Year
Live
Jobs
England -67 524 £70,000 +16.67% 578
UK excluding London -49 323 £63,750 +15.91% 381
London -48 218 £82,500 +13.79% 278
Work from Home -58 196 £70,000 +11.50% 388
South East +12 110 £60,000 +9.09% 127
North of England +44 62 £72,246 +20.41% 75
East of England +52 52 £62,000 -4.62% 77
South West -55 44 £67,500 +22.73% 49
North West +18 42 £70,000 +14.02% 51
Midlands +55 40 £55,000 - 39
West Midlands +35 22 £55,000 -8.33% 29
Yorkshire +58 18 £72,500 +52.63% 18
Scotland +76 17 £85,253 +42.09% 20
East Midlands +37 17 £57,500 +15.00% 7
Northern Ireland +22 7 £55,000 -31.25% 9
North East +40 2 £75,500 +67.78% 6

Bash
Co-occurring Skills and Capabilities by Category

The follow tables expand on the table above by listing co-occurrences grouped by category. The same employment type, locality and period is covered with up to 20 co-occurrences shown in each of the following categories:

Application Platforms
1 15 (2.63%) Confluence
1 15 (2.63%) Microsoft Exchange
2 12 (2.11%) Apache Spark
3 11 (1.93%) nginx
4 8 (1.40%) Apache
5 7 (1.23%) Apache Airflow
6 5 (0.88%) IIS
7 4 (0.70%) SharePoint
7 4 (0.70%) Tomcat
8 2 (0.35%) CICS
8 2 (0.35%) Oracle SOA Suite
9 1 (0.18%) CMS
9 1 (0.18%) Office Communications Server
Applications
1 17 (2.98%) Microsoft Excel
2 7 (1.23%) Chatbot
3 6 (1.05%) Microsoft Office
4 4 (0.70%) MS Visio
5 1 (0.18%) Weka
Business Applications
1 7 (1.23%) Fidessa
2 2 (0.35%) Refinitiv Enterprise Platform
3 1 (0.18%) Oracle Payables
Cloud Services
1 226 (39.65%) Azure
2 194 (34.04%) AWS
3 98 (17.19%) GCP
4 69 (12.11%) GitHub
5 43 (7.54%) Azure DevOps
6 40 (7.02%) AWS CloudFormation
7 37 (6.49%) SaaS
8 30 (5.26%) Serverless
9 23 (4.04%) IaaS
10 22 (3.86%) PaaS
11 21 (3.68%) Amazon CloudWatch
12 20 (3.51%) Amazon EKS
12 20 (3.51%) GitHub Actions
13 19 (3.33%) AWS Lambda
13 19 (3.33%) Datadog
14 18 (3.16%) Azure AKS
14 18 (3.16%) Entra ID
14 18 (3.16%) Microsoft 365
15 17 (2.98%) Amazon EC2
16 16 (2.81%) Amazon ECS
Communications & Networking
1 101 (17.72%) VPN
2 97 (17.02%) TCP/IP
3 95 (16.67%) Firewall
4 33 (5.79%) Network Security
5 28 (4.91%) DNS
6 19 (3.33%) 5G
6 19 (3.33%) WAN
7 17 (2.98%) HTTP
8 15 (2.63%) DHCP
9 14 (2.46%) LAN
9 14 (2.46%) VLAN
10 13 (2.28%) BGP
10 13 (2.28%) Wi-Fi
11 12 (2.11%) Internet
11 12 (2.11%) LTE
11 12 (2.11%) MPLS
11 12 (2.11%) OSPF
12 11 (1.93%) Bluetooth
12 11 (1.93%) Intrusion Detection
13 10 (1.75%) Multicast
Database & Business Intelligence
1 28 (4.91%) MySQL
2 26 (4.56%) SQL Server
3 18 (3.16%) Relational Database
4 14 (2.46%) Amazon RDS
5 13 (2.28%) Data Warehouse
5 13 (2.28%) PostgreSQL
6 12 (2.11%) Big Data
7 11 (1.93%) NoSQL
8 9 (1.58%) Power BI
9 8 (1.40%) Elasticsearch
9 8 (1.40%) SQL Server Integration Services
9 8 (1.40%) SQL Server Reporting Services
10 7 (1.23%) MongoDB
11 6 (1.05%) Amazon Aurora
12 5 (0.88%) Amazon Redshift
13 4 (0.70%) BigQuery
13 4 (0.70%) DB2
13 4 (0.70%) DynamoDB
14 3 (0.53%) MariaDB
14 3 (0.53%) RDBMS
Development Applications
1 78 (13.68%) Jenkins
2 67 (11.75%) Git
3 65 (11.40%) Cucumber
4 64 (11.23%) GitLab
4 64 (11.23%) Robot Framework
5 25 (4.39%) JIRA
6 13 (2.28%) CircleCI
7 12 (2.11%) TeamCity
8 9 (1.58%) Artifactory
8 9 (1.58%) Bitbucket
8 9 (1.58%) Sonatype Nexus
9 8 (1.40%) Visual Studio
10 5 (0.88%) IBM UrbanCode
10 5 (0.88%) WiX
11 4 (0.70%) Spinnaker
12 3 (0.53%) Burp Suite
12 3 (0.53%) CMake
12 3 (0.53%) Team Foundation Server
12 3 (0.53%) TestRail
12 3 (0.53%) Vagrant
General
1 184 (32.28%) Social Skills
2 133 (23.33%) Finance
3 93 (16.32%) Inclusion and Diversity
4 83 (14.56%) Banking
5 81 (14.21%) Telecoms
6 39 (6.84%) Analytical Skills
7 12 (2.11%) Electronics
8 10 (1.75%) Documentation Skills
8 10 (1.75%) Retail
9 9 (1.58%) Investment Banking
10 8 (1.40%) Financial Institution
11 6 (1.05%) Marketing
12 5 (0.88%) Back Office
12 5 (0.88%) Games
12 5 (0.88%) Health Technology
12 5 (0.88%) Influencing Skills
12 5 (0.88%) Manufacturing
13 4 (0.70%) Front Office
13 4 (0.70%) Presentation Skills
13 4 (0.70%) Spanish Language
Job Titles
1 84 (14.74%) Senior
2 79 (13.86%) DevOps Engineer
2 79 (13.86%) Lead
3 66 (11.58%) Test Engineer
4 64 (11.23%) Test Automation Engineer
5 44 (7.72%) Administrator
6 42 (7.37%) Systems Administrator
7 41 (7.19%) Platform Engineer
8 40 (7.02%) Cloud Engineer
9 36 (6.32%) Analyst
10 34 (5.96%) Software Engineer
11 33 (5.79%) Linux Systems Administrator
12 32 (5.61%) Azure Engineer
12 32 (5.61%) Linux Administrator
13 30 (5.26%) Infrastructure Engineer
14 25 (4.39%) Developer
15 23 (4.04%) Linux Engineer
16 21 (3.68%) Network Engineer
17 19 (3.33%) Site Reliability Engineer
18 18 (3.16%) Support Engineer
Libraries, Frameworks & Software Standards
1 30 (5.26%) Elastic Stack
2 21 (3.68%) REST
3 19 (3.33%) RESTful
4 17 (2.98%) FIX Protocol
5 16 (2.81%) HTML
6 15 (2.63%) LDAP
7 13 (2.28%) .NET
7 13 (2.28%) AWS CDK
8 12 (2.11%) SOAP
9 11 (1.93%) Azure Blueprints
9 11 (1.93%) Pandas
9 11 (1.93%) Web Services
10 9 (1.58%) ADO
10 9 (1.58%) ARM Templates
10 9 (1.58%) Kafka
10 9 (1.58%) Loki
10 9 (1.58%) Middleware
11 8 (1.40%) CSS
11 8 (1.40%) React
12 7 (1.23%) Node.js
Miscellaneous
1 86 (15.09%) Linux Command Line
2 32 (5.61%) Data Centre
3 30 (5.26%) Cloud Native
4 26 (4.56%) Management Information System
5 25 (4.39%) Hybrid Cloud
6 24 (4.21%) Security Posture
7 16 (2.81%) IoT
8 15 (2.63%) Cyber Threat
8 15 (2.63%) Public Cloud
9 14 (2.46%) Algorithms
10 11 (1.93%) Equities
10 11 (1.93%) NB-IoT
10 11 (1.93%) Onboarding
10 11 (1.93%) Private Cloud
11 10 (1.75%) Security Operations Centre
11 10 (1.75%) Self-Motivation
12 9 (1.58%) Fixed Income
13 8 (1.40%) Clustering
13 8 (1.40%) Product Ownership
13 8 (1.40%) Replication
Operating Systems
1 328 (57.54%) Linux
2 192 (33.68%) Windows
3 55 (9.65%) Unix
4 49 (8.60%) Windows Server
5 44 (7.72%) Red Hat Enterprise Linux
6 25 (4.39%) CentOS
7 23 (4.04%) Mac OS
8 16 (2.81%) Ubuntu
9 13 (2.28%) Rocky
10 12 (2.11%) VMS
11 7 (1.23%) Solaris
11 7 (1.23%) Windows 10
12 6 (1.05%) Debian
12 6 (1.05%) SUSE
13 5 (0.88%) SUSE Linux Enterprise Server
14 4 (0.70%) Windows Server 2016
15 3 (0.53%) Android
16 2 (0.35%) zOS
17 1 (0.18%) Windows Server 2019
Processes & Methodologies
1 261 (45.79%) DevOps
2 193 (33.86%) CI/CD
3 184 (32.28%) Problem-Solving
4 152 (26.67%) Infrastructure as Code
5 124 (21.75%) Mentoring
6 113 (19.82%) Containerisation
7 83 (14.56%) Test Automation
8 76 (13.33%) Coaching
9 72 (12.63%) Agile
10 69 (12.11%) System Testing
11 64 (11.23%) Test Management
12 63 (11.05%) Platform Engineering
13 55 (9.65%) Configuration Management
14 50 (8.77%) Computer Science
15 47 (8.25%) Software Engineering
16 45 (7.89%) Observability
17 44 (7.72%) ITIL
18 43 (7.54%) Cybersecurity
19 42 (7.37%) Artificial Intelligence
20 39 (6.84%) High Availability
Programming Languages
1 484 (84.91%) Python
2 287 (50.35%) PowerShell
3 105 (18.42%) JavaScript
4 94 (16.49%) SQL
5 47 (8.25%) Java
6 45 (7.89%) Perl
7 36 (6.32%) C++
8 33 (5.79%) C#
9 31 (5.44%) C
10 27 (4.74%) Bicep
11 23 (4.04%) TypeScript
12 22 (3.86%) Go
13 17 (2.98%) Ruby
13 17 (2.98%) Shell Script
14 12 (2.11%) Fortran
15 8 (1.40%) Data Analysis Expressions
16 6 (1.05%) R
17 5 (0.88%) JCL
18 4 (0.70%) Jython
18 4 (0.70%) PHP
Qualifications
1 158 (27.72%) Degree
2 54 (9.47%) Security Cleared
3 35 (6.14%) DV Cleared
4 31 (5.44%) Computer Science Degree
5 30 (5.26%) AWS Certification
5 30 (5.26%) SC Cleared
6 25 (4.39%) Cisco Certification
7 17 (2.98%) CompTIA Security+
8 14 (2.46%) Master's Degree
9 13 (2.28%) Azure Certification
9 13 (2.28%) CCNP
10 11 (1.93%) CCNA
10 11 (1.93%) CEH
10 11 (1.93%) Network+ Certification
10 11 (1.93%) PhD
11 10 (1.75%) CCSP
11 10 (1.75%) CISSP
12 8 (1.40%) OSCP
13 7 (1.23%) GCIH
13 7 (1.23%) Microsoft Certification
Quality Assurance & Compliance
1 80 (14.04%) QA
2 38 (6.67%) GDPR
3 32 (5.61%) ISO/IEC 27001
4 25 (4.39%) NIST
5 20 (3.51%) Sarbanes-Oxley
6 17 (2.98%) PCI DSS
7 11 (1.93%) COBIT
8 10 (1.75%) HIPAA
9 5 (0.88%) Cyber Essentials
9 5 (0.88%) SOC 2
10 4 (0.70%) Cyber Essentials PLUS
10 4 (0.70%) PMO
11 3 (0.53%) NCSC
11 3 (0.53%) SLA
12 2 (0.35%) Actionable Recommendations
13 1 (0.18%) Accessibility
13 1 (0.18%) Data Quality
13 1 (0.18%) JTAG
13 1 (0.18%) MISRA
System Software
1 133 (23.33%) Docker
2 56 (9.82%) VMware Infrastructure
3 46 (8.07%) Active Directory
4 19 (3.33%) vSphere
5 18 (3.16%) VMware ESXi
6 17 (2.98%) Hyper-V
7 12 (2.11%) Virtual Machines
8 6 (1.05%) Virtual Desktop
9 5 (0.88%) NFS
9 5 (0.88%) Postfix
10 3 (0.53%) Dovecot
10 3 (0.53%) Firmware
11 2 (0.35%) VirtualBox
12 1 (0.18%) EMC RecoverPoint
12 1 (0.18%) LXC
12 1 (0.18%) Samba
12 1 (0.18%) Squid
12 1 (0.18%) Veritas Cluster Server
12 1 (0.18%) Virtual Servers
12 1 (0.18%) VMware Server
Systems Management
1 187 (32.81%) Terraform
2 160 (28.07%) Kubernetes
3 151 (26.49%) Ansible
4 51 (8.95%) Grafana
5 46 (8.07%) Prometheus
6 44 (7.72%) Puppet
7 30 (5.26%) Nagios
8 25 (4.39%) Progress Chef
9 20 (3.51%) Microsoft Intune
10 15 (2.63%) CASB
11 12 (2.11%) Argo
12 9 (1.58%) Istio
12 9 (1.58%) QRadar
13 8 (1.40%) SCCM
14 7 (1.23%) CA Endevor
14 7 (1.23%) Red Hat Satellite
14 7 (1.23%) Rundeck
15 6 (1.05%) Kibana
15 6 (1.05%) linkerd
15 6 (1.05%) SCOM
Vendors
1 104 (18.25%) Microsoft
2 86 (15.09%) VMware
3 49 (8.60%) Red Hat
4 28 (4.91%) Splunk
5 25 (4.39%) Google
5 25 (4.39%) SolarWinds
6 21 (3.68%) Cisco
7 16 (2.81%) Oracle
8 12 (2.11%) Atlassian
9 11 (1.93%) Apple
10 10 (1.75%) Palo Alto
11 8 (1.40%) Bloomberg
11 8 (1.40%) NetApp
11 8 (1.40%) Reuters
12 7 (1.23%) Citrix
12 7 (1.23%) CQG
12 7 (1.23%) Dynatrace
12 7 (1.23%) ION Trading
12 7 (1.23%) Patsystems
12 7 (1.23%) Trayport