Containerisation Jobs

Containerization
UK

The table below provides summary statistics for permanent job vacancies requiring Containerisation skills. It includes a benchmarking guide to the annual salaries offered in vacancies that cited Containerisation over the 6 months leading up to 27 August 2025, comparing them to the same period in the previous two years.

6 months to
27 Aug 2025
Same period 2024 Same period 2023
Rank 117 171 81
Rank change year-on-year +54 -90 +58
DemandTrendPermanent jobs citing Containerisation 1,435 1,343 2,782
As % of all permanent jobs advertised in the UK 2.59% 1.56% 3.93%
As % of the Processes & Methodologies category 2.96% 1.92% 4.14%
Number of salaries quoted 612 834 1,200
10th Percentile £48,750 £48,250 £48,750
25th Percentile £58,500 £55,000 £56,250
Median annual salary (50th Percentile) £77,500 £70,000 £72,500
Median % change year-on-year +10.71% -3.45% +3.57%
75th Percentile £95,000 £90,000 £87,419
90th Percentile £120,000 £105,000 £97,290
UK excluding London median annual salary £65,000 £62,500 £67,500
% change year-on-year +4.00% -7.41% +12.50%

All Process and Methodology Skills
UK

Containerisation falls under the Processes and Methodologies category. For comparison with the information above, the following table provides summary statistics for all permanent job vacancies requiring process or methodology skills.

DemandTrendPermanent vacancies with a requirement for process or methodology skills 48,519 69,964 67,244
As % of all permanent jobs advertised in the UK 87.61% 81.23% 95.00%
Number of salaries quoted 26,270 42,206 45,721
10th Percentile £26,250 £31,250 £33,250
25th Percentile £35,000 £41,250 £45,000
Median annual salary (50th Percentile) £54,793 £55,000 £60,000
Median % change year-on-year -0.38% -8.33% -
75th Percentile £75,000 £75,000 £80,000
90th Percentile £95,000 £95,000 £100,000
UK excluding London median annual salary £45,000 £50,051 £55,000
% change year-on-year -10.09% -9.00% +4.76%

Containerisation
Job Vacancy Trend

Job postings citing Containerisation as a proportion of all IT jobs advertised.
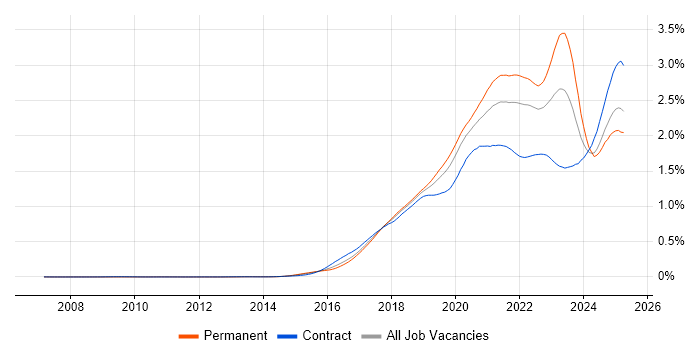
Job vacancy trend for Containerisation in the UK

Containerisation
Salary Trend

Salary distribution trend for jobs in the UK citing Containerisation.

Salary distribution trend for jobs in the UK citing Containerisation

Containerisation
Salary Histogram

Salary distribution for jobs citing Containerisation over the 6 months to 27 August 2025.

Salary histogram for Containerisation in the UK

Containerisation
Top 18 Job Locations

The table below looks at the demand and provides a guide to the median salaries quoted in IT jobs citing Containerisation within the UK over the 6 months to 27 August 2025. The 'Rank Change' column provides an indication of the change in demand within each location based on the same 6 month period last year.

Location Rank Change
on Same Period
Last Year
Matching
DemandTrendPermanent
IT Job Ads
Median Salary
Past 6 Months
Median Salary
% Change
on Same Period
Last Year
Live
Jobs
England +51 1,322 £77,500 +10.71% 859
Work from Home +112 829 £70,000 - 494
UK excluding London +49 778 £65,000 +4.00% 572
London +69 531 £87,500 -2.78% 398
North of England +9 251 £65,000 +8.33% 177
North West +42 201 £65,000 +6.12% 117
South East +26 143 £68,750 +1.85% 139
Midlands +70 131 £67,500 +12.50% 41
Scotland +117 89 £65,000 -3.70% 39
South West +26 84 £75,000 +11.11% 87
East of England +29 79 £58,500 -4.49% 54
West Midlands +57 74 £68,750 +14.58% 30
East Midlands +44 57 £55,000 -4.35% 11
Yorkshire -42 42 £65,000 +8.33% 45
Wales +23 17 £72,500 +45.00% 19
North East +11 8 £60,000 +14.29% 16
Northern Ireland +23 2 £43,092 -28.18% 25
Isle of Man +4 1 £34,500 -58.18%

Containerisation
Co-occurring Skills and Capabilities by Category

The follow tables expand on the table above by listing co-occurrences grouped by category. The same employment type, locality and period is covered with up to 20 co-occurrences shown in each of the following categories:

Application Platforms
1 180 (12.54%) Confluence
2 50 (3.48%) Apache Spark
3 28 (1.95%) Apache Airflow
4 20 (1.39%) Apache
5 17 (1.18%) CMS
5 17 (1.18%) IIS
6 12 (0.84%) Apache Solr
7 6 (0.42%) SharePoint
8 5 (0.35%) nginx
9 3 (0.21%) BizTalk Server
9 3 (0.21%) Microsoft Exchange
9 3 (0.21%) Oracle SOA Suite
10 1 (0.070%) Apache Superset
10 1 (0.070%) CICS
10 1 (0.070%) GemFire
10 1 (0.070%) Mendix
10 1 (0.070%) NServiceBus
10 1 (0.070%) OpenStack
10 1 (0.070%) SAS
10 1 (0.070%) Tomcat
Applications
1 9 (0.63%) Maya
2 4 (0.28%) Adobe XD
2 4 (0.28%) Sketch
3 2 (0.14%) EngageOne
3 2 (0.14%) MS Visio
Business Applications
1 2 (0.14%) Dynamics CRM
1 2 (0.14%) Magento
2 1 (0.070%) Endur
2 1 (0.070%) Loan IQ
2 1 (0.070%) Payment Gateway
2 1 (0.070%) SAP S/4HANA
Cloud Services
1 1,048 (73.03%) AWS
2 777 (54.15%) Azure
3 407 (28.36%) GCP
4 224 (15.61%) Pulumi
5 125 (8.71%) Serverless
6 122 (8.50%) Azure DevOps
7 115 (8.01%) Amazon EKS
8 114 (7.94%) GitHub
9 113 (7.87%) AWS CloudFormation
10 90 (6.27%) Amazon S3
11 83 (5.78%) Amazon EC2
12 77 (5.37%) AWS Lambda
13 71 (4.95%) GitHub Actions
14 52 (3.62%) SaaS
15 46 (3.21%) Amazon CloudWatch
16 44 (3.07%) Cloud Computing
17 34 (2.37%) Amazon SQS
18 31 (2.16%) Amazon ECS
19 27 (1.88%) OpenShift
20 24 (1.67%) Azure Monitor
Communications & Networking
1 215 (14.98%) Broadband
2 35 (2.44%) Firewall
3 24 (1.67%) TCP/IP
4 22 (1.53%) DNS
5 20 (1.39%) Network Security
6 16 (1.11%) DHCP
7 14 (0.98%) VPN
8 13 (0.91%) HTTP
8 13 (0.91%) SAN
9 12 (0.84%) LAN
9 12 (0.84%) WAN
10 9 (0.63%) Fibre Channel
11 8 (0.56%) IPsec
11 8 (0.56%) VLAN
12 6 (0.42%) Cisco IOS
12 6 (0.42%) NAS
12 6 (0.42%) VoIP
12 6 (0.42%) Wireless
13 5 (0.35%) AMQP
13 5 (0.35%) Multicast
Database & Business Intelligence
1 319 (22.23%) SQL Server
2 315 (21.95%) NoSQL
3 258 (17.98%) Relational Database
4 231 (16.10%) RDBMS
5 117 (8.15%) PostgreSQL
6 66 (4.60%) Elasticsearch
7 64 (4.46%) MongoDB
8 63 (4.39%) Amazon RDS
9 59 (4.11%) DynamoDB
10 50 (3.48%) MySQL
11 39 (2.72%) Big Data
12 31 (2.16%) Data Warehouse
13 22 (1.53%) Amazon Aurora
13 22 (1.53%) Delta Lake
14 20 (1.39%) Metadata
14 20 (1.39%) Spark SQL
15 18 (1.25%) Tick Data
16 14 (0.98%) Data Lake
17 12 (0.84%) BigQuery
17 12 (0.84%) Tableau
Development Applications
1 357 (24.88%) GitLab
2 289 (20.14%) JIRA
2 289 (20.14%) SonarQube
3 267 (18.61%) Sonatype Nexus
4 265 (18.47%) Maven
5 258 (17.98%) Cucumber
6 256 (17.84%) Selenium
7 254 (17.70%) Bitbucket
8 215 (14.98%) Jaeger
9 150 (10.45%) Git
10 126 (8.78%) Jenkins
11 29 (2.02%) MLflow
12 25 (1.74%) JUnit
13 24 (1.67%) CircleCI
14 20 (1.39%) TeamCity
15 18 (1.25%) Mockito
16 17 (1.18%) Octopus Deploy
17 14 (0.98%) IntelliJ
18 11 (0.77%) DbUnit
18 11 (0.77%) jMock
General
1 618 (43.07%) Inclusion and Diversity
2 506 (35.26%) Finance
3 328 (22.86%) Banking
4 269 (18.75%) Social Skills
5 123 (8.57%) Retail
6 104 (7.25%) Analytical Skills
7 99 (6.90%) Investment Banking
8 95 (6.62%) Marketing
9 91 (6.34%) Public Sector
10 90 (6.27%) Corporate Banking
10 90 (6.27%) Law
11 30 (2.09%) Manufacturing
12 24 (1.67%) Electronics
12 24 (1.67%) Telecoms
13 14 (0.98%) Front Office
14 13 (0.91%) Games
15 11 (0.77%) Pharmaceutical
16 10 (0.70%) Financial Institution
16 10 (0.70%) Organisational Skills
17 9 (0.63%) Dutch Language
Job Titles
1 377 (26.27%) Lead
2 370 (25.78%) Software Engineer
3 238 (16.59%) Developer
4 223 (15.54%) Team Leader
5 175 (12.20%) Senior
6 161 (11.22%) DevOps Engineer
7 70 (4.88%) Software Developer
8 64 (4.46%) Architect
9 56 (3.90%) Python Developer
10 55 (3.83%) Python Engineer
11 50 (3.48%) Senior Developer
12 49 (3.41%) Azure Engineer
12 49 (3.41%) Java Engineer
13 45 (3.14%) Platform Engineer
14 43 (3.00%) AWS Engineer
15 42 (2.93%) Cloud Engineer
15 42 (2.93%) Lead Developer
16 40 (2.79%) Data Engineer
17 38 (2.65%) Senior Software Engineer
18 36 (2.51%) AWS DevOps
Libraries, Frameworks & Software Standards
1 401 (27.94%) React
2 336 (23.41%) Spring
3 335 (23.34%) Kafka
4 324 (22.58%) Spring Boot
5 299 (20.84%) CSS
5 299 (20.84%) HTML
6 267 (18.61%) JPA
7 250 (17.42%) Redux
8 248 (17.28%) Elastic Stack
9 231 (16.10%) RESTful
10 221 (15.40%) OpenTelemetry
11 188 (13.10%) Hibernate
11 188 (13.10%) REST
12 175 (12.20%) .NET
13 101 (7.04%) Node.js
14 99 (6.90%) CSS3
14 99 (6.90%) HTML5
15 95 (6.62%) Jest
16 91 (6.34%) Sass
17 87 (6.06%) Pandas
Miscellaneous
1 280 (19.51%) Product Ownership
2 261 (18.19%) Enterprise Software
3 155 (10.80%) Cloud Native
4 81 (5.64%) Distributed Systems
5 67 (4.67%) Hybrid Cloud
6 49 (3.41%) Cyberattack
7 48 (3.34%) Management Information System
8 40 (2.79%) e-Learning
9 32 (2.23%) Linux Command Line
10 24 (1.67%) Algorithms
11 21 (1.46%) Data Centre
11 21 (1.46%) Onboarding
12 20 (1.39%) Public Cloud
13 17 (1.18%) Legacy Systems
14 16 (1.11%) Blockchain
15 14 (0.98%) Data Structures
16 13 (0.91%) Distributed Architecture
17 12 (0.84%) Hedge funds
18 10 (0.70%) Greenfield Project
18 10 (0.70%) Reinsurance
Operating Systems
1 445 (31.01%) Linux
2 241 (16.79%) Unix
3 95 (6.62%) Windows
4 55 (3.83%) Windows Server
5 49 (3.41%) Android
6 42 (2.93%) Red Hat Enterprise Linux
7 14 (0.98%) Windows Server 2019
8 13 (0.91%) Ubuntu
9 9 (0.63%) CentOS
9 9 (0.63%) Debian
10 8 (0.56%) Rocky
11 6 (0.42%) Mac OS
11 6 (0.42%) VMS
12 5 (0.35%) Windows 10
12 5 (0.35%) Windows Server 2012
12 5 (0.35%) Windows Server 2016
13 1 (0.070%) Robot Operating System
Processes & Methodologies
1 973 (67.80%) DevOps
2 871 (60.70%) Agile
3 851 (59.30%) CI/CD
4 525 (36.59%) Microservices
5 521 (36.31%) Software Engineering
6 518 (36.10%) Performance Optimisation
7 490 (34.15%) Infrastructure as Code
8 487 (33.94%) Mentoring
9 411 (28.64%) Test Automation
10 337 (23.48%) Full-Stack Development
11 311 (21.67%) Roadmaps
12 309 (21.53%) SDLC
13 290 (20.21%) Front End Development
14 288 (20.07%) Continuous Integration
15 262 (18.26%) High Availability
16 248 (17.28%) Product Management
17 241 (16.79%) Continuous Improvement
18 238 (16.59%) Cost Optimisation
19 234 (16.31%) Resource Management
19 234 (16.31%) Task Automation
Programming Languages
1 738 (51.43%) Java
2 712 (49.62%) Python
3 644 (44.88%) JavaScript
4 445 (31.01%) SQL
5 324 (22.58%) Bash
6 318 (22.16%) Go
7 155 (10.80%) TypeScript
8 132 (9.20%) C#
9 103 (7.18%) PowerShell
10 64 (4.46%) C++
11 62 (4.32%) Rust
12 19 (1.32%) Scala
13 16 (1.11%) Bicep
14 15 (1.05%) PHP
15 14 (0.98%) Shell Script
16 7 (0.49%) Ruby
17 6 (0.42%) Groovy
17 6 (0.42%) T-SQL
18 4 (0.28%) R
19 3 (0.21%) Kotlin
Qualifications
1 285 (19.86%) AWS Certification
2 154 (10.73%) Security Cleared
3 148 (10.31%) Degree
4 93 (6.48%) DV Cleared
5 73 (5.09%) Computer Science Degree
6 71 (4.95%) SC Cleared
7 57 (3.97%) Azure Certification
8 46 (3.21%) AWS Certified Solutions Architect
9 45 (3.14%) Master's Degree
10 17 (1.18%) PhD
11 12 (0.84%) BPSS Clearance
12 9 (0.63%) CISSP
12 9 (0.63%) TOGAF Certification
13 8 (0.56%) Network+ Certification
13 8 (0.56%) VMware Certified Professional (VCP)
14 7 (0.49%) AWS Certified Developer
14 7 (0.49%) CISM
14 7 (0.49%) Microsoft Certification
15 6 (0.42%) Cisco Certification
15 6 (0.42%) ISTQB
Quality Assurance & Compliance
1 338 (23.55%) QA
2 95 (6.62%) Accessibility
3 50 (3.48%) GDPR
4 33 (2.30%) HIPAA
5 22 (1.53%) NIST
6 18 (1.25%) ISO/IEC 27001
7 16 (1.11%) SOC 2
8 13 (0.91%) Data Quality
9 8 (0.56%) Cyber Essentials
10 5 (0.35%) CDISC
10 5 (0.35%) PCI DSS
11 2 (0.14%) NCSC
11 2 (0.14%) Sarbanes-Oxley
11 2 (0.14%) SLA
12 1 (0.070%) Actionable Recommendations
12 1 (0.070%) DICOM
12 1 (0.070%) EU AI Act
12 1 (0.070%) HL7
12 1 (0.070%) ISO 20022
12 1 (0.070%) SNOMED CT
System Software
1 1,104 (76.93%) Docker
2 51 (3.55%) VMware Infrastructure
3 32 (2.23%) Hyper-V
4 29 (2.02%) Active Directory
5 22 (1.53%) Virtual Machines
6 18 (1.25%) vSphere
7 16 (1.11%) VMware ESXi
8 9 (0.63%) NFS
9 5 (0.35%) Postfix
10 4 (0.28%) vCloud
11 2 (0.14%) Dovecot
11 2 (0.14%) Terminal Server
12 1 (0.070%) HDFS
12 1 (0.070%) iptables
12 1 (0.070%) KVM
12 1 (0.070%) Slurm Workload Manager
12 1 (0.070%) VMware NSX
Systems Management
1 1,089 (75.89%) Kubernetes
2 571 (39.79%) Terraform
3 400 (27.87%) Ansible
4 303 (21.11%) Prometheus
5 218 (15.19%) Argo
6 215 (14.98%) Kustomize
7 92 (6.41%) Grafana
8 24 (1.67%) Kubeflow
9 16 (1.11%) Progress Chef
10 11 (0.77%) Single Sign-On
11 10 (0.70%) SCCM
12 9 (0.63%) Docker Swarm
12 9 (0.63%) Istio
12 9 (0.63%) Microsoft Intune
12 9 (0.63%) Puppet
13 7 (0.49%) Microsoft Data Protection Manager
13 7 (0.49%) SCOM
13 7 (0.49%) vCenter Server
13 7 (0.49%) WSUS
14 6 (0.42%) Autotask
Vendors
1 296 (20.63%) Google
2 247 (17.21%) Solace
3 107 (7.46%) Microsoft
4 65 (4.53%) Red Hat
5 62 (4.32%) VMware
6 45 (3.14%) Databricks
6 45 (3.14%) IBM
7 41 (2.86%) Oracle
8 29 (2.02%) Cisco
8 29 (2.02%) Splunk
9 26 (1.81%) SAP
10 16 (1.11%) Atlassian
11 14 (0.98%) Pure Storage
12 13 (0.91%) Commvault
13 9 (0.63%) Dell
13 9 (0.63%) OpenAI
13 9 (0.63%) Ping Identity
14 8 (0.56%) Dynatrace
14 8 (0.56%) Hitachi
15 7 (0.49%) Veeam