Accessibility Jobs

Accessibility (a11y)
UK

The table below provides summary statistics for permanent job vacancies requiring Accessibility skills. It includes a benchmarking guide to the annual salaries offered in vacancies that cited Accessibility over the 6 months leading up to 16 May 2025, comparing them to the same period in the previous two years.

6 months to
16 May 2025
Same period 2024 Same period 2023
Rank 192 278 268
Rank change year-on-year +86 -10 -33
Permanent jobs citing Accessibility 913 1,032 1,341
As % of all permanent jobs advertised in the UK 1.64% 1.04% 1.34%
As % of the Quality Assurance & Compliance category 9.88% 7.58% 7.12%
Number of salaries quoted 340 629 526
10th Percentile £33,975 £31,250 £37,500
25th Percentile £45,643 £39,000 £45,000
Median annual salary (50th Percentile) £57,500 £52,500 £57,500
Median % change year-on-year +9.52% -8.70% +8.26%
75th Percentile £74,445 £66,650 £72,500
90th Percentile £92,750 £85,000 £90,000
UK excluding London median annual salary £55,000 £50,000 £54,882
% change year-on-year +10.00% -8.90% +15.68%

All Quality Assurance and Compliance Skills
UK

Accessibility falls under the Quality Assurance and Compliance category. For comparison with the information above, the following table provides summary statistics for all permanent job vacancies requiring quality assurance or compliance skills.

Permanent vacancies with a requirement for quality assurance or compliance skills 9,237 13,611 18,824
As % of all permanent jobs advertised in the UK 16.64% 13.72% 18.88%
Number of salaries quoted 4,749 9,222 8,694
10th Percentile £31,250 £27,000 £32,000
25th Percentile £44,000 £36,250 £42,500
Median annual salary (50th Percentile) £60,000 £52,500 £57,500
Median % change year-on-year +14.29% -8.70% +4.55%
75th Percentile £73,000 £70,000 £76,250
90th Percentile £90,000 £90,000 £93,750
UK excluding London median annual salary £55,000 £47,500 £50,000
% change year-on-year +15.79% -5.00% +4.17%

Accessibility
Job Vacancy Trend

Job postings citing Accessibility as a proportion of all IT jobs advertised.
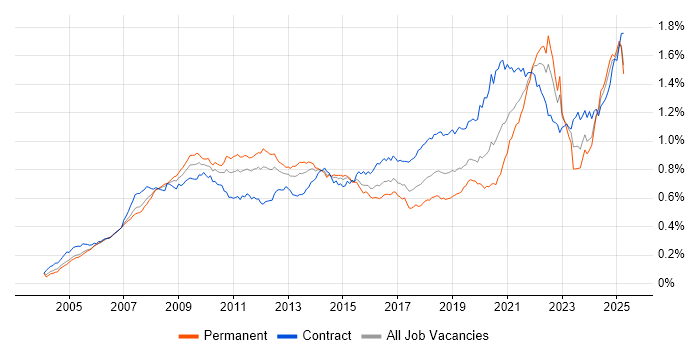
Job vacancy trend for Accessibility in the UK

Accessibility
Salary Trend

3-month moving average salary quoted in jobs citing Accessibility.

Salary trend for Accessibility in the UK

Accessibility
Salary Histogram

Salary distribution for jobs citing Accessibility over the 6 months to 16 May 2025.

Salary histogram for Accessibility in the UK

Accessibility
Top 17 Job Locations

The table below looks at the demand and provides a guide to the median salaries quoted in IT jobs citing Accessibility within the UK over the 6 months to 16 May 2025. The 'Rank Change' column provides an indication of the change in demand within each location based on the same 6 month period last year.

Location Rank Change
on Same Period
Last Year
Matching
Permanent
IT Job Ads
Median Salary
Past 6 Months
Median Salary
% Change
on Same Period
Last Year
Live
Jobs
England +88 726 £57,001 +3.64% 1,157
UK excluding London +69 539 £55,000 +10.00% 712
Work from Home +130 495 £55,000 -4.35% 762
London +139 289 £65,000 +0.78% 635
North of England -8 156 £45,000 -22.37% 205
South East +130 145 £50,000 +25.00% 236
North West -2 132 £37,500 -34.78% 95
Scotland +98 117 £90,000 +58.17% 38
South West +108 52 £68,259 +36.52% 60
Midlands -21 49 £55,000 +2.33% 79
West Midlands -10 29 £60,000 - 54
Yorkshire +22 21 £55,000 +4.76% 84
East Midlands +18 20 £50,000 +33.33% 23
Wales +32 10 £74,250 +32.83% 21
East of England +14 8 £54,721 +58.61% 56
Isle of Man - 4 - -
North East +13 3 £65,000 +12.14% 31

Accessibility
Co-occurring Skills and Capabilities by Category

The follow tables expand on the table above by listing co-occurrences grouped by category. The same employment type, locality and period is covered with up to 20 co-occurrences shown in each of the following categories:

Application Platforms
1 91 (9.97%) CMS
2 41 (4.49%) WordPress
3 28 (3.07%) Umbraco
4 16 (1.75%) Drupal
5 13 (1.42%) Apache
6 11 (1.20%) Apache Spark
6 11 (1.20%) Confluence
6 11 (1.20%) SharePoint
7 10 (1.10%) nginx
8 9 (0.99%) Apache Airflow
9 4 (0.44%) Cloud Foundry
10 3 (0.33%) GemFire
11 2 (0.22%) Adobe Experience Manager
11 2 (0.22%) ArcGIS
11 2 (0.22%) ColdFusion
11 2 (0.22%) IBM Domino
11 2 (0.22%) Jadu
12 1 (0.11%) IIS
12 1 (0.11%) Microsoft Exchange
12 1 (0.11%) Moodle
Applications
1 20 (2.19%) Adobe XD
2 17 (1.86%) Microsoft Office
3 16 (1.75%) Microsoft Excel
4 15 (1.64%) Sketch
5 13 (1.42%) Microsoft PowerPoint
6 11 (1.20%) Adobe Creative Suite
6 11 (1.20%) Adobe Premiere
7 10 (1.10%) Photoshop
8 7 (0.77%) Adobe Illustrator
9 6 (0.66%) InVision
10 5 (0.55%) Trello
11 4 (0.44%) Microsoft Project
11 4 (0.44%) MS Visio
12 2 (0.22%) InDesign
13 1 (0.11%) Adobe After Effects
13 1 (0.11%) Simulink
13 1 (0.11%) Spreadsheet
13 1 (0.11%) Zeplin
Business Applications
1 11 (1.20%) JDE OneWorld
1 11 (1.20%) NetSuite
2 5 (0.55%) CiviCRM
2 5 (0.55%) Dynamics CRM
2 5 (0.55%) Oracle EBS
2 5 (0.55%) SAP S/4HANA
3 4 (0.44%) Oracle Applications
4 3 (0.33%) Endur
5 2 (0.22%) Shopify
6 1 (0.11%) Fidessa
6 1 (0.11%) Payment Gateway
6 1 (0.11%) Salesforce CRM
6 1 (0.11%) SAP ERP
6 1 (0.11%) SAP Oil and Gas
6 1 (0.11%) Siebel CRM
Cloud Services
1 197 (21.58%) Azure
2 186 (20.37%) AWS
3 63 (6.90%) Power Platform
4 45 (4.93%) Figma
5 43 (4.71%) GCP
6 32 (3.50%) Snowflake
7 29 (3.18%) SaaS
8 26 (2.85%) Google Analytics
9 24 (2.63%) Dynamics 365
10 23 (2.52%) Azure DevOps
11 16 (1.75%) PowerApps
12 15 (1.64%) Microsoft Purview
13 14 (1.53%) Boomi
14 13 (1.42%) Collibra
14 13 (1.42%) OpenShift
15 10 (1.10%) Google Ads
16 9 (0.99%) Serverless
17 8 (0.88%) Azure Data Factory
18 7 (0.77%) Azure Synapse Analytics
18 7 (0.77%) GitHub
Communications & Networking
1 28 (3.07%) Intranet
2 15 (1.64%) Firewall
3 13 (1.42%) Network Security
3 13 (1.42%) VPN
4 7 (0.77%) DNS
5 5 (0.55%) HTTP
6 4 (0.44%) LoRaWAN
7 3 (0.33%) DHCP
8 2 (0.22%) 4G
8 2 (0.22%) Internet
8 2 (0.22%) SAN
9 1 (0.11%) Cisco Wireless
9 1 (0.11%) FIX Connectivity
9 1 (0.11%) LAN
9 1 (0.11%) MPLS
9 1 (0.11%) Spanning Tree
9 1 (0.11%) TCP/IP
9 1 (0.11%) WAN
9 1 (0.11%) Wi-Fi
9 1 (0.11%) WLAN
Database & Business Intelligence
1 128 (14.02%) SQL Server
2 58 (6.35%) Data Warehouse
3 42 (4.60%) Metadata
4 39 (4.27%) Power BI
5 34 (3.72%) Data Lake
6 30 (3.29%) NoSQL
7 23 (2.52%) Tableau
8 18 (1.97%) Relational Database
9 12 (1.31%) MongoDB
10 11 (1.20%) Hadoop
10 11 (1.20%) MySQL
11 10 (1.10%) Big Data
12 9 (0.99%) IBM InfoSphere
13 8 (0.88%) BigQuery
13 8 (0.88%) GIS
13 8 (0.88%) PostgreSQL
14 7 (0.77%) Apache Hudi
14 7 (0.77%) Apache Iceberg
14 7 (0.77%) Delta Lake
15 6 (0.66%) Redis
Development Applications
1 117 (12.81%) JIRA
2 107 (11.72%) Selenium
3 101 (11.06%) Bitbucket
4 97 (10.62%) GitLab
5 91 (9.97%) Cucumber
6 90 (9.86%) Maven
6 90 (9.86%) SonarQube
6 90 (9.86%) Sonatype Nexus
7 45 (4.93%) Git
8 16 (1.75%) Jenkins
9 14 (1.53%) Cypress.io
9 14 (1.53%) webpack
10 12 (1.31%) Axure RP
11 11 (1.20%) Postman
12 8 (0.88%) Vite
13 7 (0.77%) Balsamiq
13 7 (0.77%) JUnit
14 6 (0.66%) JMeter
14 6 (0.66%) Xcode
15 5 (0.55%) TeamCity
General
1 375 (41.07%) Finance
2 220 (24.10%) Banking
3 207 (22.67%) Social Skills
4 154 (16.87%) Inclusion and Diversity
5 127 (13.91%) Law
6 109 (11.94%) Retail
7 94 (10.30%) Analytical Skills
7 94 (10.30%) Investment Banking
8 90 (9.86%) Corporate Banking
9 87 (9.53%) Marketing
10 46 (5.04%) Legal
11 42 (4.60%) Public Sector
12 23 (2.52%) Organisational Skills
13 22 (2.41%) Manufacturing
14 21 (2.30%) Tech for Good
15 15 (1.64%) Advertising
15 15 (1.64%) Games
15 15 (1.64%) Publishing
16 13 (1.42%) Influencing Skills
17 12 (1.31%) Front Office
Job Titles
1 207 (22.67%) Senior
2 147 (16.10%) Developer
3 136 (14.90%) Designer
4 127 (13.91%) Software Engineer
5 101 (11.06%) UX Designer
6 88 (9.64%) Lead
7 83 (9.09%) Senior Designer
8 82 (8.98%) Senior UX Designer
9 53 (5.81%) Analyst
10 41 (4.49%) Front-End Developer (Client-Side Developer)
11 30 (3.29%) Senior Developer
12 28 (3.07%) UX Developer
13 24 (2.63%) Security Engineer
14 23 (2.52%) Architect
15 20 (2.19%) Umbraco Developer
16 19 (2.08%) Data Engineer
16 19 (2.08%) Junior
17 18 (1.97%) Front-End Engineer (Client-Side Engineer)
18 16 (1.75%) Consultant
18 16 (1.75%) Web Developer
Libraries, Frameworks & Software Standards
1 234 (25.63%) CSS
2 230 (25.19%) HTML
3 165 (18.07%) React
4 137 (15.01%) HTML5
5 133 (14.57%) REST
6 123 (13.47%) CSS3
7 109 (11.94%) RESTful
8 102 (11.17%) Kafka
9 99 (10.84%) Jest
10 97 (10.62%) Spring
11 95 (10.41%) Redux
12 93 (10.19%) Sass
13 91 (9.97%) Spring Boot
14 90 (9.86%) JPA
15 43 (4.71%) jQuery
16 38 (4.16%) .NET
17 25 (2.74%) JSON
18 23 (2.52%) AngularJS
19 21 (2.30%) Node.js
20 20 (2.19%) Vue
Miscellaneous
1 123 (13.47%) Product Ownership
2 95 (10.41%) Enterprise Software
3 39 (4.27%) Social Media
4 34 (3.72%) Management Information System
5 30 (3.29%) NHS
6 25 (2.74%) Self-Motivation
7 22 (2.41%) Greenfield Project
7 22 (2.41%) Mobile App
8 20 (2.19%) Algorithms
9 16 (1.75%) FMCG
10 15 (1.64%) Virtual Team
11 14 (1.53%) Analytical Mindset
12 13 (1.42%) Cloud Native
12 13 (1.42%) Data Structures
12 13 (1.42%) Derivative
13 11 (1.20%) Learning Management System
14 9 (0.99%) Educational Technology
15 8 (0.88%) Public Cloud
15 8 (0.88%) Renewable Energy
16 7 (0.77%) IoT
Operating Systems
1 25 (2.74%) Android
2 24 (2.63%) Apple iOS
3 16 (1.75%) Unix
4 15 (1.64%) Windows
5 12 (1.31%) Linux
6 2 (0.22%) Windows 10
6 2 (0.22%) Windows Vista
7 1 (0.11%) Windows Server
Processes & Methodologies
1 392 (42.94%) Agile
2 365 (39.98%) User Experience
3 180 (19.72%) Stakeholder Management
4 178 (19.50%) UX Design
5 177 (19.39%) Project Management
6 172 (18.84%) User-Centered Design (UCD)
7 169 (18.51%) Mentoring
8 168 (18.40%) User Research
9 161 (17.63%) Software Engineering
10 159 (17.42%) DevOps
11 155 (16.98%) CI/CD
12 154 (16.87%) Analytics
13 150 (16.43%) Front End Development
14 147 (16.10%) Usability Testing
15 142 (15.55%) Problem-Solving
15 142 (15.55%) Wireframes
16 132 (14.46%) Prototyping
17 129 (14.13%) Test Automation
18 127 (13.91%) Responsive Web Design
19 118 (12.92%) Full-Stack Development
Programming Languages
1 233 (25.52%) JavaScript
2 220 (24.10%) SQL
3 134 (14.68%) TypeScript
4 121 (13.25%) Java
5 109 (11.94%) Python
6 46 (5.04%) C#
7 32 (3.50%) PHP
8 15 (1.64%) Go
9 11 (1.20%) Scala
10 9 (0.99%) PowerShell
10 9 (0.99%) Swift
11 7 (0.77%) Elixir
11 7 (0.77%) Perl
12 6 (0.66%) Clojure
12 6 (0.66%) Rust
13 5 (0.55%) C++
13 5 (0.55%) Kotlin
13 5 (0.55%) PL/SQL
13 5 (0.55%) Shell Script
14 4 (0.44%) Ruby
Qualifications
1 170 (18.62%) Degree
2 33 (3.61%) Security Cleared
3 23 (2.52%) SC Cleared
4 22 (2.41%) Master's Degree
5 21 (2.30%) CISSP
6 16 (1.75%) DBS Check
7 13 (1.42%) BPSS Clearance
7 13 (1.42%) CISM
8 12 (1.31%) Computer Science Degree
9 7 (0.77%) ISTQB
10 6 (0.66%) Microsoft Certification
11 5 (0.55%) DV Cleared
11 5 (0.55%) SAP Certification
12 4 (0.44%) Cisco Certification
12 4 (0.44%) CREST Certified
12 4 (0.44%) OCA
12 4 (0.44%) OCP
12 4 (0.44%) Oracle Certification
12 4 (0.44%) SANS
13 2 (0.22%) CRISC
Quality Assurance & Compliance
1 140 (15.33%) QA
2 80 (8.76%) Data Quality
2 80 (8.76%) WCAG
3 60 (6.57%) GDPR
4 23 (2.52%) NIST
5 12 (1.31%) NCSC
6 7 (0.77%) Actionable Recommendations
6 7 (0.77%) SLA
7 3 (0.33%) California Consumer Privacy Act
7 3 (0.33%) IFRS
8 2 (0.22%) GAAP
8 2 (0.22%) GLP
8 2 (0.22%) Good Clinical Practice
8 2 (0.22%) ISO/IEC 27001
8 2 (0.22%) PCI DSS
8 2 (0.22%) Sarbanes-Oxley
8 2 (0.22%) WAI
9 1 (0.11%) Cyber Essentials
9 1 (0.11%) HIPAA
9 1 (0.11%) MiFID
System Software
1 117 (12.81%) Docker
2 9 (0.99%) HDFS
3 3 (0.33%) Firmware
4 2 (0.22%) Active Directory
4 2 (0.22%) Virtual Machines
5 1 (0.11%) VMware Infrastructure
Systems Management
1 131 (14.35%) Kubernetes
2 5 (0.55%) Oracle RMAN
3 4 (0.44%) Terraform
4 2 (0.22%) Ansible
4 2 (0.22%) Hadoop YARN
5 1 (0.11%) cPanel
5 1 (0.11%) QRadar
Vendors
1 99 (10.84%) Microsoft
2 93 (10.19%) Solace
3 55 (6.02%) Adobe
4 47 (5.15%) Google
5 23 (2.52%) Salesforce
6 19 (2.08%) ATG
6 19 (2.08%) HP
7 15 (1.64%) SAP
8 14 (1.53%) Informatica
9 12 (1.31%) YouTube
10 11 (1.20%) Dell
11 10 (1.10%) IBM
11 10 (1.10%) Mercator
11 10 (1.10%) Oracle
12 8 (0.88%) Cisco
13 7 (0.77%) Red Hat
14 6 (0.66%) Instagram
15 5 (0.55%) Apple
15 5 (0.55%) Facebook
15 5 (0.55%) TOWER Software