Ansible
UK

The following table provides summary statistics for permanent job vacancies with a requirement for Ansible skills. Included is a benchmarking guide to the salaries offered in vacancies that have cited Ansible over the 6 months to 13 May 2024 with a comparison to the same period in the previous 2 years.

6 months to
13 May 2024
Same period 2023 Same period 2022
Rank 204 126 107
Rank change year-on-year -78 -19 -19
Permanent jobs citing Ansible 1,450 2,795 5,249
As % of all permanent jobs advertised in the UK 1.46% 2.76% 3.30%
As % of the Systems Management category 14.70% 18.86% 18.08%
Number of salaries quoted 981 1,391 2,357
10th Percentile £43,000 £46,250 £45,500
25th Percentile £52,500 £56,875 £55,000
Median annual salary (50th Percentile) £70,000 £72,500 £70,000
Median % change year-on-year -3.45% +3.57% +7.69%
75th Percentile £87,500 £90,000 £90,000
90th Percentile £100,000 £105,000 £107,500
UK excluding London median annual salary £60,000 £65,000 £60,000
% change year-on-year -7.69% +8.33% -

All Systems Management Skills
UK

Ansible is in the Systems Management category. The following table is for comparison with the above and provides summary statistics for all permanent job vacancies with a requirement for systems management skills.

Permanent vacancies with a requirement for systems management skills 9,861 14,822 29,030
As % of all permanent jobs advertised in the UK 9.96% 14.64% 18.28%
Number of salaries quoted 7,101 9,201 14,160
10th Percentile £32,750 £35,500 £37,500
25th Percentile £45,000 £48,091 £48,750
Median annual salary (50th Percentile) £60,500 £67,500 £70,000
Median % change year-on-year -10.37% -3.57% +12.00%
75th Percentile £82,500 £87,500 £86,250
90th Percentile £100,000 £105,000 £102,500
UK excluding London median annual salary £55,000 £57,810 £60,000
% change year-on-year -4.86% -3.65% +9.09%

Ansible
Job Vacancy Trend

Job postings citing Ansible as a proportion of all IT jobs advertised.
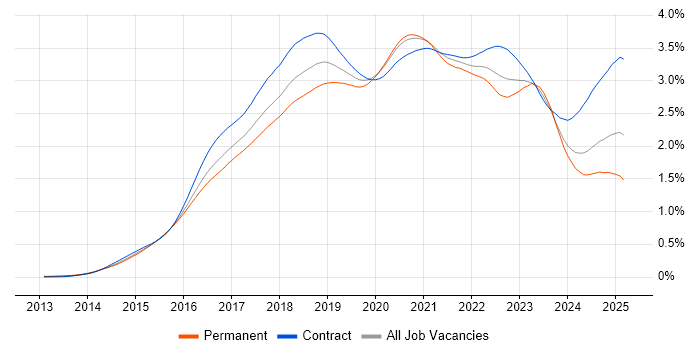
Job vacancy trend for Ansible in the UK

Ansible
Salary Trend

3-month moving average salary quoted in jobs citing Ansible.

Salary trend for Ansible in the UK

Ansible
Salary Histogram

Salary distribution for jobs citing Ansible over the 6 months to 13 May 2024.

Salary histogram for Ansible in the UK

Ansible
Top 17 Job Locations

The table below looks at the demand and provides a guide to the median salaries quoted in IT jobs citing Ansible within the UK over the 6 months to 13 May 2024. The 'Rank Change' column provides an indication of the change in demand within each location based on the same 6 month period last year.

Location Rank Change
on Same Period
Last Year
Matching
Permanent
IT Job Ads
Median Salary
Past 6 Months
Median Salary
% Change
on Same Period
Last Year
Live
Jobs
England -62 1,253 £70,000 -0.71% 293
UK excluding London -83 934 £60,000 -7.69% 166
Work from Home -40 733 £67,500 -6.90% 169
London -45 460 £80,000 - 141
South West -17 287 £56,750 -9.13% 44
South East -22 254 £60,000 -14.29% 45
North of England -76 162 £62,783 -5.48% 27
North West -77 97 £62,783 -6.99% 21
Scotland -112 68 £65,000 -13.33% 9
Midlands -86 57 £57,500 -11.54% 17
Yorkshire -20 54 £62,783 -3.41% 3
Wales -5 53 £50,000 -14.89% 4
East of England -29 43 £60,000 -7.69% 18
West Midlands -33 29 £60,000 -12.41% 9
East Midlands -50 28 £57,500 +27.78% 8
North East -4 13 £62,783 +19.59% 3
Northern Ireland -4 13 £90,000 +38.46% 5

Ansible
Co-occurring Skills and Capabilities by Category

The follow tables expand on the table above by listing co-occurrences grouped by category. The same employment type, locality and period is covered with up to 20 co-occurrences shown in each of the following categories:

Application Platforms
1 145 (10.00%) Apache
2 72 (4.97%) OpenStack
3 60 (4.14%) Apache Spark
4 50 (3.45%) nginx
5 22 (1.52%) Jupyter
6 17 (1.17%) Confluence
7 15 (1.03%) JBoss
8 13 (0.90%) Microsoft Exchange
9 11 (0.76%) Red Hat Fuse
10 10 (0.69%) IIS
11 6 (0.41%) Tomcat
12 4 (0.28%) Apache Airflow
12 4 (0.28%) Drupal
13 3 (0.21%) CloudStack
13 3 (0.21%) MQSeries
14 2 (0.14%) SharePoint
15 1 (0.069%) WebLogic
15 1 (0.069%) WebSphere
15 1 (0.069%) WordPress
Applications
1 17 (1.17%) Microsoft Office
2 14 (0.97%) Simulink
3 10 (0.69%) Microsoft Excel
4 1 (0.069%) AutoCAD
4 1 (0.069%) PTC Creo
4 1 (0.069%) SOLIDWORKS
4 1 (0.069%) Weka
Business Applications
1 3 (0.21%) Dynamics NAV
2 2 (0.14%) SAP Business One
3 1 (0.069%) Oracle Applications
Cloud Services
1 749 (51.66%) AWS
2 614 (42.34%) Azure
3 213 (14.69%) GCP
4 161 (11.10%) OpenShift
5 137 (9.45%) Serverless
6 127 (8.76%) Amazon S3
7 120 (8.28%) GitHub
8 115 (7.93%) Amazon EKS
9 88 (6.07%) SaaS
10 86 (5.93%) Azure DevOps
11 83 (5.72%) PaaS
12 82 (5.66%) AWS CloudFormation
13 81 (5.59%) Amazon ECS
14 73 (5.03%) IaaS
15 72 (4.97%) AWS Lambda
16 55 (3.79%) Amazon EC2
17 52 (3.59%) GitHub Actions
18 42 (2.90%) Microsoft 365
19 38 (2.62%) Cloud Computing
20 27 (1.86%) Amazon CloudWatch
Communications & Networking
1 281 (19.38%) Firewall
2 149 (10.28%) VPN
3 135 (9.31%) DNS
4 120 (8.28%) Internet
5 95 (6.55%) WAN
6 86 (5.93%) TCP/IP
7 76 (5.24%) DHCP
8 70 (4.83%) SNMP
9 68 (4.69%) LAN
10 62 (4.28%) IPsec
11 42 (2.90%) HTTP
12 33 (2.28%) Wireless
13 31 (2.14%) AMQP
14 29 (2.00%) SAN
15 26 (1.79%) Network Security
16 25 (1.72%) BGP
17 24 (1.66%) Cisco ASA
18 23 (1.59%) SD-WAN
19 22 (1.52%) SSL
20 17 (1.17%) VSAN
Database & Business Intelligence
1 140 (9.66%) PostgreSQL
2 105 (7.24%) Elasticsearch
3 94 (6.48%) MongoDB
4 76 (5.24%) Big Data
5 75 (5.17%) MySQL
6 71 (4.90%) NoSQL
7 60 (4.14%) SQL Server
8 51 (3.52%) Relational Database
9 50 (3.45%) Hadoop
10 26 (1.79%) Cloudera CDH
10 26 (1.79%) MariaDB
10 26 (1.79%) Redis
11 24 (1.66%) Amazon RDS
12 20 (1.38%) Azure SQL Database
12 20 (1.38%) InfluxDB
12 20 (1.38%) Power BI
13 18 (1.24%) Presto
14 13 (0.90%) Amazon Redshift
15 12 (0.83%) BigQuery
15 12 (0.83%) Data Warehouse
Development Applications
1 379 (26.14%) Jenkins
2 290 (20.00%) Git
3 124 (8.55%) GitLab
4 108 (7.45%) JIRA
5 39 (2.69%) Bitbucket
5 39 (2.69%) Sonatype Nexus
6 30 (2.07%) Artifactory
6 30 (2.07%) SonarQube
7 29 (2.00%) Subversion
7 29 (2.00%) TeamCity
8 25 (1.72%) Vagrant
9 21 (1.45%) Atlassian Bamboo
10 20 (1.38%) JUnit
11 19 (1.31%) Selenium
12 18 (1.24%) IBM UrbanCode
13 16 (1.10%) Octopus Deploy
14 15 (1.03%) Maven
15 13 (0.90%) CircleCI
15 13 (0.90%) Team Foundation Server
16 10 (0.69%) Trac
General
1 266 (18.34%) Finance
2 256 (17.66%) Social Skills
3 158 (10.90%) Aerospace
4 99 (6.83%) Public Sector
5 75 (5.17%) Banking
6 62 (4.28%) Analytical Skills
7 57 (3.93%) Retail
8 38 (2.62%) Telecoms
9 35 (2.41%) Inclusion and Diversity
10 30 (2.07%) Presentation Skills
11 24 (1.66%) Legal
12 23 (1.59%) Law
13 18 (1.24%) Investment Banking
14 14 (0.97%) Automotive
15 10 (0.69%) Financial Institution
16 9 (0.62%) Organisational Skills
16 9 (0.62%) Tech for Good
17 7 (0.48%) Pharmaceutical
17 7 (0.48%) Publishing
18 6 (0.41%) Front Office
Job Titles
1 332 (22.90%) DevOps Engineer
2 295 (20.34%) Senior
3 210 (14.48%) Infrastructure Engineer
4 126 (8.69%) Cloud Engineer
5 123 (8.48%) Linux Engineer
6 115 (7.93%) Software Engineer
7 108 (7.45%) Developer
8 93 (6.41%) AWS Engineer
9 91 (6.28%) Architect
9 91 (6.28%) Senior Infrastructure Engineer
10 90 (6.21%) Consultant
11 79 (5.45%) Senior DevOps
12 78 (5.38%) Senior DevOps Engineer
13 75 (5.17%) Lead
14 67 (4.62%) Java Developer
14 67 (4.62%) Platform Engineer
15 59 (4.07%) Azure Engineer
16 54 (3.72%) NetApp Consultant
17 53 (3.66%) AWS DevOps
18 49 (3.38%) AWS DevOps Engineer
Libraries, Frameworks & Software Standards
1 120 (8.28%) RabbitMQ
2 116 (8.00%) Elastic Stack
3 100 (6.90%) Spring
4 98 (6.76%) Node.js
5 97 (6.69%) Spring Boot
6 91 (6.28%) YAML
7 88 (6.07%) REST
8 79 (5.45%) AngularJS
9 67 (4.62%) JSON
10 64 (4.41%) .NET
11 61 (4.21%) XML
12 58 (4.00%) Web Services
13 50 (3.45%) React
14 46 (3.17%) Kafka
15 44 (3.03%) Apache Camel
16 39 (2.69%) Swagger
17 29 (2.00%) Apache NiFi
17 29 (2.00%) Middleware
18 27 (1.86%) OpenAPI
19 26 (1.79%) Material-UI
Miscellaneous
1 142 (9.79%) Data Centre
2 133 (9.17%) Public Cloud
3 74 (5.10%) Distributed Systems
3 74 (5.10%) Hybrid Cloud
4 73 (5.03%) Cloud Native
5 57 (3.93%) Management Information System
6 46 (3.17%) Linux Command Line
7 44 (3.03%) PKI
8 37 (2.55%) Self-Motivation
9 34 (2.34%) Clustering
10 31 (2.14%) Replication
11 28 (1.93%) Onboarding
12 22 (1.52%) IoT
13 21 (1.45%) Greenfield Project
14 19 (1.31%) Legacy Systems
15 18 (1.24%) Enterprise Cloud
16 16 (1.10%) Cyber Defence
17 15 (1.03%) Product Ownership
17 15 (1.03%) Virtual Team
18 13 (0.90%) Private Cloud
Operating Systems
1 858 (59.17%) Linux
2 403 (27.79%) Windows
3 223 (15.38%) Red Hat Enterprise Linux
4 127 (8.76%) CentOS
5 103 (7.10%) Windows Server
6 101 (6.97%) Ubuntu
7 58 (4.00%) Unix
8 55 (3.79%) Data ONTAP
9 42 (2.90%) VMS
10 34 (2.34%) Debian
11 22 (1.52%) Windows Server 2019
12 21 (1.45%) Android
13 20 (1.38%) CoreOS
13 20 (1.38%) Solaris
14 19 (1.31%) Oracle Linux
15 18 (1.24%) Windows Server 2016
16 12 (0.83%) Windows 10
17 8 (0.55%) AIX
17 8 (0.55%) Windows Server 2012
18 6 (0.41%) Apple iOS
Processes & Methodologies
1 761 (52.48%) DevOps
2 528 (36.41%) Agile
3 428 (29.52%) CI/CD
4 406 (28.00%) Infrastructure as Code
5 259 (17.86%) Infrastructure Engineering
6 258 (17.79%) Actionable Insight
7 237 (16.34%) Configuration Management
8 235 (16.21%) Problem-Solving
9 224 (15.45%) Software Engineering
10 222 (15.31%) Containerisation
11 189 (13.03%) Mentoring
12 186 (12.83%) Collaborative Working
13 181 (12.48%) Scrum
14 160 (11.03%) Microservices
15 151 (10.41%) Kanban
16 146 (10.07%) Continuous Integration
17 139 (9.59%) Project Management
18 127 (8.76%) Test Automation
19 116 (8.00%) ITIL
20 114 (7.86%) Open Source
Programming Languages
1 681 (46.97%) Python
2 335 (23.10%) Java
3 295 (20.34%) Bash
4 290 (20.00%) PowerShell
5 147 (10.14%) JavaScript
5 147 (10.14%) SQL
6 86 (5.93%) Shell Script
7 78 (5.38%) Go
8 70 (4.83%) Perl
9 69 (4.76%) Kotlin
10 62 (4.28%) C#
11 48 (3.31%) Scala
12 46 (3.17%) Ruby
13 35 (2.41%) C
13 35 (2.41%) C++
14 32 (2.21%) Groovy
15 23 (1.59%) PHP
16 20 (1.38%) TypeScript
17 14 (0.97%) Rust
18 11 (0.76%) Bicep
Qualifications
1 528 (36.41%) Security Cleared
2 271 (18.69%) SC Cleared
3 262 (18.07%) DV Cleared
4 117 (8.07%) Degree
5 52 (3.59%) Computer Science Degree
6 43 (2.97%) Cisco Certification
7 33 (2.28%) Azure Certification
8 30 (2.07%) AWS Certification
9 27 (1.86%) CISSP
10 25 (1.72%) CCNA
11 24 (1.66%) CCNP
12 21 (1.45%) BPSS Clearance
13 16 (1.10%) CISM
13 16 (1.10%) CRISC
13 16 (1.10%) GIAC
13 16 (1.10%) ISSMP
14 12 (0.83%) Master's Degree
15 11 (0.76%) CCIE
16 10 (0.69%) ITIL Foundation Certificate
17 9 (0.62%) AWS Certified Solutions Architect
Quality Assurance & Compliance
1 33 (2.28%) QA
2 16 (1.10%) COBIT
3 14 (0.97%) NCSC
4 13 (0.90%) ISO/IEC 27001
5 12 (0.83%) GDPR
6 8 (0.55%) PCI DSS
7 5 (0.34%) HIPAA
7 5 (0.34%) SLA
8 3 (0.21%) NIST
9 2 (0.14%) Cyber Essentials
9 2 (0.14%) Cyber Essentials PLUS
10 1 (0.069%) Data Quality
10 1 (0.069%) Disclosure Scotland
10 1 (0.069%) ISO 9001
10 1 (0.069%) SEPA
System Software
1 574 (39.59%) Docker
2 200 (13.79%) VMware Infrastructure
3 130 (8.97%) Active Directory
4 114 (7.86%) Hyper-V
5 55 (3.79%) Virtual Machines
6 29 (2.00%) VMware ESXi
7 19 (1.31%) Firmware
7 19 (1.31%) NFS
7 19 (1.31%) vSphere
8 13 (0.90%) KVM
8 13 (0.90%) VMware NSX
9 10 (0.69%) Ceph
9 10 (0.69%) pfSense
10 8 (0.55%) Virtual Desktop
11 6 (0.41%) DFS Replication
12 5 (0.34%) Citrix Hypervisor
13 4 (0.28%) Embedded Firmware
13 4 (0.28%) Slurm Workload Manager
13 4 (0.28%) Virtual Servers
14 3 (0.21%) oVirt
Systems Management
1 784 (54.07%) Terraform
2 657 (45.31%) Kubernetes
3 332 (22.90%) Puppet
4 178 (12.28%) Progress Chef
5 137 (9.45%) Prometheus
6 98 (6.76%) Grafana
7 94 (6.48%) vCenter Server
8 41 (2.83%) Nagios
9 37 (2.55%) HAProxy
10 36 (2.48%) ZABBIX
11 31 (2.14%) Docker Swarm
12 29 (2.00%) Kibana
13 23 (1.59%) Salt
14 22 (1.52%) SCCM
15 21 (1.45%) Packer
16 20 (1.38%) Rancher
17 17 (1.17%) Red Hat Satellite
18 16 (1.10%) Active Directory Federation Services
18 16 (1.10%) Microsoft Data Protection Manager
18 16 (1.10%) Single Sign-On
Vendors
1 259 (17.86%) Red Hat
2 256 (17.66%) VMware
3 148 (10.21%) Microsoft
4 95 (6.55%) Google
5 77 (5.31%) Cisco
6 75 (5.17%) Palo Alto
7 71 (4.90%) NetApp
8 65 (4.48%) Oracle
9 54 (3.72%) SolidFire
10 42 (2.90%) SaltStack
10 42 (2.90%) WSO2
11 35 (2.41%) Fortinet
11 35 (2.41%) Splunk
12 30 (2.07%) Atlassian
13 28 (1.93%) Juniper
14 26 (1.79%) McAfee
15 25 (1.72%) ServiceNow
16 24 (1.66%) IBM
16 24 (1.66%) New Relic
17 23 (1.59%) Veeam