C#
UK

The table below provides summary statistics for permanent job vacancies requiring C# skills. It includes a benchmarking guide to the annual salaries offered in vacancies that cited C# over the 6 months leading up to 26 April 2025, comparing them to the same period in the previous two years.

6 months to
26 Apr 2025
Same period 2024 Same period 2023
Rank 47 19 20
Rank change year-on-year -28 +1 -1
Permanent jobs citing C# 2,649 8,104 10,181
As % of all permanent jobs advertised in the UK 5.13% 8.26% 9.68%
As % of the Programming Languages category 16.78% 24.42% 22.22%
Number of salaries quoted 2,222 6,848 7,547
10th Percentile £38,750 £36,250 £40,000
25th Percentile £47,500 £43,750 £48,750
Median annual salary (50th Percentile) £62,500 £57,500 £62,500
Median % change year-on-year +8.70% -8.00% +5.04%
75th Percentile £77,500 £72,500 £81,250
90th Percentile £95,000 £93,250 £97,500
UK excluding London median annual salary £57,500 £55,000 £55,000
% change year-on-year +4.55% - +4.76%

All Programming Languages
UK

C# falls under the Programming Languages category. For comparison with the information above, the following table provides summary statistics for all permanent job vacancies requiring coding skills.

Permanent vacancies with a requirement for coding skills 15,788 33,192 45,823
As % of all permanent jobs advertised in the UK 30.59% 33.81% 43.57%
Number of salaries quoted 11,630 25,038 29,105
10th Percentile £37,500 £35,000 £38,750
25th Percentile £47,683 £45,000 £49,500
Median annual salary (50th Percentile) £60,000 £60,000 £65,000
Median % change year-on-year - -7.69% +4.00%
75th Percentile £82,500 £77,500 £86,250
90th Percentile £106,250 £100,000 £106,250
UK excluding London median annual salary £55,000 £54,000 £55,000
% change year-on-year +1.85% -1.82% +1.85%

C#
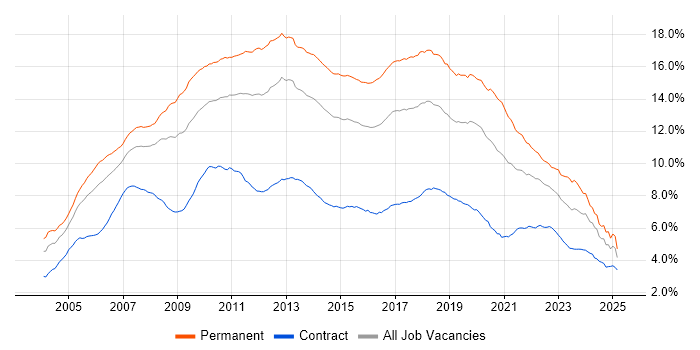
Job Vacancy Trend

Job postings citing C# as a proportion of all IT jobs advertised.

Job vacancy trend for C# in the UK

C#
Salary Trend

3-month moving average salary quoted in jobs citing C#.

Salary trend for C# in the UK

C#
Salary Histogram

Salary distribution for jobs citing C# over the 6 months to 26 April 2025.

Salary histogram for C# in the UK

C#
Top 17 Job Locations

The table below looks at the demand and provides a guide to the median salaries quoted in IT jobs citing C# within the UK over the 6 months to 26 April 2025. The 'Rank Change' column provides an indication of the change in demand within each location based on the same 6 month period last year.

Location Rank Change
on Same Period
Last Year
Matching
Permanent
IT Job Ads
Median Salary
Past 6 Months
Median Salary
% Change
on Same Period
Last Year
Live
Jobs
England -28 2,401 £62,500 +6.84% 2,487
UK excluding London -27 1,815 £57,500 +4.55% 1,531
Work from Home -10 1,248 £65,000 +13.04% 1,406
London -28 704 £75,000 -3.23% 1,124
South East -24 461 £60,000 +4.35% 385
North of England -52 433 £52,500 -4.55% 450
Midlands -23 347 £55,000 +10.00% 259
East of England -1 276 £66,206 +15.14% 166
North West -72 252 £50,055 -6.15% 239
West Midlands -16 241 £55,000 +4.76% 143
South West -44 134 £55,000 +10.00% 140
Yorkshire -31 119 £56,000 +6.67% 149
Scotland +4 112 £45,000 -18.18% 87
East Midlands -33 105 £55,000 +10.00% 114
North East 0 62 £57,500 -4.17% 68
Wales -23 46 £62,500 +25.00% 46
Northern Ireland -16 7 - - 32

C#
Co-occurring Skills and Capabilities by Category

The follow tables expand on the table above by listing co-occurrences grouped by category. The same employment type, locality and period is covered with up to 20 co-occurrences shown in each of the following categories:

Application Platforms
1 98 (3.70%) SharePoint
2 62 (2.34%) Confluence
3 56 (2.11%) CMS
4 37 (1.40%) Umbraco
5 30 (1.13%) Apache
6 21 (0.79%) IIS
7 11 (0.42%) Microsoft Exchange
8 7 (0.26%) Apache Spark
8 7 (0.26%) Kinematics
9 6 (0.23%) NServiceBus
9 6 (0.23%) WordPress
10 5 (0.19%) Apache Airflow
10 5 (0.19%) Headless CMS
10 5 (0.19%) Sitecore CMS
10 5 (0.19%) Sitefinity
10 5 (0.19%) WinCC
11 4 (0.15%) Kentico
12 3 (0.11%) Apache Solr
12 3 (0.11%) OpenEdge
12 3 (0.11%) Oracle SOA Suite
Applications
1 129 (4.87%) Chatbot
2 30 (1.13%) Microsoft Office
3 22 (0.83%) Microsoft Excel
4 13 (0.49%) Trello
5 9 (0.34%) Revit
6 7 (0.26%) MS Visio
7 5 (0.19%) Microsoft PowerPoint
8 3 (0.11%) Adobe XD
8 3 (0.11%) AutoCAD
8 3 (0.11%) Productboard
9 2 (0.076%) Microsoft Project
10 1 (0.038%) Adobe Illustrator
10 1 (0.038%) GNU Octave
10 1 (0.038%) InVision
10 1 (0.038%) Photoshop
10 1 (0.038%) Sketch
10 1 (0.038%) S-PLUS
Business Applications
1 124 (4.68%) Dynamics CRM
2 18 (0.68%) Sage 200
2 18 (0.68%) Sage 50
3 15 (0.57%) Payment Gateway
4 11 (0.42%) Endur
5 8 (0.30%) Elite 3E
5 8 (0.30%) Oracle EBS
5 8 (0.30%) Orchestrade
6 7 (0.26%) Magento
7 5 (0.19%) Shopify
8 4 (0.15%) SAP Business One
9 2 (0.076%) Dynamics GP
9 2 (0.076%) Eikon
9 2 (0.076%) Infor CloudSuite
9 2 (0.076%) Infor CloudSuite Industrial (formerly SyteLine)
9 2 (0.076%) RMDS
10 1 (0.038%) Carpe Diem
10 1 (0.038%) JDE EnterpriseOne
10 1 (0.038%) Visualfiles
Cloud Services
1 1,134 (42.81%) Azure
2 361 (13.63%) AWS
3 353 (13.33%) Azure DevOps
4 307 (11.59%) Power Platform
5 234 (8.83%) Dynamics 365
6 185 (6.98%) SaaS
7 150 (5.66%) PowerApps
8 145 (5.47%) Power Automate
9 140 (5.29%) Serverless
10 139 (5.25%) GitHub
11 109 (4.11%) Azure Service Bus
12 103 (3.89%) Azure Logic Apps
13 71 (2.68%) Azure Cosmos DB
14 70 (2.64%) Microsoft 365
15 66 (2.49%) Azure Data Factory
15 66 (2.49%) GCP
16 60 (2.27%) Azure Functions
17 43 (1.62%) AWS Lambda
18 40 (1.51%) GitHub Actions
19 38 (1.43%) Azure Synapse Analytics
Communications & Networking
1 29 (1.09%) Network Security
2 26 (0.98%) HTTP
2 26 (0.98%) TCP/IP
3 24 (0.91%) Intranet
4 16 (0.60%) Firewall
5 12 (0.45%) Modbus
5 12 (0.45%) MQTT
6 11 (0.42%) Internet
7 10 (0.38%) Intrusion Detection
8 8 (0.30%) Ethernet
9 6 (0.23%) DNS
10 5 (0.19%) HTTPS
11 4 (0.15%) SSL
12 3 (0.11%) Wireshark
13 2 (0.076%) Broadband
13 2 (0.076%) SAN
14 1 (0.038%) Bluetooth
14 1 (0.038%) FTP
14 1 (0.038%) GSM
14 1 (0.038%) SMS
Database & Business Intelligence
1 694 (26.20%) SQL Server
2 125 (4.72%) MySQL
3 121 (4.57%) Relational Database
4 119 (4.49%) NoSQL
5 106 (4.00%) MongoDB
6 102 (3.85%) Power BI
7 96 (3.62%) SQL Server Integration Services
8 94 (3.55%) Azure SQL Database
9 91 (3.44%) SQL Server Reporting Services
10 80 (3.02%) PostgreSQL
11 72 (2.72%) Elasticsearch
12 38 (1.43%) Redis
13 34 (1.28%) Big Data
13 34 (1.28%) Data Warehouse
14 32 (1.21%) DB2
15 26 (0.98%) RDBMS
16 18 (0.68%) Data Lake
17 14 (0.53%) DynamoDB
17 14 (0.53%) MS Access
18 12 (0.45%) Tableau
Development Applications
1 353 (13.33%) Git
2 200 (7.55%) Visual Studio
3 165 (6.23%) JIRA
4 84 (3.17%) Selenium
5 77 (2.91%) Octopus Deploy
6 73 (2.76%) Jenkins
7 68 (2.57%) Bitbucket
8 55 (2.08%) Team Foundation Server
9 43 (1.62%) NUnit
10 40 (1.51%) MSBuild
10 40 (1.51%) TeamCity
11 33 (1.25%) Postman
12 30 (1.13%) SpecFlow
13 29 (1.09%) Cypress.io
14 26 (0.98%) Eclipse
14 26 (0.98%) Eclipse RCP
15 25 (0.94%) GitLab
16 20 (0.76%) Visual Studio Code
17 18 (0.68%) Atlassian Bamboo
18 17 (0.64%) MSTest
General
1 652 (24.61%) Social Skills
2 442 (16.69%) Finance
3 169 (6.38%) Analytical Skills
4 120 (4.53%) Retail
5 118 (4.45%) Law
6 115 (4.34%) Banking
7 93 (3.51%) Manufacturing
8 83 (3.13%) Inclusion and Diversity
9 65 (2.45%) Public Sector
10 57 (2.15%) Electronics
11 52 (1.96%) Front Office
11 52 (1.96%) Marketing
12 40 (1.51%) Legal
13 38 (1.43%) Automotive
14 29 (1.09%) Investment Banking
15 25 (0.94%) Games
15 25 (0.94%) Tech for Good
16 20 (0.76%) Back Office
16 20 (0.76%) Organisational Skills
17 19 (0.72%) Retail Banking
Job Titles
1 1,335 (50.40%) Developer
2 683 (25.78%) Senior
3 481 (18.16%) Software Engineer
4 371 (14.01%) .NET Developer
5 355 (13.40%) C# Developer
6 350 (13.21%) Senior Developer
7 309 (11.66%) Lead
8 239 (9.02%) Software Developer
9 166 (6.27%) Senior Software Engineer
10 162 (6.12%) Full-Stack Developer
11 148 (5.59%) C# .NET Developer
12 117 (4.42%) Trainer
13 113 (4.27%) Dynamics 365 Developer
14 111 (4.19%) Architect
15 103 (3.89%) Senior C# Developer
16 99 (3.74%) Analyst
17 91 (3.44%) Senior .NET Developer
18 81 (3.06%) Lead Developer
19 72 (2.72%) Graduate
20 71 (2.68%) Team Leader
Libraries, Frameworks & Software Standards
1 1,639 (61.87%) .NET
2 568 (21.44%) HTML
3 463 (17.48%) CSS
4 427 (16.12%) ASP.NET
5 424 (16.01%) .NET Core
6 401 (15.14%) React
7 395 (14.91%) .NET Framework
8 328 (12.38%) AngularJS
9 209 (7.89%) REST
10 207 (7.81%) RESTful
11 194 (7.32%) Entity Framework
12 154 (5.81%) ASP.NET Web API
13 153 (5.78%) HTML5
14 140 (5.29%) XML
15 126 (4.76%) Web Services
16 122 (4.61%) ASP.NET MVC
17 121 (4.57%) jQuery
18 112 (4.23%) Blazor
19 106 (4.00%) JSON
20 92 (3.47%) Node.js
Miscellaneous
1 94 (3.55%) Cloud Native
2 90 (3.40%) Greenfield Project
2 90 (3.40%) Product Ownership
3 87 (3.28%) Mobile App
4 58 (2.19%) Distributed Systems
5 57 (2.15%) Algorithms
5 57 (2.15%) Management Information System
6 52 (1.96%) Data Structures
7 48 (1.81%) Legacy Applications
8 41 (1.55%) Enterprise Software
8 41 (1.55%) Legacy Systems
9 35 (1.32%) Self-Motivation
10 33 (1.25%) NHS
11 29 (1.09%) Public Cloud
12 28 (1.06%) IoT
12 28 (1.06%) Virtual Team
13 27 (1.02%) Onboarding
14 25 (0.94%) Client/Server
15 23 (0.87%) Hedge funds
16 22 (0.83%) Robotics
Operating Systems
1 228 (8.61%) Windows
2 143 (5.40%) Linux
3 37 (1.40%) Android
4 33 (1.25%) Apple iOS
5 20 (0.76%) Unix
6 19 (0.72%) Windows Server
7 8 (0.30%) Mac OS
8 6 (0.23%) Windows 10
9 5 (0.19%) Red Hat Enterprise Linux
10 2 (0.076%) VMS
11 1 (0.038%) FreeRTOS
11 1 (0.038%) Ubuntu
11 1 (0.038%) VxWorks
11 1 (0.038%) Windows Server 2016
11 1 (0.038%) Windows Server 2019
Processes & Methodologies
1 1,006 (37.98%) Agile
2 817 (30.84%) Software Engineering
3 690 (26.05%) DevOps
4 642 (24.24%) Problem-Solving
5 529 (19.97%) CI/CD
6 396 (14.95%) Microservices
7 392 (14.80%) Full-Stack Development
8 342 (12.91%) Computer Science
9 341 (12.87%) Mentoring
10 339 (12.80%) MVC
11 270 (10.19%) OO
12 244 (9.21%) Code Quality
13 242 (9.14%) SDLC
14 241 (9.10%) Artificial Intelligence
15 229 (8.64%) Test Automation
16 215 (8.12%) TDD
17 209 (7.89%) Design Patterns
18 189 (7.13%) Continuous Improvement
19 184 (6.95%) Scrum
20 180 (6.80%) Unit Testing
Programming Languages
1 1,111 (41.94%) SQL
2 918 (34.65%) JavaScript
3 546 (20.61%) Python
4 469 (17.70%) Java
5 336 (12.68%) C++
6 335 (12.65%) TypeScript
7 126 (4.76%) C
8 109 (4.11%) PowerShell
9 100 (3.78%) T-SQL
10 83 (3.13%) VB.NET
11 67 (2.53%) PHP
12 60 (2.27%) Ada
13 52 (1.96%) Rust
14 46 (1.74%) PL/SQL
15 42 (1.59%) VB
16 33 (1.25%) Bash
17 26 (0.98%) X++
18 24 (0.91%) Go
18 24 (0.91%) Kotlin
19 23 (0.87%) Ruby
Qualifications
1 709 (26.76%) Degree
2 194 (7.32%) Computer Science Degree
3 115 (4.34%) Security Cleared
4 108 (4.08%) BPSS Clearance
5 94 (3.55%) Master's Degree
6 59 (2.23%) SC Cleared
7 55 (2.08%) Microsoft Certification
8 43 (1.62%) Azure Certification
9 40 (1.51%) PhD
10 17 (0.64%) Numerate Degree
11 12 (0.45%) AWS Certification
12 11 (0.42%) AWS Certified Solutions Architect
13 8 (0.30%) ISTQB
13 8 (0.30%) TOGAF Certification
14 6 (0.23%) DV Cleared
14 6 (0.23%) ISTQB Foundation Certification
15 5 (0.19%) CompTIA Security+
15 5 (0.19%) HND
15 5 (0.19%) ITIL Certification
16 4 (0.15%) MCSE
Quality Assurance & Compliance
1 212 (8.00%) QA
2 71 (2.68%) GDPR
3 55 (2.08%) Accessibility
4 32 (1.21%) WCAG
5 26 (0.98%) Data Quality
5 26 (0.98%) ISO/IEC 27001
6 11 (0.42%) COBIT
7 10 (0.38%) NIST
8 8 (0.30%) PCI DSS
8 8 (0.30%) SLA
9 6 (0.23%) CDISC
9 6 (0.23%) HIPAA
10 5 (0.19%) SOC 2
11 4 (0.15%) ISO 13485
11 4 (0.15%) ISO 9001
12 3 (0.11%) Software Quality Assurance
13 2 (0.076%) Actionable Recommendations
13 2 (0.076%) HL7
13 2 (0.076%) MiFID
13 2 (0.076%) MISRA
System Software
1 268 (10.12%) Docker
2 31 (1.17%) Firmware
3 13 (0.49%) Active Directory
4 7 (0.26%) VMware Infrastructure
5 4 (0.15%) Embedded Firmware
5 4 (0.15%) Virtual Machines
6 3 (0.11%) LXC
7 2 (0.076%) vSphere
8 1 (0.038%) HDFS
8 1 (0.038%) Hyper-V
8 1 (0.038%) Squid
8 1 (0.038%) Virtual Desktop
8 1 (0.038%) Xen
Systems Management
1 246 (9.29%) Kubernetes
2 104 (3.93%) Terraform
3 52 (1.96%) Ansible
4 32 (1.21%) Grafana
5 28 (1.06%) Prometheus
6 6 (0.23%) Microsoft Intune
7 5 (0.19%) Kibana
8 4 (0.15%) Control-M
9 3 (0.11%) Docker Swarm
9 3 (0.11%) Functional Safety
9 3 (0.11%) Graylog
9 3 (0.11%) Puppet
10 2 (0.076%) MIIS
10 2 (0.076%) Nmap
10 2 (0.076%) Progress Chef
11 1 (0.038%) Consul
11 1 (0.038%) HAProxy
11 1 (0.038%) logstash
11 1 (0.038%) Salt
11 1 (0.038%) vRealize
Vendors
1 643 (24.27%) Microsoft
2 123 (4.64%) PayPal
3 94 (3.55%) Oracle
4 68 (2.57%) Google
5 63 (2.38%) Databricks
6 49 (1.85%) Atlassian
7 36 (1.36%) ServiceNow
8 28 (1.06%) Xamarin
9 24 (0.91%) IBM
10 22 (0.83%) HP
11 21 (0.79%) Salesforce
12 18 (0.68%) Sage
13 17 (0.64%) MuleSoft
14 15 (0.57%) Informatica
15 12 (0.45%) Epicor
15 12 (0.45%) SAP
16 11 (0.42%) EMC
16 11 (0.42%) OpenLink
17 10 (0.38%) Telerik
18 9 (0.34%) Intapp