Public Cloud Jobs

Public Cloud
UK

The table below looks at the prevalence of the term Public Cloud in permanent job vacancies. Included is a benchmarking guide to the salaries offered in vacancies that cited Public Cloud over the 6 months leading up to 30 May 2025, comparing them to the same period in the previous two years.

6 months to
30 May 2025
Same period 2024 Same period 2023
Rank 399 225 99
Rank change year-on-year -174 -126 +128
Permanent jobs citing Public Cloud 339 1,336 3,238
As % of all permanent jobs advertised in the UK 0.61% 1.29% 3.33%
As % of the Miscellaneous category 1.65% 3.75% 7.65%
Number of salaries quoted 185 762 1,166
10th Percentile £48,500 £46,250 £43,750
25th Percentile £66,250 £55,000 £56,219
Median annual salary (50th Percentile) £77,500 £65,000 £72,500
Median % change year-on-year +19.23% -10.34% -
75th Percentile £97,528 £83,759 £97,290
90th Percentile £125,000 £98,474 £117,236
UK excluding London median annual salary £75,000 £62,783 £65,351
% change year-on-year +19.46% -3.93% +8.92%

All Generic Skills
UK

Public Cloud falls under the General and Transferable Skills category. For comparison with the information above, the following table provides summary statistics for all permanent job vacancies requiring generic IT skills.

Permanent vacancies with a requirement for generic IT skills 20,604 35,638 42,318
As % of all permanent jobs advertised in the UK 37.19% 34.51% 43.55%
Number of salaries quoted 9,493 23,121 22,633
10th Percentile £31,250 £28,000 £35,750
25th Percentile £42,000 £38,084 £46,350
Median annual salary (50th Percentile) £60,000 £55,000 £65,000
Median % change year-on-year +9.09% -15.38% +4.00%
75th Percentile £78,750 £75,000 £86,250
90th Percentile £110,000 £97,500 £110,000
UK excluding London median annual salary £55,000 £50,000 £55,000
% change year-on-year +10.00% -9.09% +4.76%

Public Cloud
Job Vacancy Trend

Job postings citing Public Cloud as a proportion of all IT jobs advertised.
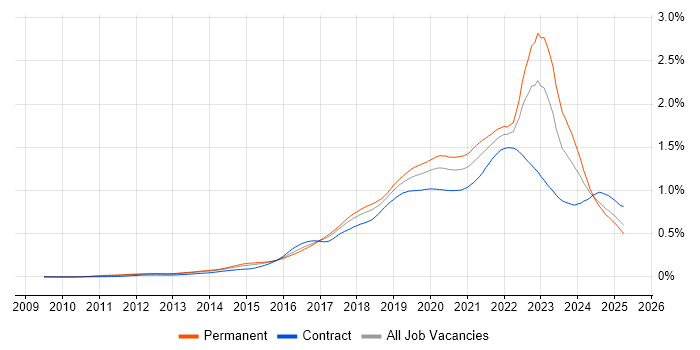
Job vacancy trend for Public Cloud in the UK

Public Cloud
Salary Trend

3-month moving average salary quoted in jobs citing Public Cloud.

Salary trend for Public Cloud in the UK

Public Cloud
Salary Histogram

Salary distribution for jobs citing Public Cloud over the 6 months to 30 May 2025.

Salary histogram for Public Cloud in the UK

Public Cloud
Top 16 Job Locations

The table below looks at the demand and provides a guide to the median salaries quoted in IT jobs citing Public Cloud within the UK over the 6 months to 30 May 2025. The 'Rank Change' column provides an indication of the change in demand within each location based on the same 6 month period last year.

Location Rank Change
on Same Period
Last Year
Matching
Permanent
IT Job Ads
Median Salary
Past 6 Months
Median Salary
% Change
on Same Period
Last Year
Live
Jobs
England -148 283 £77,500 +19.11% 876
UK excluding London -204 176 £75,000 +19.46% 868
London -1 119 £86,250 +11.29% 132
Work from Home -175 105 £76,500 +21.85% 490
North of England -156 55 £74,870 +19.25% 190
Scotland -60 37 £85,253 +36.40% 43
North West -125 33 £78,250 +24.64% 92
South West +47 31 £99,069 +40.95% 96
South East +50 26 £60,000 -7.69% 247
Yorkshire -41 21 £68,000 +8.31% 72
Midlands +2 12 £72,500 +18.45% 172
East of England +39 11 £62,500 +8.09% 112
West Midlands +5 10 £73,750 +16.83% 92
Northern Ireland +34 4 - - 12
East Midlands +15 2 £68,525 +14.21% 68
North East +13 1 £45,000 -28.32% 27

Public Cloud
Co-occurring Skills and Capabilities by Category

The follow tables expand on the table above by listing co-occurrences grouped by category. The same employment type, locality and period is covered with up to 20 co-occurrences shown in each of the following categories:

Application Platforms
1 11 (3.24%) Microsoft Exchange
2 7 (2.06%) nginx
3 6 (1.77%) Apache
4 5 (1.47%) Confluence
4 5 (1.47%) IIS
5 4 (1.18%) Apache Spark
5 4 (1.18%) SharePoint
6 2 (0.59%) Apache Airflow
6 2 (0.59%) OpenStack
6 2 (0.59%) Traefik
Applications
1 8 (2.36%) MS Visio
2 7 (2.06%) Microsoft Excel
3 6 (1.77%) Microsoft Office
4 1 (0.29%) AutoCAD
4 1 (0.29%) Microsoft PowerPoint
4 1 (0.29%) Microsoft Project
Business Applications
1 8 (2.36%) SAP S/4HANA
2 2 (0.59%) Cloudability
2 2 (0.59%) SAP FI
2 2 (0.59%) SimCorp Dimension
3 1 (0.29%) SAP CO
3 1 (0.29%) SAP PS
Cloud Services
1 184 (54.28%) Azure
2 180 (53.10%) AWS
3 154 (45.43%) GCP
4 39 (11.50%) PaaS
5 33 (9.73%) SaaS
6 27 (7.96%) Microsoft 365
7 26 (7.67%) IaaS
8 17 (5.01%) Serverless
9 15 (4.42%) Pulumi
10 13 (3.83%) AWS Lambda
10 13 (3.83%) OpenShift
11 12 (3.54%) GitHub
12 11 (3.24%) Azure DevOps
12 11 (3.24%) Entra ID
13 10 (2.95%) Azure Machine Learning
14 9 (2.65%) Amazon S3
15 8 (2.36%) GitHub Actions
16 7 (2.06%) Amazon EKS
16 7 (2.06%) AWS CloudFormation
17 6 (1.77%) Cloud Computing
Communications & Networking
1 57 (16.81%) Firewall
2 38 (11.21%) WAN
3 37 (10.91%) SD-WAN
4 32 (9.44%) LAN
5 31 (9.14%) Ethernet
6 28 (8.26%) Cisco ISE
7 22 (6.49%) DNS
8 14 (4.13%) TCP/IP
9 12 (3.54%) DHCP
10 11 (3.24%) VPN
11 10 (2.95%) BGP
11 10 (2.95%) Network Security
12 9 (2.65%) OSPF
12 9 (2.65%) Wireless
13 8 (2.36%) IPv4
13 8 (2.36%) MPLS
13 8 (2.36%) NetScaler
13 8 (2.36%) SAN
14 6 (1.77%) Structured Cabling
14 6 (1.77%) VLAN
Database & Business Intelligence
1 21 (6.19%) Big Data
2 18 (5.31%) MongoDB
3 15 (4.42%) SQL Server
4 14 (4.13%) MySQL
5 12 (3.54%) PostgreSQL
6 11 (3.24%) Cloud Spanner
7 10 (2.95%) Amazon RDS
7 10 (2.95%) Relational Database
8 8 (2.36%) Amazon Aurora
9 5 (1.47%) Amazon Athena
9 5 (1.47%) NoSQL
9 5 (1.47%) Tableau
10 4 (1.18%) Amazon Redshift
10 4 (1.18%) KDB
10 4 (1.18%) Kdb+
11 3 (0.88%) Apache Cassandra
11 3 (0.88%) BigQuery
11 3 (0.88%) CockroachDB
11 3 (0.88%) Elasticsearch
11 3 (0.88%) Power BI
Development Applications
1 36 (10.62%) Jenkins
2 28 (8.26%) Git
3 24 (7.08%) JIRA
4 11 (3.24%) CircleCI
5 10 (2.95%) GitLab
5 10 (2.95%) webpack
6 8 (2.36%) Cypress.io
7 6 (1.77%) Cucumber
7 6 (1.77%) Sonatype Nexus
7 6 (1.77%) Visual Studio
8 2 (0.59%) Atlassian Bamboo
8 2 (0.59%) Selenium
8 2 (0.59%) Spinnaker
8 2 (0.59%) YouTrack
9 1 (0.29%) IBM UrbanCode
9 1 (0.29%) JUnit
9 1 (0.29%) Mockito
9 1 (0.29%) Robot Framework
9 1 (0.29%) Vagrant
9 1 (0.29%) Visual Studio Code
General
1 126 (37.17%) Finance
2 97 (28.61%) Banking
3 84 (24.78%) Social Skills
4 61 (17.99%) Law
5 45 (13.27%) Inclusion and Diversity
6 38 (11.21%) Analytical Skills
7 21 (6.19%) Telecoms
8 13 (3.83%) Marketing
9 12 (3.54%) Public Sector
10 11 (3.24%) Retail
11 7 (2.06%) Organisational Skills
12 6 (1.77%) Games
12 6 (1.77%) Legal
13 4 (1.18%) Influencing Skills
14 3 (0.88%) Automotive
14 3 (0.88%) Back Office
14 3 (0.88%) Billing
14 3 (0.88%) iGaming
14 3 (0.88%) Presentation Skills
14 3 (0.88%) Publishing
Job Titles
1 81 (23.89%) Software Engineer
2 74 (21.83%) Senior
3 60 (17.70%) Architect
4 50 (14.75%) Lead
5 39 (11.50%) Cloud Engineer
6 35 (10.32%) Network Architect
7 22 (6.49%) Java Engineer
7 22 (6.49%) Senior Software Engineer
8 20 (5.90%) Lead Software Engineer
9 19 (5.60%) Senior Cloud Engineer
10 17 (5.01%) Platform Engineer
11 16 (4.72%) DevOps Engineer
11 16 (4.72%) Java Software Engineer
12 15 (4.42%) Infrastructure Engineer
12 15 (4.42%) Security Architect
13 14 (4.13%) Security Engineer
14 12 (3.54%) Auditor
14 12 (3.54%) Consultant
14 12 (3.54%) Security Auditor
14 12 (3.54%) Senior Auditor
Libraries, Frameworks & Software Standards
1 33 (9.73%) Spring Boot
2 31 (9.14%) React
3 30 (8.85%) Node.js
4 29 (8.55%) JSON
4 29 (8.55%) Kafka
5 28 (8.26%) RESTful
6 20 (5.90%) REST
7 17 (5.01%) Spring
8 15 (4.42%) .NET
8 15 (4.42%) gRPC
9 14 (4.13%) Middleware
10 12 (3.54%) AngularJS
11 10 (2.95%) Jest
12 7 (2.06%) .NET Core
12 7 (2.06%) OAuth
12 7 (2.06%) OpenID
13 6 (1.77%) ASP.NET
13 6 (1.77%) ASP.NET MVC
13 6 (1.77%) Web Services
14 4 (1.18%) CSS
Miscellaneous
1 59 (17.40%) Cloud Native
2 55 (16.22%) Data Centre
3 34 (10.03%) Distributed Systems
4 31 (9.14%) Data Structures
5 30 (8.85%) Algorithms
5 30 (8.85%) Private Cloud
6 29 (8.55%) Hybrid Cloud
7 28 (8.26%) Product Ownership
8 23 (6.78%) Management Information System
9 12 (3.54%) Reference Data
9 12 (3.54%) Replication
10 9 (2.65%) Security Posture
11 8 (2.36%) Greenfield Project
11 8 (2.36%) Legacy Systems
12 7 (2.06%) Enterprise Software
12 7 (2.06%) Tandem
13 6 (1.77%) Distributed Applications
14 5 (1.47%) Driving Licence
15 4 (1.18%) Hackathon
15 4 (1.18%) Mobile Banking
Operating Systems
1 64 (18.88%) Linux
2 51 (15.04%) Windows
3 12 (3.54%) Windows Server
4 8 (2.36%) Red Hat Enterprise Linux
4 8 (2.36%) Unix
5 5 (1.47%) Windows 10
6 4 (1.18%) Android
6 4 (1.18%) Debian
6 4 (1.18%) Ubuntu
7 3 (0.88%) Windows Server 2012
7 3 (0.88%) Windows Server 2016
7 3 (0.88%) Windows Server 2019
8 1 (0.29%) Mac OS
8 1 (0.29%) SUSE
8 1 (0.29%) VMS
Processes & Methodologies
1 138 (40.71%) CI/CD
2 106 (31.27%) Agile
3 100 (29.50%) DevOps
4 98 (28.91%) Infrastructure as Code
5 90 (26.55%) Software Engineering
6 67 (19.76%) Microservices
7 61 (17.99%) Test Automation
8 54 (15.93%) Roadmaps
9 48 (14.16%) Problem-Solving
10 46 (13.57%) Mentoring
11 45 (13.27%) SDLC
12 44 (12.98%) Cloud Security
13 42 (12.39%) High Availability
14 41 (12.09%) Analytics
14 41 (12.09%) Coaching
14 41 (12.09%) Continuous Integration
14 41 (12.09%) Stakeholder Management
15 36 (10.62%) Risk Management
16 35 (10.32%) Deployment Automation
17 32 (9.44%) Platform Engineering
Programming Languages
1 122 (35.99%) Python
2 80 (23.60%) Java
3 45 (13.27%) SQL
4 34 (10.03%) JavaScript
5 27 (7.96%) PowerShell
6 24 (7.08%) C#
6 24 (7.08%) TypeScript
7 23 (6.78%) Go
8 15 (4.42%) Bash
9 14 (4.13%) Bicep
10 12 (3.54%) Ruby
11 8 (2.36%) C++
12 7 (2.06%) Rust
13 5 (1.47%) C
13 5 (1.47%) Scala
13 5 (1.47%) Shell Script
14 4 (1.18%) Clojure
14 4 (1.18%) Elixir
14 4 (1.18%) R
15 3 (0.88%) Kotlin
Qualifications
1 45 (13.27%) Degree
2 37 (10.91%) Security Cleared
3 34 (10.03%) SC Cleared
4 21 (6.19%) AWS Certification
5 14 (4.13%) Cisco Certification
6 12 (3.54%) Azure Certification
7 9 (2.65%) CCNA
8 7 (2.06%) CCNP
9 6 (1.77%) Numerate Degree
10 5 (1.47%) Master's Degree
10 5 (1.47%) Microsoft Certification
11 4 (1.18%) CISSP
11 4 (1.18%) DBS Check
11 4 (1.18%) Network+ Certification
12 3 (0.88%) Computer Science Degree
13 2 (0.59%) (ISC)2 CCSP
13 2 (0.59%) AWS Certified Solutions Architect
13 2 (0.59%) CEH
13 2 (0.59%) CISM
13 2 (0.59%) CRISC
Quality Assurance & Compliance
1 6 (1.77%) Accessibility
2 5 (1.47%) ISO/IEC 27001
3 4 (1.18%) Cyber Essentials
4 3 (0.88%) Data Quality
4 3 (0.88%) GDPR
4 3 (0.88%) NIST
4 3 (0.88%) PCI DSS
4 3 (0.88%) QA
4 3 (0.88%) SLA
5 2 (0.59%) Cyber Essentials PLUS
5 2 (0.59%) NCSC
6 1 (0.29%) ISO/IEC 27005
6 1 (0.29%) NIST 800
6 1 (0.29%) Sarbanes-Oxley
System Software
1 61 (17.99%) Docker
2 29 (8.55%) VMware NSX
3 25 (7.37%) Active Directory
4 14 (4.13%) Hyper-V
5 13 (3.83%) VMware Infrastructure
6 11 (3.24%) Virtual Machines
7 7 (2.06%) Virtual Desktop
8 5 (1.47%) VMware ESXi
9 2 (0.59%) HDFS
9 2 (0.59%) KVM
9 2 (0.59%) vSphere
9 2 (0.59%) Xen
10 1 (0.29%) BitLocker
Systems Management
1 143 (42.18%) Kubernetes
2 126 (37.17%) Terraform
3 79 (23.30%) Ansible
4 36 (10.62%) FortiGate
5 28 (8.26%) Puppet
6 20 (5.90%) Microsoft Intune
6 20 (5.90%) Progress Chef
7 14 (4.13%) Podman
8 10 (2.95%) Grafana
9 9 (2.65%) SCCM
9 9 (2.65%) WSUS
10 8 (2.36%) Prometheus
11 7 (2.06%) Argo
11 7 (2.06%) Istio
12 6 (1.77%) Single Sign-On
13 4 (1.18%) Active Directory Federation Services
13 4 (1.18%) Consul
14 3 (0.88%) Kustomize
14 3 (0.88%) NetBackup
14 3 (0.88%) Salt
Vendors
1 70 (20.65%) Google
2 54 (15.93%) Microsoft
3 50 (14.75%) VMware
4 42 (12.39%) Cisco
5 34 (10.03%) F5
6 32 (9.44%) CheckPoint
7 28 (8.26%) Blue Coat
8 16 (4.72%) Oracle
9 14 (4.13%) Citrix
10 13 (3.83%) SAP
11 8 (2.36%) Red Hat
12 6 (1.77%) Dell
13 5 (1.47%) Draytek
13 5 (1.47%) Ubiquiti
13 5 (1.47%) Veeam
14 4 (1.18%) Adobe
14 4 (1.18%) Dynatrace
14 4 (1.18%) Fortinet
14 4 (1.18%) Palo Alto
14 4 (1.18%) SolarWinds