Serverless Jobs

Serverless Computing
UK

The table below provides summary statistics for permanent job vacancies requiring Serverless skills. It includes a benchmarking guide to the annual salaries offered in vacancies that cited Serverless over the 6 months leading up to 14 August 2025, comparing them to the same period in the previous two years.

6 months to
14 Aug 2025
Same period 2024 Same period 2023
Rank 179 207 110
Rank change year-on-year +28 -97 -34
Permanent jobs citing Serverless 1,091 1,121 2,262
As % of all permanent jobs advertised in the UK 1.78% 1.30% 3.03%
As % of the Cloud Services category 6.57% 4.04% 7.28%
Number of salaries quoted 515 687 1,156
10th Percentile £46,250 £42,500 £49,125
25th Percentile £56,250 £55,000 £60,000
Median annual salary (50th Percentile) £70,500 £70,000 £70,000
Median % change year-on-year +0.71% - -6.67%
75th Percentile £87,500 £91,250 £86,375
90th Percentile £100,000 £107,500 £101,875
UK excluding London median annual salary £65,000 £60,000 £67,500
% change year-on-year +8.33% -11.11% +3.85%

All Cloud Skills
UK

Serverless falls under the Cloud Services category. For comparison with the information above, the following table provides summary statistics for all permanent job vacancies requiring cloud computing skills.

Permanent vacancies with a requirement for cloud computing skills 16,600 27,767 31,075
As % of all permanent jobs advertised in the UK 27.03% 32.17% 41.63%
Number of salaries quoted 11,028 19,021 23,869
10th Percentile £30,000 £32,000 £33,750
25th Percentile £40,000 £42,532 £46,250
Median annual salary (50th Percentile) £60,000 £60,000 £63,500
Median % change year-on-year - -5.51% +1.60%
75th Percentile £80,000 £80,000 £82,548
90th Percentile £100,000 £100,000 £102,500
UK excluding London median annual salary £50,000 £54,000 £55,000
% change year-on-year -7.41% -1.82% +0.92%

Serverless
Job Vacancy Trend

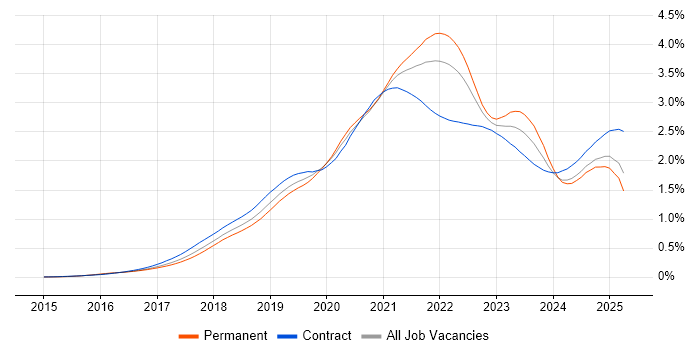
Job postings citing Serverless as a proportion of all IT jobs advertised.

Job vacancy trend for Serverless in the UK

Serverless
Salary Trend

3-month moving average salary quoted in jobs citing Serverless.

Salary trend for Serverless in the UK

Serverless
Salary Histogram

Salary distribution for jobs citing Serverless over the 6 months to 14 August 2025.

Salary histogram for Serverless in the UK

Serverless
Top 16 Job Locations

The table below looks at the demand and provides a guide to the median salaries quoted in IT jobs citing Serverless within the UK over the 6 months to 14 August 2025. The 'Rank Change' column provides an indication of the change in demand within each location based on the same 6 month period last year.

Location Rank Change
on Same Period
Last Year
Matching
Permanent
IT Job Ads
Median Salary
Past 6 Months
Median Salary
% Change
on Same Period
Last Year
Live
Jobs
England +46 1,034 £72,500 - 699
Work from Home +71 618 £64,000 -8.57% 388
London +87 489 £75,000 -14.29% 433
UK excluding London -13 450 £65,000 +8.33% 333
South East -24 110 £70,000 +7.69% 88
North of England -61 102 £65,000 +8.33% 113
East of England +30 86 £58,750 -2.08% 18
South West +66 63 £60,000 -14.29% 39
North West -82 62 £67,500 +8.00% 83
Midlands +11 59 £65,000 +8.33% 33
West Midlands +38 54 £65,000 -1.89% 24
Yorkshire -2 36 £60,000 - 23
Scotland +43 21 £60,000 +4.35% 23
Wales +9 14 £52,000 +89.09% 16
East Midlands -15 5 £37,500 -28.57% 9
North East +14 4 £72,500 +20.83% 7

Serverless
Co-occurring Skills and Capabilities by Category

The follow tables expand on the table above by listing co-occurrences grouped by category. The same employment type, locality and period is covered with up to 20 co-occurrences shown in each of the following categories:

Application Platforms
1 32 (2.93%) Confluence
2 31 (2.84%) SharePoint
3 30 (2.75%) Apache Spark
4 29 (2.66%) Apache
5 19 (1.74%) Headless CMS
6 16 (1.47%) CMS
7 12 (1.10%) Apache Airflow
8 9 (0.82%) JBoss
9 8 (0.73%) Red Hat Fuse
10 4 (0.37%) OpenStack
10 4 (0.37%) Tomcat
10 4 (0.37%) Umbraco
11 3 (0.27%) WebSphere
12 2 (0.18%) Mule
12 2 (0.18%) Oracle Coherence
12 2 (0.18%) Oracle SOA Suite
12 2 (0.18%) WebSphere Application Server
13 1 (0.092%) Microsoft Exchange
13 1 (0.092%) Strapi
Applications
1 4 (0.37%) Microsoft Office
1 4 (0.37%) Mozilla Thunderbird
2 2 (0.18%) MS Visio
3 1 (0.092%) Chatbot
Business Applications
1 9 (0.82%) Shopify
2 8 (0.73%) Dynamics CRM
3 6 (0.55%) Payment Gateway
3 6 (0.55%) SimCorp Dimension
4 2 (0.18%) Elite 3E
5 1 (0.092%) Raiser’s Edge
Cloud Services
1 907 (83.13%) AWS
2 752 (68.93%) AWS Lambda
3 517 (47.39%) Azure
4 285 (26.12%) GCP
5 270 (24.75%) Amazon S3
6 150 (13.75%) Amazon EC2
7 127 (11.64%) Amazon ECS
8 125 (11.46%) AWS Step Functions
9 124 (11.37%) Azure Functions
10 88 (8.07%) Amazon EKS
11 84 (7.70%) GitHub
12 82 (7.52%) SaaS
13 76 (6.97%) AWS CloudFormation
14 72 (6.60%) Azure Logic Apps
15 65 (5.96%) Amazon CloudWatch
16 63 (5.77%) Power Platform
17 62 (5.68%) Amazon SQS
18 57 (5.22%) Azure DevOps
19 51 (4.67%) Azure Service Bus
20 48 (4.40%) PaaS
Communications & Networking
1 372 (34.10%) Broadband
2 89 (8.16%) SSL
3 82 (7.52%) SSH
4 22 (2.02%) Firewall
5 14 (1.28%) Network Security
6 13 (1.19%) Internet
7 12 (1.10%) Wireless
8 11 (1.01%) DNS
8 11 (1.01%) VPN
9 9 (0.82%) HTTP
10 8 (0.73%) TCP/IP
11 7 (0.64%) VLAN
12 5 (0.46%) DHCP
12 5 (0.46%) SD-WAN
12 5 (0.46%) Unified Communications
12 5 (0.46%) Wi-Fi
13 4 (0.37%) IPv4
14 3 (0.27%) AMQP
15 2 (0.18%) LAN
15 2 (0.18%) OSPF
Database & Business Intelligence
1 197 (18.06%) DynamoDB
2 109 (9.99%) Elasticsearch
3 97 (8.89%) Amazon RDS
4 87 (7.97%) PostgreSQL
5 69 (6.32%) NoSQL
6 61 (5.59%) SQL Server
7 55 (5.04%) Relational Database
8 45 (4.12%) Amazon Redshift
9 40 (3.67%) Data Warehouse
10 38 (3.48%) MongoDB
11 36 (3.30%) Amazon Athena
11 36 (3.30%) Big Data
12 34 (3.12%) MySQL
13 33 (3.02%) RDBMS
14 28 (2.57%) Data Lake
15 26 (2.38%) Power BI
16 22 (2.02%) Amazon Aurora
17 14 (1.28%) Azure SQL Database
18 11 (1.01%) Redis
19 10 (0.92%) Electronic Patient Records
Development Applications
1 119 (10.91%) Jenkins
2 101 (9.26%) Git
3 54 (4.95%) JIRA
4 41 (3.76%) JUnit
5 38 (3.48%) GitLab
6 30 (2.75%) Mockito
7 27 (2.47%) JMeter
8 12 (1.10%) Artifactory
8 12 (1.10%) Cypress.io
9 11 (1.01%) Maven
9 11 (1.01%) Selenium
10 10 (0.92%) CircleCI
11 9 (0.82%) Bitbucket
11 9 (0.82%) Cucumber
12 8 (0.73%) Locust
12 8 (0.73%) PowerBuilder
13 7 (0.64%) IntelliJ
13 7 (0.64%) Octopus Deploy
14 5 (0.46%) git-flow
14 5 (0.46%) Storybook
General
1 271 (24.84%) Analytical Skills
1 271 (24.84%) Social Skills
2 163 (14.94%) Finance
3 80 (7.33%) Public Sector
4 68 (6.23%) Law
5 44 (4.03%) Marketing
6 40 (3.67%) Inclusion and Diversity
7 39 (3.57%) Banking
8 35 (3.21%) Tech for Good
9 30 (2.75%) Publishing
10 29 (2.66%) Retail
11 28 (2.57%) Health Technology
12 21 (1.92%) Telecoms
13 14 (1.28%) Presentation Skills
14 13 (1.19%) Automotive
14 13 (1.19%) Investment Banking
15 12 (1.10%) Front Office
15 12 (1.10%) Games
15 12 (1.10%) Manufacturing
16 10 (0.92%) Advertising
Job Titles
1 496 (45.46%) Senior
2 344 (31.53%) Developer
3 218 (19.98%) Machine Learning Engineer
4 196 (17.97%) Senior Developer
5 111 (10.17%) DevOps Engineer
5 111 (10.17%) Lead
6 108 (9.90%) Cloud Engineer
7 106 (9.72%) AWS Developer
8 77 (7.06%) Software Engineer
9 71 (6.51%) Java Developer
10 68 (6.23%) Data Engineer
11 59 (5.41%) AWS Engineer
12 57 (5.22%) Full-Stack Developer
13 52 (4.77%) Architect
14 43 (3.94%) Python Developer
15 34 (3.12%) Software Developer
16 29 (2.66%) Senior Java Developer
16 29 (2.66%) Senior Python Developer
17 28 (2.57%) Lead Developer
18 26 (2.38%) Python Engineer
Libraries, Frameworks & Software Standards
1 249 (22.82%) React
2 192 (17.60%) RESTful
3 138 (12.65%) GraphQL
4 133 (12.19%) Web Services
5 127 (11.64%) REST
6 112 (10.27%) .NET
7 97 (8.89%) HTML
8 89 (8.16%) Node.js
9 79 (7.24%) Spring Boot
10 78 (7.15%) Serverless Framework
11 76 (6.97%) Spring
12 71 (6.51%) CSS
13 69 (6.32%) Kafka
14 64 (5.87%) AngularJS
15 40 (3.67%) Vue
16 38 (3.48%) JSON
17 37 (3.39%) .NET Core
18 32 (2.93%) Apache Camel
19 30 (2.75%) ActiveMQ
19 30 (2.75%) jQuery
Miscellaneous
1 223 (20.44%) Self-Motivation
2 109 (9.99%) Management Information System
3 103 (9.44%) Cloud Native
4 84 (7.70%) Onboarding
5 83 (7.61%) PKI
6 82 (7.52%) Cyber Threat
6 82 (7.52%) Cyberattack
7 48 (4.40%) Distributed Systems
8 37 (3.39%) Product Ownership
9 27 (2.47%) Mobile App
10 21 (1.92%) Public Cloud
11 17 (1.56%) Legacy Systems
12 16 (1.47%) Hybrid Cloud
12 16 (1.47%) IoT
13 11 (1.01%) Greenfield Project
14 10 (0.92%) Virtual Team
15 9 (0.82%) e-Learning
15 9 (0.82%) Reinsurance
16 7 (0.64%) Blockchain
16 7 (0.64%) Data Centre
Operating Systems
1 49 (4.49%) Linux
2 20 (1.83%) Windows
3 6 (0.55%) VMS
4 5 (0.46%) Ubuntu
4 5 (0.46%) Unix
4 5 (0.46%) Windows Server
5 4 (0.37%) Red Hat Enterprise Linux
Processes & Methodologies
1 628 (57.56%) CI/CD
2 613 (56.19%) Agile
3 422 (38.68%) Mentoring
4 404 (37.03%) DevOps
5 395 (36.21%) Problem-Solving
6 330 (30.25%) Clean Code
7 304 (27.86%) Data Science
8 282 (25.85%) Machine Learning
9 226 (20.71%) Creative Thinking
10 224 (20.53%) Performance Metrics
11 215 (19.71%) Personalization
12 193 (17.69%) Microservices
13 166 (15.22%) Software Engineering
14 157 (14.39%) Artificial Intelligence
15 149 (13.66%) Infrastructure as Code
16 147 (13.47%) Event-Driven
17 132 (12.10%) Event-Driven Architecture
18 129 (11.82%) Containerisation
19 124 (11.37%) TDD
20 118 (10.82%) Continuous Integration
Programming Languages
1 696 (63.79%) Python
2 458 (41.98%) TypeScript
3 267 (24.47%) JavaScript
4 194 (17.78%) Java
4 194 (17.78%) SQL
5 117 (10.72%) C#
6 61 (5.59%) PowerShell
7 41 (3.76%) Bash
8 33 (3.02%) Shell Script
9 32 (2.93%) Go
10 24 (2.20%) Bicep
11 19 (1.74%) Scala
12 17 (1.56%) PHP
13 13 (1.19%) Kusto Query Language
14 6 (0.55%) C++
14 6 (0.55%) Groovy
14 6 (0.55%) Perl
14 6 (0.55%) R
14 6 (0.55%) Rust
14 6 (0.55%) T-SQL
Qualifications
1 305 (27.96%) Degree
2 218 (19.98%) PhD
3 133 (12.19%) AWS Certification
4 112 (10.27%) Security Cleared
5 55 (5.04%) SC Cleared
6 51 (4.67%) Computer Science Degree
7 31 (2.84%) Azure Certification
8 30 (2.75%) AWS Certified Solutions Architect
9 18 (1.65%) Microsoft Certification
10 17 (1.56%) Master's Degree
11 16 (1.47%) DV Cleared
12 12 (1.10%) DBS Check
13 10 (0.92%) TOGAF Certification
14 7 (0.64%) AWS Certified Developer
15 6 (0.55%) AWS Certified DevOps Engineer
15 6 (0.55%) SnowPro
16 3 (0.27%) Cisco Certification
16 3 (0.27%) ISTQB
17 2 (0.18%) (ISC)2 CCSP
17 2 (0.18%) ITIL Certification
Quality Assurance & Compliance
1 99 (9.07%) ISO/IEC 27001
2 96 (8.80%) NIST
3 72 (6.60%) QA
4 32 (2.93%) GDPR
5 19 (1.74%) SLA
6 18 (1.65%) PCI DSS
7 17 (1.56%) Accessibility
8 15 (1.37%) Data Quality
9 14 (1.28%) HIPAA
9 14 (1.28%) Sarbanes-Oxley
10 7 (0.64%) SOC 2
11 6 (0.55%) Cyber Essentials
12 3 (0.27%) WCAG
13 1 (0.092%) CDISC
13 1 (0.092%) DICOM
13 1 (0.092%) HL7
13 1 (0.092%) NCSC
13 1 (0.092%) SNOMED CT
System Software
1 198 (18.15%) Docker
2 101 (9.26%) Active Directory
3 9 (0.82%) Virtual Machines
4 7 (0.64%) Virtual Desktop
5 5 (0.46%) Hyper-V
6 3 (0.27%) VMware Infrastructure
7 2 (0.18%) Firmware
7 2 (0.18%) Terminal Server
8 1 (0.092%) HDFS
8 1 (0.092%) iptables
8 1 (0.092%) Slurm Workload Manager
Systems Management
1 243 (22.27%) Terraform
2 195 (17.87%) Kubernetes
3 51 (4.67%) Prometheus
4 44 (4.03%) Grafana
5 43 (3.94%) Ansible
6 28 (2.57%) Kibana
7 12 (1.10%) Single Sign-On
8 8 (0.73%) Microsoft Intune
9 6 (0.55%) Progress Chef
10 5 (0.46%) Puppet
11 4 (0.37%) Nagios
11 4 (0.37%) Nessus
11 4 (0.37%) Proxmox
12 3 (0.27%) Argo
12 3 (0.27%) Docker Swarm
12 3 (0.27%) Packer
13 2 (0.18%) logstash
14 1 (0.092%) Red Hat Satellite
14 1 (0.092%) SCCM
14 1 (0.092%) vCenter Server
Vendors
1 121 (11.09%) Microsoft
2 82 (7.52%) Thales
3 48 (4.40%) Splunk
4 34 (3.12%) Databricks
5 33 (3.02%) Oracle
6 31 (2.84%) Google
7 26 (2.38%) Dynatrace
8 21 (1.92%) Atlassian
8 21 (1.92%) ServiceNow
9 16 (1.47%) Salesforce
10 14 (1.28%) Informatica
10 14 (1.28%) MuleSoft
11 13 (1.19%) IBM
12 8 (0.73%) Apple
12 8 (0.73%) SAP
13 6 (0.55%) OpenAI
13 6 (0.55%) SimCorp
14 5 (0.46%) Aruba
14 5 (0.46%) HP
14 5 (0.46%) Veeam