Scrum
UK

The table below provides summary statistics for permanent job vacancies requiring Scrum skills. It includes a benchmarking guide to the annual salaries offered in vacancies that cited Scrum over the 6 months leading up to 31 May 2025, comparing them to the same period in the previous two years.

6 months to
31 May 2025
Same period 2024 Same period 2023
Rank 131 72 40
Rank change year-on-year -59 -32 -13
Permanent jobs citing Scrum 1,309 3,588 6,089
As % of all permanent jobs advertised in the UK 2.34% 3.46% 6.36%
As % of the Processes & Methodologies category 2.50% 4.12% 6.66%
Number of salaries quoted 752 2,476 3,735
10th Percentile £43,875 £40,000 £46,250
25th Percentile £52,500 £47,500 £51,629
Median annual salary (50th Percentile) £65,000 £60,000 £65,000
Median % change year-on-year +8.33% -7.69% +4.00%
75th Percentile £81,563 £75,000 £82,500
90th Percentile £97,500 £90,000 £102,500
UK excluding London median annual salary £60,000 £55,000 £60,000
% change year-on-year +9.09% -8.33% +4.35%

All Process and Methodology Skills
UK

Scrum falls under the Processes and Methodologies category. For comparison with the information above, the following table provides summary statistics for all permanent job vacancies requiring process or methodology skills.

Permanent vacancies with a requirement for process or methodology skills 52,256 87,133 91,481
As % of all permanent jobs advertised in the UK 93.58% 84.04% 95.51%
Number of salaries quoted 25,854 60,896 54,581
10th Percentile £28,822 £29,250 £34,000
25th Percentile £41,250 £40,000 £45,000
Median annual salary (50th Percentile) £57,000 £55,000 £60,899
Median % change year-on-year +3.64% -9.69% +1.50%
75th Percentile £75,000 £72,500 £81,250
90th Percentile £97,500 £92,500 £100,000
UK excluding London median annual salary £51,564 £50,000 £55,000
% change year-on-year +3.13% -9.09% +4.76%

Scrum
Job Vacancy Trend

Job postings citing Scrum as a proportion of all IT jobs advertised.
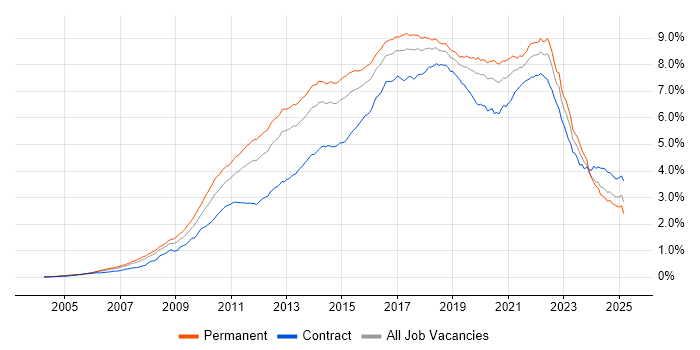
Job vacancy trend for Scrum in the UK

Scrum
Salary Trend

3-month moving average salary quoted in jobs citing Scrum.

Salary trend for Scrum in the UK

Scrum
Salary Histogram

Salary distribution for jobs citing Scrum over the 6 months to 31 May 2025.

Salary histogram for Scrum in the UK

Scrum
Top 17 Job Locations

The table below looks at the demand and provides a guide to the median salaries quoted in IT jobs citing Scrum within the UK over the 6 months to 31 May 2025. The 'Rank Change' column provides an indication of the change in demand within each location based on the same 6 month period last year.

Location Rank Change
on Same Period
Last Year
Matching
Permanent
IT Job Ads
Median Salary
Past 6 Months
Median Salary
% Change
on Same Period
Last Year
Live
Jobs
England -64 1,200 £65,000 +8.33% 1,447
UK excluding London -67 878 £60,000 +9.09% 897
Work from Home -73 554 £64,000 +6.67% 944
London -32 407 £75,000 +7.14% 655
North of England -38 374 £57,500 -4.17% 258
North West -26 306 £60,500 -3.97% 154
South East -72 184 £62,500 +8.70% 204
Midlands -77 93 £60,000 +14.29% 144
South West -57 86 £60,000 +15.38% 119
West Midlands -38 74 £60,000 +14.29% 95
East of England -20 67 £60,000 +9.09% 62
Yorkshire -32 60 £55,000 - 78
Scotland -27 51 £60,000 +26.32% 52
Wales -17 19 £63,750 +3.66% 29
East Midlands -44 19 £65,000 +20.93% 47
North East -8 10 £45,000 -14.29% 27
Northern Ireland +32 7 £32,500 -65.79% 29

Scrum
Co-occurring Skills and Capabilities by Category

The follow tables expand on the table above by listing co-occurrences grouped by category. The same employment type, locality and period is covered with up to 20 co-occurrences shown in each of the following categories:

Application Platforms
1 90 (6.88%) Confluence
2 37 (2.83%) CMS
3 21 (1.60%) Apache Spark
4 14 (1.07%) JBoss
4 14 (1.07%) Red Hat Fuse
5 13 (0.99%) Apache
6 10 (0.76%) Drupal
6 10 (0.76%) WordPress
7 9 (0.69%) OpenStack
8 7 (0.53%) Kentico
9 6 (0.46%) IIS
9 6 (0.46%) SharePoint
10 5 (0.38%) EPiServer
11 4 (0.31%) Apache Airflow
12 3 (0.23%) Cloud Foundry
12 3 (0.23%) nginx
12 3 (0.23%) Oracle SOA Suite
12 3 (0.23%) Umbraco
13 2 (0.15%) NServiceBus
13 2 (0.15%) Sitefinity
Applications
1 29 (2.22%) Microsoft Excel
2 27 (2.06%) Trello
3 26 (1.99%) Microsoft Office
4 23 (1.76%) Microsoft Project
5 15 (1.15%) MS Visio
6 11 (0.84%) Microsoft PowerPoint
7 3 (0.23%) Adobe XD
7 3 (0.23%) Chatbot
7 3 (0.23%) Productboard
8 1 (0.076%) Adobe Illustrator
8 1 (0.076%) CATIA
8 1 (0.076%) Elementor
8 1 (0.076%) Photoshop
8 1 (0.076%) Simulink
8 1 (0.076%) Sketch
Business Applications
1 25 (1.91%) Dynamics CRM
2 10 (0.76%) Payment Gateway
3 9 (0.69%) Oracle EBS
3 9 (0.69%) Salesforce CRM
4 6 (0.46%) Magento
5 3 (0.23%) Siebel CRM
6 2 (0.15%) BASE24
6 2 (0.15%) SAP Hybris
6 2 (0.15%) Shopify
7 1 (0.076%) Endur
7 1 (0.076%) Lorenzo
7 1 (0.076%) Oracle EBS R12
7 1 (0.076%) SAP ERP
7 1 (0.076%) SystmOne
7 1 (0.076%) TrackWise
7 1 (0.076%) Workday HCM
Cloud Services
1 504 (38.50%) Azure
2 443 (33.84%) AWS
3 230 (17.57%) GCP
4 113 (8.63%) Azure DevOps
5 96 (7.33%) Serverless
6 72 (5.50%) Power Platform
7 64 (4.89%) SaaS
8 49 (3.74%) GitHub
9 48 (3.67%) Amazon S3
10 45 (3.44%) AWS Lambda
10 45 (3.44%) Dynamics 365
11 41 (3.13%) Amazon EC2
12 33 (2.52%) Amazon ECS
13 32 (2.44%) Amazon EKS
14 28 (2.14%) Azure Logic Apps
15 24 (1.83%) Amazon CloudWatch
16 23 (1.76%) Azure Data Factory
16 23 (1.76%) Microsoft 365
17 21 (1.60%) Figma
17 21 (1.60%) Power Automate
Communications & Networking
1 14 (1.07%) HTTP
2 7 (0.53%) Firewall
3 6 (0.46%) DHCP
3 6 (0.46%) Kerberos
3 6 (0.46%) TCP/IP
4 5 (0.38%) DNS
5 3 (0.23%) Bluetooth
5 3 (0.23%) Internet
5 3 (0.23%) RTP
5 3 (0.23%) VLAN
6 2 (0.15%) ATM
6 2 (0.15%) Broadband
6 2 (0.15%) Multicast
6 2 (0.15%) Network Security
6 2 (0.15%) SAN
6 2 (0.15%) WAN
6 2 (0.15%) Wireless
7 1 (0.076%) Modbus
7 1 (0.076%) Skype
7 1 (0.076%) ZigBee
Database & Business Intelligence
1 92 (7.03%) PostgreSQL
2 79 (6.04%) Relational Database
3 78 (5.96%) SQL Server
4 55 (4.20%) MongoDB
5 51 (3.90%) Power BI
6 50 (3.82%) Elasticsearch
7 42 (3.21%) MySQL
8 41 (3.13%) NoSQL
9 31 (2.37%) DynamoDB
10 29 (2.22%) Azure SQL Database
11 26 (1.99%) Amazon RDS
12 21 (1.60%) Big Data
13 17 (1.30%) Amazon Aurora
13 17 (1.30%) Data Warehouse
14 13 (0.99%) Data Lake
14 13 (0.99%) Tableau
15 12 (0.92%) Redis
16 10 (0.76%) RDBMS
17 9 (0.69%) SQL Server Integration Services
18 7 (0.53%) SQL Server Reporting Services
Development Applications
1 236 (18.03%) JIRA
2 172 (13.14%) Git
3 93 (7.10%) Jenkins
4 72 (5.50%) JUnit
5 35 (2.67%) GitLab
6 30 (2.29%) Selenium
7 28 (2.14%) JMeter
8 25 (1.91%) Mockito
9 24 (1.83%) Postman
10 22 (1.68%) Maven
11 21 (1.60%) eggPlant
11 21 (1.60%) Visual Studio
12 20 (1.53%) NUnit
13 16 (1.22%) Cypress.io
14 15 (1.15%) SonarQube
15 11 (0.84%) DbUnit
15 11 (0.84%) jMock
16 10 (0.76%) Bitbucket Server
17 9 (0.69%) Gatling
18 8 (0.61%) TeamCity
General
1 434 (33.16%) Social Skills
2 351 (26.81%) Finance
3 250 (19.10%) Inclusion and Diversity
4 150 (11.46%) Analytical Skills
5 90 (6.88%) Law
6 87 (6.65%) Public Sector
7 77 (5.88%) Banking
8 72 (5.50%) Marketing
9 50 (3.82%) Retail
10 38 (2.90%) Publishing
11 30 (2.29%) Manufacturing
12 29 (2.22%) Organisational Skills
13 23 (1.76%) Legal
13 23 (1.76%) Presentation Skills
14 21 (1.60%) Tech for Good
15 19 (1.45%) Electronics
16 18 (1.38%) Financial Institution
16 18 (1.38%) Health Technology
17 17 (1.30%) Back Office
18 16 (1.22%) Automotive
Job Titles
1 404 (30.86%) Senior
2 295 (22.54%) Software Engineer
3 267 (20.40%) Developer
4 219 (16.73%) Senior Software Engineer
5 134 (10.24%) Lead
6 111 (8.48%) Analyst
7 81 (6.19%) Senior Developer
8 62 (4.74%) Java Developer
9 54 (4.13%) Project Manager
10 52 (3.97%) Business Analyst
11 46 (3.51%) .NET Developer
11 46 (3.51%) Architect
12 45 (3.44%) Product Owner
13 38 (2.90%) Product Manager
14 37 (2.83%) Lead Developer
14 37 (2.83%) Senior Analyst
15 36 (2.75%) Development Manager
15 36 (2.75%) Scrum Master
15 36 (2.75%) Software Developer
15 36 (2.75%) Team Leader
Libraries, Frameworks & Software Standards
1 340 (25.97%) .NET
2 252 (19.25%) Node.js
3 183 (13.98%) React
4 121 (9.24%) RESTful
5 101 (7.72%) REST
6 96 (7.33%) HTML
7 94 (7.18%) AngularJS
8 90 (6.88%) Spring Boot
9 89 (6.80%) CSS
9 89 (6.80%) Spring
10 79 (6.04%) Web Services
11 67 (5.12%) .NET Framework
12 56 (4.28%) Kafka
13 55 (4.20%) .NET Core
14 53 (4.05%) SOAP
15 41 (3.13%) ASP.NET
16 38 (2.90%) Vue
17 36 (2.75%) Hibernate
18 27 (2.06%) ASP.NET Web API
18 27 (2.06%) Entity Framework
Miscellaneous
1 221 (16.88%) Product Ownership
2 189 (14.44%) Self-Motivation
3 178 (13.60%) Cyberattack
3 178 (13.60%) Linux Command Line
4 45 (3.44%) Distributed Systems
5 31 (2.37%) Cloud Native
6 30 (2.29%) Mobile App
7 26 (1.99%) Management Information System
8 24 (1.83%) Onboarding
9 23 (1.76%) Virtual Team
10 22 (1.68%) PMI
11 21 (1.60%) Data Structures
12 20 (1.53%) Algorithms
13 19 (1.45%) Social Media
14 17 (1.30%) FMCG
15 16 (1.22%) Enterprise Software
16 13 (0.99%) PKI
17 12 (0.92%) N-Tier
17 12 (0.92%) Private Cloud
18 11 (0.84%) Public Cloud
Operating Systems
1 232 (17.72%) Linux
2 31 (2.37%) Windows
3 18 (1.38%) Android
4 15 (1.15%) Apple iOS
5 11 (0.84%) Windows Server
6 7 (0.53%) Unix
7 3 (0.23%) Red Hat Enterprise Linux
8 2 (0.15%) Ubuntu
9 1 (0.076%) Debian
9 1 (0.076%) Rocky
9 1 (0.076%) Windows 10
9 1 (0.076%) Windows Server 2003
9 1 (0.076%) Windows Server 2019
9 1 (0.076%) zOS
Processes & Methodologies
1 1,206 (92.13%) Agile
2 405 (30.94%) Software Engineering
3 352 (26.89%) Microservices
4 329 (25.13%) Mentoring
5 299 (22.84%) DevOps
6 295 (22.54%) CI/CD
7 288 (22.00%) User Experience
8 275 (21.01%) Problem-Solving
9 257 (19.63%) Kanban
10 234 (17.88%) Continuous Improvement
11 223 (17.04%) Machine Learning
12 211 (16.12%) Data Engineering
13 200 (15.28%) Cloud Security
14 198 (15.13%) Test Automation
15 193 (14.74%) Project Management
16 186 (14.21%) Site Reliability Engineering
17 180 (13.75%) Stakeholder Management
18 155 (11.84%) Roadmaps
19 137 (10.47%) TDD
20 124 (9.47%) Waterfall
Programming Languages
1 396 (30.25%) Java
2 383 (29.26%) JavaScript
3 362 (27.65%) Python
4 212 (16.20%) C++
5 200 (15.28%) Rust
6 195 (14.90%) SQL
7 192 (14.67%) Go
8 178 (13.60%) C#
9 126 (9.63%) TypeScript
10 16 (1.22%) PowerShell
11 14 (1.07%) Shell Script
12 13 (0.99%) C
12 13 (0.99%) PHP
13 10 (0.76%) Ruby
13 10 (0.76%) T-SQL
14 8 (0.61%) Swift
15 7 (0.53%) Ada
15 7 (0.53%) VB.NET
16 6 (0.46%) Apex Code
16 6 (0.46%) Scala
Qualifications
1 321 (24.52%) Security Cleared
2 212 (16.20%) DV Cleared
3 188 (14.36%) AWS Certification
4 184 (14.06%) Degree
5 182 (13.90%) AWS Certified Solutions Architect
6 179 (13.67%) AWS Certified Developer
7 104 (7.94%) SC Cleared
8 72 (5.50%) Computer Science Degree
9 55 (4.20%) PMI Certification
10 44 (3.36%) BPSS Clearance
10 44 (3.36%) PMP
11 25 (1.91%) Azure Certification
11 25 (1.91%) ISTQB
12 24 (1.83%) Master's Degree
13 20 (1.53%) Microsoft Certification
14 19 (1.45%) DBS Check
15 18 (1.38%) CISSP
16 15 (1.15%) CSPO
17 11 (0.84%) CISM
17 11 (0.84%) ISTQB Foundation Certification
Quality Assurance & Compliance
1 127 (9.70%) QA
2 42 (3.21%) Accessibility
3 18 (1.38%) GDPR
3 18 (1.38%) PMO
4 17 (1.30%) SLA
5 15 (1.15%) Data Quality
6 12 (0.92%) ISO/IEC 27001
7 11 (0.84%) ISO 20022
8 9 (0.69%) Actionable Recommendations
9 7 (0.53%) PCI DSS
10 5 (0.38%) GRC
10 5 (0.38%) IEC 62304
10 5 (0.38%) ISO 13485
11 4 (0.31%) NIST
12 3 (0.23%) California Consumer Privacy Act
12 3 (0.23%) GxP
12 3 (0.23%) PMBOK
13 2 (0.15%) ISO 8583
13 2 (0.15%) MiFID
13 2 (0.15%) WCAG
System Software
1 126 (9.63%) Docker
2 11 (0.84%) Firmware
3 9 (0.69%) Active Directory
4 6 (0.46%) Embedded Firmware
5 5 (0.38%) VMware Infrastructure
6 4 (0.31%) Postfix
7 3 (0.23%) Hyper-V
8 2 (0.15%) vSphere
9 1 (0.076%) NDS
9 1 (0.076%) RACF
9 1 (0.076%) Varnish
9 1 (0.076%) Virtual Desktop
9 1 (0.076%) Virtual Machines
Systems Management
1 107 (8.17%) Kubernetes
2 46 (3.51%) Terraform
3 31 (2.37%) Ansible
4 17 (1.30%) Grafana
4 17 (1.30%) Kibana
5 11 (0.84%) Prometheus
6 7 (0.53%) Progress Chef
7 6 (0.46%) Puppet
7 6 (0.46%) Single Sign-On
8 5 (0.38%) HP ALM
8 5 (0.38%) QRadar
9 3 (0.23%) HP Quality Center
9 3 (0.23%) Microsoft Intune
9 3 (0.23%) SCOM
10 2 (0.15%) Argo
10 2 (0.15%) Kustomize
11 1 (0.076%) CA Service Virtualization
11 1 (0.076%) CASB
11 1 (0.076%) Istio
11 1 (0.076%) PingFederate
Vendors
1 207 (15.81%) Microsoft
2 58 (4.43%) Oracle
3 47 (3.59%) Google
4 44 (3.36%) Salesforce
5 30 (2.29%) Atlassian
6 28 (2.14%) Databricks
7 24 (1.83%) ServiceNow
7 24 (1.83%) Splunk
8 21 (1.60%) Keysight
9 16 (1.22%) Siebel
10 15 (1.15%) IBM
10 15 (1.15%) SAP
11 11 (0.84%) Bloomberg
12 9 (0.69%) Adobe
12 9 (0.69%) Cisco
12 9 (0.69%) Okta
13 8 (0.61%) Dynatrace
13 8 (0.61%) HP
13 8 (0.61%) VMware
14 7 (0.53%) Informatica