MySQL
UK

The table below provides summary statistics for permanent job vacancies requiring MySQL skills. It includes a benchmarking guide to the annual salaries offered in vacancies that cited MySQL over the 6 months leading up to 14 May 2025, comparing them to the same period in the previous two years.

6 months to
14 May 2025
Same period 2024 Same period 2023
Rank 243 164 160
Rank change year-on-year -79 -4 -81
Permanent jobs citing MySQL 730 1,764 2,314
As % of all permanent jobs advertised in the UK 1.33% 1.78% 2.29%
As % of the Database & Business Intelligence category 9.39% 9.71% 10.70%
Number of salaries quoted 573 1,544 1,346
10th Percentile £31,250 £33,750 £35,500
25th Percentile £41,250 £41,250 £44,375
Median annual salary (50th Percentile) £55,000 £52,500 £57,000
Median % change year-on-year +4.76% -7.89% +3.64%
75th Percentile £68,750 £68,750 £77,500
90th Percentile £82,500 £85,000 £93,750
UK excluding London median annual salary £50,000 £50,000 £52,500
% change year-on-year - -4.76% +5.00%

All Database and Business Intelligence Skills
UK

MySQL falls under the Databases and Business Intelligence category. For comparison with the information above, the following table provides summary statistics for all permanent job vacancies requiring database or business intelligence skills.

Permanent vacancies with a requirement for database or business intelligence skills 7,771 18,164 21,622
As % of all permanent jobs advertised in the UK 14.11% 18.34% 21.36%
Number of salaries quoted 5,080 12,524 13,516
10th Percentile £37,000 £35,000 £37,500
25th Percentile £47,500 £42,725 £47,500
Median annual salary (50th Percentile) £62,500 £57,500 £65,000
Median % change year-on-year +8.70% -11.54% +8.33%
75th Percentile £83,750 £76,250 £83,750
90th Percentile £115,000 £96,250 £102,500
UK excluding London median annual salary £55,000 £52,500 £55,000
% change year-on-year +4.76% -4.55% +4.76%

MySQL
Job Vacancy Trend

Job postings citing MySQL as a proportion of all IT jobs advertised.
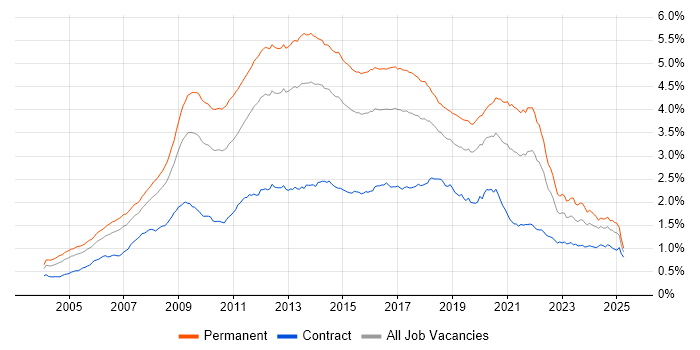
Job vacancy trend for MySQL in the UK

MySQL
Salary Trend

3-month moving average salary quoted in jobs citing MySQL.

Salary trend for MySQL in the UK

MySQL
Salary Histogram

Salary distribution for jobs citing MySQL over the 6 months to 14 May 2025.

Salary histogram for MySQL in the UK

MySQL
Top 18 Job Locations

The table below looks at the demand and provides a guide to the median salaries quoted in IT jobs citing MySQL within the UK over the 6 months to 14 May 2025. The 'Rank Change' column provides an indication of the change in demand within each location based on the same 6 month period last year.

Location Rank Change
on Same Period
Last Year
Matching
Permanent
IT Job Ads
Median Salary
Past 6 Months
Median Salary
% Change
on Same Period
Last Year
Live
Jobs
England -92 651 £55,000 +2.80% 655
UK excluding London -58 532 £50,000 - 472
Work from Home -75 296 £52,500 -8.70% 454
London -20 162 £60,000 -14.29% 251
South East -1 140 £50,000 -1.96% 136
North of England -114 135 £52,500 - 146
Midlands +3 97 £47,500 -5.00% 60
North West -104 85 £55,000 - 90
South West -5 66 £60,000 +33.33% 59
East of England -18 52 £47,500 - 59
West Midlands +8 51 £53,250 -3.18% 43
East Midlands +9 43 £40,000 -11.11% 13
Yorkshire -19 38 £47,500 - 37
Scotland +67 23 £55,000 +18.92% 17
Wales +24 16 £35,000 -32.82% 11
North East -12 12 £53,750 -14.00% 26
Northern Ireland +42 5 £85,000 -5.56% 7
Isle of Man - 1 £34,500 -

MySQL
Co-occurring Skills and Capabilities by Category

The follow tables expand on the table above by listing co-occurrences grouped by category. The same employment type, locality and period is covered with up to 20 co-occurrences shown in each of the following categories:

Application Platforms
1 71 (9.73%) Confluence
2 33 (4.52%) CMS
2 33 (4.52%) WordPress
3 21 (2.88%) Apache
4 16 (2.19%) nginx
5 12 (1.64%) Apache Solr
6 10 (1.37%) Apache Spark
7 7 (0.96%) Tomcat
8 6 (0.82%) IIS
9 5 (0.68%) Apache Airflow
9 5 (0.68%) Drupal
9 5 (0.68%) Oracle SOA Suite
9 5 (0.68%) SAS
10 3 (0.41%) SharePoint
11 2 (0.27%) Camunda
11 2 (0.27%) Microsoft Exchange
12 1 (0.14%) Appian
12 1 (0.14%) Jupyter
12 1 (0.14%) OpenEdge
12 1 (0.14%) OpenStack
Applications
1 15 (2.05%) Microsoft Office
2 10 (1.37%) Microsoft Excel
3 5 (0.68%) Microsoft PowerPoint
3 5 (0.68%) Photoshop
3 5 (0.68%) SPSS
4 1 (0.14%) MS Visio
4 1 (0.14%) Spreadsheet
4 1 (0.14%) Trello
Business Applications
1 12 (1.64%) Shopify
2 10 (1.37%) Magento
3 9 (1.23%) NetSuite
3 9 (1.23%) Payment Gateway
4 4 (0.55%) Relativity
4 4 (0.55%) Ringtail
4 4 (0.55%) Veritas eDiscovery
5 2 (0.27%) Dynamics CRM
5 2 (0.27%) Odoo
5 2 (0.27%) SAP Oil and Gas
6 1 (0.14%) SAP Business One
Cloud Services
1 361 (49.45%) AWS
2 149 (20.41%) Azure
3 125 (17.12%) GCP
4 66 (9.04%) GitHub
5 63 (8.63%) SaaS
6 36 (4.93%) Serverless
7 31 (4.25%) Power Platform
8 29 (3.97%) Amazon S3
9 24 (3.29%) Amazon ECS
10 23 (3.15%) AWS Lambda
11 22 (3.01%) PaaS
12 21 (2.88%) Amazon EC2
12 21 (2.88%) Azure DevOps
12 21 (2.88%) IaaS
13 20 (2.74%) GitHub Actions
14 19 (2.60%) Slack
15 17 (2.33%) Azure Monitor
15 17 (2.33%) Azure Service Bus
15 17 (2.33%) Power Automate
16 16 (2.19%) Azure AI
Communications & Networking
1 33 (4.52%) DNS
2 26 (3.56%) Firewall
3 23 (3.15%) VPN
4 21 (2.88%) Internet
5 16 (2.19%) SD-WAN
5 16 (2.19%) WAN
6 15 (2.05%) TCP/IP
7 12 (1.64%) FTP
8 10 (1.37%) HTTPS
9 8 (1.10%) IPsec
10 6 (0.82%) SSL
11 4 (0.55%) Ethernet
11 4 (0.55%) HTTP
11 4 (0.55%) MQTT
11 4 (0.55%) SMS
12 3 (0.41%) Multicast
12 3 (0.41%) SSH
12 3 (0.41%) VLAN
13 2 (0.27%) SAN
14 1 (0.14%) VoIP
Database & Business Intelligence
1 139 (19.04%) SQL Server
2 121 (16.58%) PostgreSQL
3 94 (12.88%) Relational Database
4 76 (10.41%) MongoDB
5 68 (9.32%) NoSQL
6 30 (4.11%) Power BI
7 26 (3.56%) Redis
8 23 (3.15%) Elasticsearch
9 21 (2.88%) DynamoDB
10 19 (2.60%) Amazon RDS
11 17 (2.33%) MariaDB
12 16 (2.19%) Data Lake
13 15 (2.05%) Big Data
14 14 (1.92%) Couchbase
14 14 (1.92%) RDBMS
15 11 (1.51%) Amazon Aurora
15 11 (1.51%) Data Warehouse
15 11 (1.51%) Hadoop
16 10 (1.37%) Amazon Redshift
16 10 (1.37%) Apache Hive
Development Applications
1 262 (35.89%) Git
2 80 (10.96%) JIRA
3 45 (6.16%) Bitbucket
4 31 (4.25%) Jenkins
5 30 (4.11%) GitLab
6 14 (1.92%) webpack
7 13 (1.78%) Maven
8 12 (1.64%) Gradle
9 10 (1.37%) PHPUnit
10 9 (1.23%) Grunt
10 9 (1.23%) Visual Studio
11 7 (0.96%) Selenium
11 7 (0.96%) Subversion
12 5 (0.68%) Jasmine
12 5 (0.68%) JMeter
12 5 (0.68%) Mocha
12 5 (0.68%) NUnit
12 5 (0.68%) Postman
12 5 (0.68%) TeamCity
13 4 (0.55%) Appium
General
1 160 (21.92%) Social Skills
2 147 (20.14%) Finance
3 64 (8.77%) Games
4 37 (5.07%) Analytical Skills
5 32 (4.38%) Marketing
5 32 (4.38%) Retail
6 22 (3.01%) Manufacturing
7 19 (2.60%) Pharmaceutical
7 19 (2.60%) Public Sector
8 16 (2.19%) Health Technology
9 15 (2.05%) Inclusion and Diversity
10 12 (1.64%) Law
11 11 (1.51%) Organisational Skills
12 10 (1.37%) Banking
12 10 (1.37%) Telecoms
13 9 (1.23%) Electronics
13 9 (1.23%) Tech for Good
14 8 (1.10%) Advertising
14 8 (1.10%) Mandarin Language
15 7 (0.96%) Cantonese Language
Job Titles
1 347 (47.53%) Developer
2 166 (22.74%) Senior
3 111 (15.21%) PHP Developer
4 88 (12.05%) Senior Developer
5 84 (11.51%) Software Engineer
6 75 (10.27%) Full-Stack Developer
7 50 (6.85%) Lead
8 36 (4.93%) Senior Software Engineer
9 33 (4.52%) Senior PHP Developer
10 30 (4.11%) Graduate
10 30 (4.11%) Graduate Developer
10 30 (4.11%) IT Graduate
11 28 (3.84%) Architect
12 26 (3.56%) Analyst
12 26 (3.56%) PHP Software Engineer
13 25 (3.42%) Data Engineer
14 24 (3.29%) C# Developer
15 23 (3.15%) Software Developer
16 22 (3.01%) Systems Engineer
17 20 (2.74%) Applications Support
Libraries, Frameworks & Software Standards
1 217 (29.73%) CSS
2 209 (28.63%) HTML
3 154 (21.10%) Laravel
4 153 (20.96%) React
5 128 (17.53%) .NET
6 91 (12.47%) Node.js
7 80 (10.96%) LAMP
8 76 (10.41%) Vue
9 74 (10.14%) RESTful
10 69 (9.45%) jQuery
11 61 (8.36%) AngularJS
12 55 (7.53%) Web Services
13 54 (7.40%) REST
14 45 (6.16%) Kafka
15 44 (6.03%) Spring
16 42 (5.75%) ASP.NET
17 38 (5.21%) Spring Boot
17 38 (5.21%) XML
18 34 (4.66%) Symfony
19 33 (4.52%) RabbitMQ
Miscellaneous
1 64 (8.77%) Mobile App
2 43 (5.89%) NHS
3 33 (4.52%) Cloud Native
4 32 (4.38%) Greenfield Project
5 26 (3.56%) IoT
6 21 (2.88%) Data Centre
7 18 (2.47%) Legacy Systems
8 14 (1.92%) Product Ownership
9 12 (1.64%) Linux Command Line
9 12 (1.64%) Management Information System
10 11 (1.51%) Distributed Systems
10 11 (1.51%) Legacy Code
10 11 (1.51%) Self-Motivation
11 10 (1.37%) Virtual Team
12 9 (1.23%) Onboarding
12 9 (1.23%) Replication
13 8 (1.10%) Data Structures
13 8 (1.10%) Enterprise Software
14 7 (0.96%) Public Cloud
14 7 (0.96%) Smart Home
Operating Systems
1 148 (20.27%) Linux
2 63 (8.63%) Windows
3 15 (2.05%) CentOS
4 11 (1.51%) Android
4 11 (1.51%) Apple iOS
5 9 (1.23%) Ubuntu
6 5 (0.68%) Red Hat Enterprise Linux
6 5 (0.68%) Unix
6 5 (0.68%) Windows Server
7 4 (0.55%) Rocky
8 3 (0.41%) Debian
9 2 (0.27%) AIX
9 2 (0.27%) Oracle Linux
10 1 (0.14%) Fedora
10 1 (0.14%) Windows Server 2019
Processes & Methodologies
1 238 (32.60%) Agile
2 180 (24.66%) Problem-Solving
3 159 (21.78%) Software Engineering
4 154 (21.10%) CI/CD
5 125 (17.12%) MVC
6 122 (16.71%) OOP
7 120 (16.44%) E-Commerce
8 114 (15.62%) Full-Stack Development
9 100 (13.70%) DevOps
10 96 (13.15%) Web Development
11 84 (11.51%) Microservices
12 81 (11.10%) Computer Science
13 71 (9.73%) OO
13 71 (9.73%) User Experience
14 67 (9.18%) Continuous Improvement
15 60 (8.22%) Roadmaps
16 56 (7.67%) Artificial Intelligence
16 56 (7.67%) B2B
17 55 (7.53%) Analytics
18 52 (7.12%) Coaching
Programming Languages
1 306 (41.92%) PHP
2 284 (38.90%) JavaScript
3 216 (29.59%) SQL
4 147 (20.14%) Python
5 125 (17.12%) Java
6 120 (16.44%) C#
7 92 (12.60%) TypeScript
8 37 (5.07%) C++
9 32 (4.38%) PL/SQL
9 32 (4.38%) PowerShell
10 28 (3.84%) Bash
11 23 (3.15%) Ruby
12 20 (2.74%) Go
13 16 (2.19%) Bicep
14 12 (1.64%) T-SQL
15 10 (1.37%) R
16 8 (1.10%) Perl
17 6 (0.82%) MATLAB
18 5 (0.68%) C
19 4 (0.55%) Shell Script
Qualifications
1 99 (13.56%) Degree
2 65 (8.90%) Computer Science Degree
3 28 (3.84%) BPSS Clearance
4 24 (3.29%) Security Cleared
5 22 (3.01%) DBS Check
6 21 (2.88%) SC Cleared
7 19 (2.60%) Azure Certification
8 8 (1.10%) Master's Degree
9 7 (0.96%) AWS Certification
10 5 (0.68%) AWS Certified Solutions Architect
10 5 (0.68%) DV Cleared
10 5 (0.68%) ISTQB
11 2 (0.27%) Microsoft Certification
12 1 (0.14%) CCNA
12 1 (0.14%) Cisco Certification
12 1 (0.14%) HNC
12 1 (0.14%) HND
12 1 (0.14%) PhD
12 1 (0.14%) Postgraduate
12 1 (0.14%) VMware Certified Professional (VCP)
Quality Assurance & Compliance
1 44 (6.03%) QA
2 11 (1.51%) Accessibility
3 10 (1.37%) HL7
4 9 (1.23%) Data Quality
5 6 (0.82%) GDPR
6 4 (0.55%) GMP
7 3 (0.41%) ISO/IEC 27001
7 3 (0.41%) NCSC
7 3 (0.41%) WCAG
8 2 (0.27%) Dublin Core
8 2 (0.27%) PCI DSS
9 1 (0.14%) NIST
9 1 (0.14%) SLA
9 1 (0.14%) SOC 2
System Software
1 129 (17.67%) Docker
2 17 (2.33%) Virtual Machines
3 9 (1.23%) VMware Infrastructure
4 4 (0.55%) Active Directory
4 4 (0.55%) KVM
4 4 (0.55%) Virtual Servers
4 4 (0.55%) VMware ESXi
4 4 (0.55%) vSphere
5 3 (0.41%) LXC
5 3 (0.41%) Samba
6 2 (0.27%) Postfix
6 2 (0.27%) Sendmail
6 2 (0.27%) Xen
7 1 (0.14%) Apache ZooKeeper
7 1 (0.14%) Citrix Hypervisor
7 1 (0.14%) Corosync
7 1 (0.14%) Hyper-V
7 1 (0.14%) Kamailio
7 1 (0.14%) NFS
Systems Management
1 83 (11.37%) Kubernetes
2 62 (8.49%) Ansible
3 56 (7.67%) Terraform
4 17 (2.33%) Single Sign-On
5 15 (2.05%) Grafana
6 12 (1.64%) Prometheus
7 9 (1.23%) Nagios
8 7 (0.96%) Argo
8 7 (0.96%) Kustomize
9 4 (0.55%) Oozie
10 3 (0.41%) Nessus
10 3 (0.41%) Puppet
10 3 (0.41%) Red Hat Satellite
11 2 (0.27%) Kubespray
12 1 (0.14%) CFEngine
12 1 (0.14%) Check_MK
12 1 (0.14%) FortiGate
12 1 (0.14%) Kibana
12 1 (0.14%) logstash
12 1 (0.14%) Progress Chef
Vendors
1 55 (7.53%) Microsoft
2 42 (5.75%) Atlassian
2 42 (5.75%) Oracle
3 30 (4.11%) Google
4 19 (2.60%) Databricks
4 19 (2.60%) Twitter
5 16 (2.19%) Meraki
6 15 (2.05%) New Relic
6 15 (2.05%) WooCommerce
7 13 (1.78%) Red Hat
7 13 (1.78%) VMware
8 11 (1.51%) Adobe
9 10 (1.37%) SAP
10 7 (0.96%) Splunk
11 6 (0.82%) Rollbar
11 6 (0.82%) Sawtooth Software
12 5 (0.68%) Ahrefs
12 5 (0.68%) Screaming Frog
12 5 (0.68%) Vertica
13 4 (0.55%) Talend