Test Automation Jobs

Automated Testing
UK

The table below provides summary statistics for permanent job vacancies requiring Test Automation skills. It includes a benchmarking guide to the annual salaries offered in vacancies that cited Test Automation over the 6 months leading up to 28 May 2025, comparing them to the same period in the previous two years.

6 months to
28 May 2025
Same period 2024 Same period 2023
Rank 90 96 36
Rank change year-on-year +6 -60 -2
Permanent jobs citing Test Automation 1,701 2,772 6,624
As % of all permanent jobs advertised in the UK 3.11% 2.71% 6.76%
As % of the Processes & Methodologies category 3.32% 3.22% 7.08%
Number of salaries quoted 928 1,750 2,888
10th Percentile £41,250 £36,250 £40,500
25th Percentile £50,000 £43,750 £50,000
Median annual salary (50th Percentile) £60,000 £57,500 £65,000
Median % change year-on-year +4.35% -11.54% +8.33%
75th Percentile £78,750 £72,500 £82,500
90th Percentile £97,528 £87,500 £97,500
UK excluding London median annual salary £59,900 £52,500 £57,500
% change year-on-year +14.10% -8.70% +9.23%

All Process and Methodology Skills
UK

Test Automation falls under the Processes and Methodologies category. For comparison with the information above, the following table provides summary statistics for all permanent job vacancies requiring process or methodology skills.

Permanent vacancies with a requirement for process or methodology skills 51,242 86,144 93,565
As % of all permanent jobs advertised in the UK 93.71% 84.33% 95.55%
Number of salaries quoted 25,211 60,433 55,406
10th Percentile £29,000 £29,250 £34,000
25th Percentile £41,250 £40,000 £45,000
Median annual salary (50th Percentile) £57,500 £55,000 £61,000
Median % change year-on-year +4.55% -9.84% +1.67%
75th Percentile £75,000 £72,500 £81,250
90th Percentile £97,500 £92,500 £100,000
UK excluding London median annual salary £51,645 £50,000 £55,000
% change year-on-year +3.29% -9.09% +4.76%

Test Automation
Job Vacancy Trend

Job postings citing Test Automation as a proportion of all IT jobs advertised.
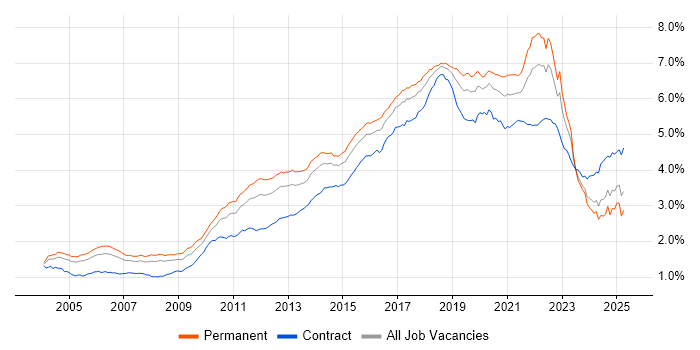
Job vacancy trend for Test Automation in the UK

Test Automation
Salary Trend

3-month moving average salary quoted in jobs citing Test Automation.

Salary trend for Test Automation in the UK

Test Automation
Salary Histogram

Salary distribution for jobs citing Test Automation over the 6 months to 28 May 2025.

Salary histogram for Test Automation in the UK

Test Automation
Top 18 Job Locations

The table below looks at the demand and provides a guide to the median salaries quoted in IT jobs citing Test Automation within the UK over the 6 months to 28 May 2025. The 'Rank Change' column provides an indication of the change in demand within each location based on the same 6 month period last year.

Location Rank Change
on Same Period
Last Year
Matching
Permanent
IT Job Ads
Median Salary
Past 6 Months
Median Salary
% Change
on Same Period
Last Year
Live
Jobs
England +11 1,462 £60,000 - 5,798
UK excluding London +1 1,196 £59,900 +14.10% 5,624
Work from Home +15 750 £60,000 +9.09% 3,641
London +8 414 £70,000 - 953
South East +7 326 £60,000 +9.09% 1,491
North of England +3 308 £55,000 - 1,254
North West -21 222 £55,000 - 594
Midlands +5 174 £58,000 +16.00% 998
South West +56 153 £60,000 +6.19% 683
Scotland 0 135 £58,000 +16.00% 331
West Midlands +2 96 £66,250 +26.19% 520
East Midlands +56 78 £47,500 - 420
East of England +11 75 £57,000 +3.64% 764
Yorkshire +15 63 £52,723 -4.14% 489
North East +40 23 £59,002 -1.66% 173
Wales +3 23 £60,000 +20.00% 169
Northern Ireland +41 10 £55,000 -4.35% 119
Isle of Man - 1 £52,500 - 2

Test Automation
Co-occurring Skills and Capabilities by Category

The follow tables expand on the table above by listing co-occurrences grouped by category. The same employment type, locality and period is covered with up to 20 co-occurrences shown in each of the following categories:

Application Platforms
1 198 (11.64%) Confluence
2 22 (1.29%) Apache Spark
3 16 (0.94%) SharePoint
4 12 (0.71%) CMS
5 10 (0.59%) nginx
6 9 (0.53%) Apache
6 9 (0.53%) Tomcat
7 7 (0.41%) Apache Airflow
8 6 (0.35%) Appian
9 5 (0.29%) JBoss
9 5 (0.29%) Liferay
9 5 (0.29%) Microsoft Exchange
10 4 (0.24%) CICS
10 4 (0.24%) IIS
10 4 (0.24%) SAS
11 3 (0.18%) Apache Solr
11 3 (0.18%) Cloud Foundry
12 2 (0.12%) Drupal
12 2 (0.12%) Umbraco
12 2 (0.12%) WinCC
Applications
1 10 (0.59%) Microsoft Office
2 9 (0.53%) Chatbot
3 8 (0.47%) Microsoft Excel
4 5 (0.29%) MS Visio
5 4 (0.24%) Blender
5 4 (0.24%) SOLIDWORKS
6 1 (0.059%) AutoCAD
6 1 (0.059%) Microsoft PowerPoint
Business Applications
1 17 (1.00%) Dynamics CRM
2 5 (0.29%) Elite 3E
3 4 (0.24%) Remedy ITSM
4 2 (0.12%) Oracle BPM
4 2 (0.12%) SAP S/4HANA
4 2 (0.12%) Shopify
5 1 (0.059%) Aladdin
5 1 (0.059%) Endur
5 1 (0.059%) Magento
5 1 (0.059%) Payment Gateway
5 1 (0.059%) Salesforce CRM
5 1 (0.059%) Siebel CRM
Cloud Services
1 624 (36.68%) Azure
2 546 (32.10%) AWS
3 296 (17.40%) GCP
4 153 (8.99%) Azure DevOps
5 101 (5.94%) Serverless
6 92 (5.41%) GitHub
7 69 (4.06%) AWS Lambda
8 54 (3.17%) SaaS
9 49 (2.88%) Amazon S3
10 46 (2.70%) PaaS
11 45 (2.65%) GitHub Actions
12 31 (1.82%) Amazon EC2
13 30 (1.76%) Power Platform
14 24 (1.41%) Cloud Computing
15 22 (1.29%) Azure Logic Apps
15 22 (1.29%) Dynamics 365
16 21 (1.23%) Microsoft 365
17 19 (1.12%) Power Automate
18 18 (1.06%) AWS CloudFormation
18 18 (1.06%) npm
Communications & Networking
1 78 (4.59%) TCP/IP
2 72 (4.23%) VPN
3 33 (1.94%) 5G
4 32 (1.88%) SD-WAN
4 32 (1.88%) WAN
5 15 (0.88%) Internet
6 12 (0.71%) Network Security
7 11 (0.65%) DNS
8 10 (0.59%) HTTP
9 9 (0.53%) Bluetooth
10 8 (0.47%) BGP
10 8 (0.47%) Firewall
10 8 (0.47%) VLAN
11 7 (0.41%) SSL
12 6 (0.35%) Multicast
12 6 (0.35%) OSPF
12 6 (0.35%) SAN
12 6 (0.35%) Wi-Fi
12 6 (0.35%) Wireless
13 5 (0.29%) SMTP
Database & Business Intelligence
1 311 (18.28%) SQL Server
2 93 (5.47%) NoSQL
3 86 (5.06%) PostgreSQL
4 65 (3.82%) Relational Database
5 54 (3.17%) MongoDB
6 52 (3.06%) DynamoDB
7 50 (2.94%) MySQL
8 27 (1.59%) Amazon RDS
8 27 (1.59%) Big Data
9 21 (1.23%) Power BI
10 14 (0.82%) Amazon Aurora
11 13 (0.76%) Data Warehouse
11 13 (0.76%) Elasticsearch
12 12 (0.71%) DB2
13 10 (0.59%) Cloud Spanner
14 9 (0.53%) RDBMS
15 7 (0.41%) Data Lake
16 6 (0.35%) Amazon Athena
16 6 (0.35%) Oracle Database
17 5 (0.29%) Semantic Layer
Development Applications
1 449 (26.40%) Selenium
2 411 (24.16%) JIRA
3 371 (21.81%) Cucumber
4 301 (17.70%) GitLab
5 295 (17.34%) Maven
6 291 (17.11%) SonarQube
7 274 (16.11%) Sonatype Nexus
8 262 (15.40%) Bitbucket
9 223 (13.11%) Git
10 138 (8.11%) Jenkins
11 87 (5.11%) Postman
12 78 (4.59%) Robot Framework
13 69 (4.06%) Cypress.io
14 58 (3.41%) JUnit
15 46 (2.70%) Appium
16 42 (2.47%) JMeter
17 28 (1.65%) SoapUI
17 28 (1.65%) SpecFlow
17 28 (1.65%) TestNG
18 27 (1.59%) Visual Studio
General
1 615 (36.16%) Finance
2 436 (25.63%) Social Skills
3 408 (23.99%) Inclusion and Diversity
4 405 (23.81%) Banking
5 146 (8.58%) Analytical Skills
6 110 (6.47%) Retail
7 96 (5.64%) Investment Banking
8 90 (5.29%) Corporate Banking
9 88 (5.17%) Law
10 77 (4.53%) Telecoms
11 72 (4.23%) Public Sector
12 45 (2.65%) Electronics
13 40 (2.35%) Marketing
14 39 (2.29%) Presentation Skills
15 37 (2.18%) Legal
16 34 (2.00%) Manufacturing
17 32 (1.88%) Games
18 31 (1.82%) Front Office
19 24 (1.41%) Aerospace
20 17 (1.00%) Organisational Skills
Job Titles
1 481 (28.28%) Software Engineer
2 420 (24.69%) Senior
3 265 (15.58%) Developer
4 228 (13.40%) Lead
5 201 (11.82%) Test Engineer
6 123 (7.23%) Senior Developer
7 110 (6.47%) Senior Software Engineer
8 104 (6.11%) Test Automation Engineer
9 95 (5.58%) Analyst
10 80 (4.70%) QA Engineer
11 77 (4.53%) DevOps Engineer
12 65 (3.82%) Senior Test Engineer
13 63 (3.70%) Software Test Engineer
14 59 (3.47%) Software Developer
14 59 (3.47%) Test Analyst
15 58 (3.41%) Java Engineer
16 55 (3.23%) Senior Software Test Engineer
17 49 (2.88%) Automation Engineer
18 47 (2.76%) Tester
19 41 (2.41%) Team Leader
Libraries, Frameworks & Software Standards
1 399 (23.46%) React
2 351 (20.63%) HTML
3 348 (20.46%) CSS
4 344 (20.22%) Spring Boot
5 327 (19.22%) Spring
6 321 (18.87%) Kafka
7 255 (14.99%) JPA
7 255 (14.99%) Redux
8 211 (12.40%) RESTful
9 196 (11.52%) REST
10 176 (10.35%) Hibernate
11 135 (7.94%) .NET
12 121 (7.11%) HTML5
13 112 (6.58%) Jest
14 107 (6.29%) CSS3
15 99 (5.82%) Sass
16 98 (5.76%) Node.js
17 88 (5.17%) Playwright
18 58 (3.41%) AngularJS
19 52 (3.06%) .NET Framework
Miscellaneous
1 312 (18.34%) Product Ownership
2 259 (15.23%) Enterprise Software
3 71 (4.17%) Linux Command Line
4 70 (4.12%) Cloud Native
5 62 (3.64%) Algorithms
6 60 (3.53%) Mobile App
7 57 (3.35%) Public Cloud
8 51 (3.00%) Distributed Systems
9 43 (2.53%) Management Information System
10 42 (2.47%) e-Learning
11 40 (2.35%) Hybrid Cloud
12 39 (2.29%) Data Structures
13 38 (2.23%) Self-Motivation
14 32 (1.88%) Self-Driving Car
15 28 (1.65%) Onboarding
16 27 (1.59%) Equities
17 25 (1.47%) Legacy Systems
18 24 (1.41%) Virtual Team
19 22 (1.29%) Embedded Systems
20 20 (1.18%) Client/Server
Operating Systems
1 196 (11.52%) Linux
2 122 (7.17%) Windows
3 35 (2.06%) Apple iOS
4 33 (1.94%) Android
5 30 (1.76%) Unix
6 7 (0.41%) Windows Server 2019
7 6 (0.35%) Red Hat Enterprise Linux
7 6 (0.35%) Windows Server
8 5 (0.29%) Windows 10
8 5 (0.29%) Windows Server 2012
8 5 (0.29%) Windows Server 2016
9 4 (0.24%) Ubuntu
10 3 (0.18%) zOS
11 1 (0.059%) Debian
11 1 (0.059%) VMS
Processes & Methodologies
1 982 (57.73%) Agile
2 731 (42.97%) CI/CD
3 711 (41.80%) DevOps
4 614 (36.10%) Software Engineering
5 477 (28.04%) Microservices
6 438 (25.75%) Containerisation
7 423 (24.87%) SDLC
8 402 (23.63%) Mentoring
9 387 (22.75%) Problem-Solving
10 370 (21.75%) Full-Stack Development
11 342 (20.11%) Software Testing
12 320 (18.81%) Front End Development
13 307 (18.05%) TDD
14 272 (15.99%) Performance Optimisation
15 260 (15.29%) Continuous Improvement
16 253 (14.87%) Computer Science
17 237 (13.93%) Clean Code
18 214 (12.58%) User Experience
19 191 (11.23%) Scrum
20 173 (10.17%) Code Quality
Programming Languages
1 614 (36.10%) Java
2 581 (34.16%) JavaScript
3 506 (29.75%) SQL
4 412 (24.22%) Python
5 246 (14.46%) TypeScript
6 208 (12.23%) C#
7 117 (6.88%) C++
8 109 (6.41%) PowerShell
9 82 (4.82%) Bash
10 68 (4.00%) Rust
11 56 (3.29%) C
12 45 (2.65%) PHP
13 43 (2.53%) Go
14 20 (1.18%) Kotlin
15 16 (0.94%) Scala
16 14 (0.82%) Ada
17 13 (0.76%) Groovy
17 13 (0.76%) MATLAB
18 10 (0.59%) Ruby
18 10 (0.59%) Swift
Qualifications
1 378 (22.22%) Degree
2 111 (6.53%) BPSS Clearance
3 105 (6.17%) ISTQB
4 81 (4.76%) Security Cleared
5 75 (4.41%) Computer Science Degree
6 53 (3.12%) SC Cleared
7 28 (1.65%) Master's Degree
8 22 (1.29%) DV Cleared
9 21 (1.23%) HND
9 21 (1.23%) ISTQB Foundation Certification
10 16 (0.94%) HNC
11 14 (0.82%) Chartered Engineer
12 13 (0.76%) AWS Certification
13 11 (0.65%) ISEB
14 9 (0.53%) Azure Certification
15 7 (0.41%) DBS Check
16 6 (0.35%) AWS Certified Solutions Architect
16 6 (0.35%) CCNP
16 6 (0.35%) Cisco Certification
17 5 (0.29%) ACCA
Quality Assurance & Compliance
1 570 (33.51%) QA
2 121 (7.11%) Accessibility
3 50 (2.94%) ISO/IEC 12207
4 27 (1.59%) NCSC
5 24 (1.41%) ISO/IEC 27001
6 19 (1.12%) NIST
7 18 (1.06%) PMO
8 11 (0.65%) Software Quality Assurance
9 9 (0.53%) GDPR
10 6 (0.35%) Data Quality
11 4 (0.24%) Basel II
11 4 (0.24%) Basel III
11 4 (0.24%) Dodd-Frank
11 4 (0.24%) IFRS
11 4 (0.24%) IFRS 9
11 4 (0.24%) PCI DSS
12 3 (0.18%) PMBOK
12 3 (0.18%) SEPA
12 3 (0.18%) WCAG
13 2 (0.12%) GxP
System Software
1 460 (27.04%) Docker
2 18 (1.06%) Active Directory
2 18 (1.06%) VMware Infrastructure
3 11 (0.65%) Firmware
4 7 (0.41%) Embedded Firmware
5 5 (0.29%) Hyper-V
6 4 (0.24%) Virtual Desktop
6 4 (0.24%) VMware NSX
7 2 (0.12%) HDFS
7 2 (0.12%) KVM
7 2 (0.12%) Virtual Machines
7 2 (0.12%) vSphere
7 2 (0.12%) Xen
8 1 (0.059%) Terminal Server
8 1 (0.059%) zsh
Systems Management
1 466 (27.40%) Kubernetes
2 150 (8.82%) Terraform
3 50 (2.94%) Ansible
4 25 (1.47%) Prometheus
5 18 (1.06%) Grafana
6 14 (0.82%) Istio
7 11 (0.65%) Packer
8 8 (0.47%) Argo
8 8 (0.47%) Kustomize
9 7 (0.41%) Microsoft Intune
10 6 (0.35%) Jamf Pro
10 6 (0.35%) Progress Chef
10 6 (0.35%) Single Sign-On
11 5 (0.29%) HP Quality Center
12 4 (0.24%) Puppet
13 2 (0.12%) CFEngine
13 2 (0.12%) FortiGate
13 2 (0.12%) Iperf
13 2 (0.12%) Mesos
13 2 (0.12%) Rundeck
Vendors
1 248 (14.58%) Solace
2 121 (7.11%) Microsoft
3 60 (3.53%) IBM
4 51 (3.00%) Red Hat
5 49 (2.88%) Google
6 39 (2.29%) Oracle
7 28 (1.65%) VMware
8 27 (1.59%) Salesforce
9 25 (1.47%) Databricks
10 21 (1.23%) Cisco
10 21 (1.23%) Keysight
11 14 (0.82%) Siebel
12 13 (0.76%) Atlassian
12 13 (0.76%) SAP
13 8 (0.47%) F5
13 8 (0.47%) ServiceNow
14 7 (0.41%) Splunk
14 7 (0.41%) UiPath
15 6 (0.35%) Meraki
15 6 (0.35%) OpenAI