Relational Database Jobs

Relational Database
UK

The table below provides summary statistics for permanent job vacancies requiring Relational Database skills. It includes a benchmarking guide to the annual salaries offered in vacancies that cited Relational Database over the 6 months leading up to 30 May 2025, comparing them to the same period in the previous two years.

6 months to
30 May 2025
Same period 2024 Same period 2023
Rank 239 206 185
Rank change year-on-year -33 -21 -93
Permanent jobs citing Relational Database 758 1,472 1,967
As % of all permanent jobs advertised in the UK 1.37% 1.43% 2.02%
As % of the Database & Business Intelligence category 9.90% 8.02% 9.41%
Number of salaries quoted 318 897 1,297
10th Percentile £41,061 £36,120 £41,500
25th Percentile £50,000 £46,250 £48,750
Median annual salary (50th Percentile) £65,000 £57,500 £65,000
Median % change year-on-year +13.04% -11.54% +13.04%
75th Percentile £80,000 £73,750 £83,750
90th Percentile £97,500 £90,000 £102,500
UK excluding London median annual salary £55,565 £52,500 £52,700
% change year-on-year +5.84% -0.38% +0.38%

All Database and Business Intelligence Skills
UK

Relational Database falls under the Databases and Business Intelligence category. For comparison with the information above, the following table provides summary statistics for all permanent job vacancies requiring database or business intelligence skills.

Permanent vacancies with a requirement for database or business intelligence skills 7,654 18,365 20,897
As % of all permanent jobs advertised in the UK 13.81% 17.78% 21.51%
Number of salaries quoted 4,812 12,527 13,034
10th Percentile £36,250 £35,000 £37,500
25th Percentile £47,500 £42,725 £47,500
Median annual salary (50th Percentile) £60,394 £57,500 £65,000
Median % change year-on-year +5.03% -11.54% +8.33%
75th Percentile £82,751 £77,500 £82,500
90th Percentile £112,500 £97,500 £103,750
UK excluding London median annual salary £55,000 £52,500 £55,000
% change year-on-year +4.76% -4.55% +4.76%

Relational Database
Job Vacancy Trend

Job postings citing Relational Database as a proportion of all IT jobs advertised.
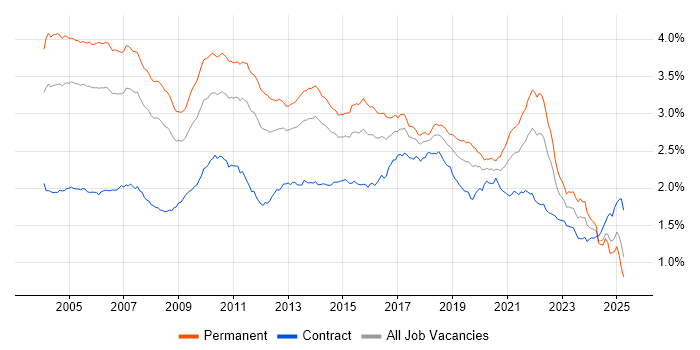
Job vacancy trend for Relational Database in the UK

Relational Database
Salary Trend

3-month moving average salary quoted in jobs citing Relational Database.

Salary trend for Relational Database in the UK

Relational Database
Salary Histogram

Salary distribution for jobs citing Relational Database over the 6 months to 30 May 2025.

Salary histogram for Relational Database in the UK

Relational Database
Top 17 Job Locations

The table below looks at the demand and provides a guide to the median salaries quoted in IT jobs citing Relational Database within the UK over the 6 months to 30 May 2025. The 'Rank Change' column provides an indication of the change in demand within each location based on the same 6 month period last year.

Location Rank Change
on Same Period
Last Year
Matching
Permanent
IT Job Ads
Median Salary
Past 6 Months
Median Salary
% Change
on Same Period
Last Year
Live
Jobs
England -33 690 £64,500 +7.50% 1,912
Work from Home +11 418 £60,750 +5.65% 1,121
UK excluding London -77 368 £55,565 +5.84% 1,915
London +45 303 £75,000 +7.14% 273
South East -46 107 £55,565 +1.03% 565
North of England -94 68 £52,500 -4.55% 400
Midlands +37 62 £45,000 -14.29% 349
East of England +37 48 £62,000 +25.89% 273
North West -104 44 £52,500 -4.55% 183
West Midlands +21 41 £60,000 +9.09% 185
South West +35 39 £55,000 +10.00% 231
Scotland -3 23 £80,000 +60.00% 94
East Midlands +33 21 £37,500 -25.00% 142
Yorkshire +9 21 £55,000 +4.76% 167
Wales +37 20 £65,000 +78.20% 52
North East +46 7 £49,375 -34.00% 50
Northern Ireland +29 1 £28,000 -19.14% 23

Relational Database
Co-occurring Skills and Capabilities by Category

The follow tables expand on the table above by listing co-occurrences grouped by category. The same employment type, locality and period is covered with up to 20 co-occurrences shown in each of the following categories:

Application Platforms
1 70 (9.23%) Confluence
2 21 (2.77%) Apache Airflow
3 18 (2.37%) Apache Spark
4 14 (1.85%) Apache
4 14 (1.85%) JBoss
4 14 (1.85%) Red Hat Fuse
5 8 (1.06%) Microsoft Exchange
6 6 (0.79%) IIS
6 6 (0.79%) OpenStack
7 5 (0.66%) SharePoint
8 4 (0.53%) GemFire
9 3 (0.40%) CMS
9 3 (0.40%) OpenEdge
10 2 (0.26%) Appian
11 1 (0.13%) Camunda
11 1 (0.13%) Headless CMS
11 1 (0.13%) Luigi
11 1 (0.13%) Oracle Application Server
11 1 (0.13%) Umbraco
11 1 (0.13%) WordPress
Applications
1 42 (5.54%) Microsoft Excel
2 30 (3.96%) Microsoft Office
3 5 (0.66%) InDesign
4 4 (0.53%) Microsoft PowerPoint
5 1 (0.13%) Spreadsheet
5 1 (0.13%) Trello
Business Applications
1 11 (1.45%) NetSuite
2 7 (0.92%) Raiser’s Edge
3 4 (0.53%) Dynamics CRM
3 4 (0.53%) Endur
3 4 (0.53%) Relativity
3 4 (0.53%) Ringtail
3 4 (0.53%) Veritas eDiscovery
4 3 (0.40%) Orchestrade
5 1 (0.13%) Salesforce CRM
5 1 (0.13%) SAP Business One
Cloud Services
1 366 (48.28%) AWS
2 215 (28.36%) Pulumi
3 156 (20.58%) Azure
4 58 (7.65%) Serverless
5 55 (7.26%) Power Platform
6 48 (6.33%) GCP
7 39 (5.15%) Amazon ECS
8 36 (4.75%) Amazon EKS
9 28 (3.69%) Azure DevOps
10 23 (3.03%) GitHub
11 20 (2.64%) Azure Data Factory
11 20 (2.64%) SaaS
12 18 (2.37%) Amazon EC2
13 14 (1.85%) Amazon S3
13 14 (1.85%) Azure Monitor
13 14 (1.85%) Azure Synapse Analytics
13 14 (1.85%) Dynamics 365
14 13 (1.72%) Snowflake
15 12 (1.58%) AWS Lambda
15 12 (1.58%) Boomi
Communications & Networking
1 215 (28.36%) Broadband
2 26 (3.43%) Network Security
3 18 (2.37%) TCP/IP
4 17 (2.24%) Firewall
5 12 (1.58%) Internet
6 11 (1.45%) HTTP
7 9 (1.19%) FTP
7 9 (1.19%) SMTP
8 8 (1.06%) LAN
8 8 (1.06%) VPN
8 8 (1.06%) WAN
9 6 (0.79%) DNS
10 5 (0.66%) Modbus
10 5 (0.66%) MQTT
11 4 (0.53%) Telnet
12 1 (0.13%) SSL
12 1 (0.13%) X.21
Database & Business Intelligence
1 341 (44.99%) RDBMS
2 275 (36.28%) NoSQL
3 132 (17.41%) PostgreSQL
4 110 (14.51%) SQL Server
5 103 (13.59%) MySQL
6 45 (5.94%) MongoDB
7 43 (5.67%) Data Warehouse
7 43 (5.67%) Power BI
8 19 (2.51%) Data Lake
9 18 (2.37%) SQL Server Integration Services
10 15 (1.98%) Big Data
10 15 (1.98%) DB2
10 15 (1.98%) SQL Server Reporting Services
11 14 (1.85%) Amazon Redshift
12 12 (1.58%) BigQuery
12 12 (1.58%) Elasticsearch
13 11 (1.45%) Hadoop
13 11 (1.45%) Oracle Reports
13 11 (1.45%) Redis
14 10 (1.32%) Tableau
Development Applications
1 215 (28.36%) Jaeger
2 145 (19.13%) Git
3 84 (11.08%) JIRA
4 52 (6.86%) Jenkins
5 41 (5.41%) Bitbucket
6 34 (4.49%) JUnit
7 17 (2.24%) Postman
8 16 (2.11%) Selenium
8 16 (2.11%) Visual Studio
9 14 (1.85%) GitLab
9 14 (1.85%) JMeter
10 13 (1.72%) Mockito
11 9 (1.19%) Cucumber
11 9 (1.19%) Moq
11 9 (1.19%) SoapUI
11 9 (1.19%) SpecFlow
12 6 (0.79%) Subversion
13 5 (0.66%) Fiddler
13 5 (0.66%) TeamCity
14 4 (0.53%) Team Foundation Server
General
1 257 (33.91%) Inclusion and Diversity
2 166 (21.90%) Social Skills
3 131 (17.28%) Finance
4 91 (12.01%) Analytical Skills
5 61 (8.05%) Public Sector
6 55 (7.26%) Banking
7 45 (5.94%) Law
8 44 (5.80%) Marketing
9 23 (3.03%) Manufacturing
10 15 (1.98%) Front Office
10 15 (1.98%) Investment Banking
11 13 (1.72%) Pharmaceutical
12 11 (1.45%) Telecoms
13 9 (1.19%) Electronics
13 9 (1.19%) Organisational Skills
13 9 (1.19%) Presentation Skills
13 9 (1.19%) Retail
14 8 (1.06%) Back Office
14 8 (1.06%) Games
15 7 (0.92%) Documentation Skills
Job Titles
1 272 (35.88%) Lead
2 227 (29.95%) Team Leader
3 172 (22.69%) Developer
4 103 (13.59%) Senior
5 83 (10.95%) Software Engineer
6 68 (8.97%) Analyst
7 45 (5.94%) Java Developer
8 44 (5.80%) Senior Developer
9 31 (4.09%) Data Engineer
10 30 (3.96%) Senior Software Engineer
11 25 (3.30%) Java Engineer
11 25 (3.30%) Lead Software Engineer
12 24 (3.17%) Support Analyst
13 23 (3.03%) .NET Developer
14 22 (2.90%) Full-Stack Developer
15 17 (2.24%) Architect
15 17 (2.24%) Software Developer
16 16 (2.11%) Backend Developer
16 16 (2.11%) IT Engineer
16 16 (2.11%) Systems Engineer
Libraries, Frameworks & Software Standards
1 232 (30.61%) Elastic Stack
2 215 (28.36%) OpenTelemetry
3 118 (15.57%) .NET
4 86 (11.35%) REST
5 77 (10.16%) Spring
6 72 (9.50%) HTML
7 67 (8.84%) Spring Boot
8 65 (8.58%) Web Services
9 60 (7.92%) React
10 59 (7.78%) CSS
11 54 (7.12%) Kafka
12 51 (6.73%) RESTful
13 32 (4.22%) .NET Framework
13 32 (4.22%) ASP.NET
14 29 (3.83%) Hibernate
14 29 (3.83%) SOAP
15 27 (3.56%) .NET Core
15 27 (3.56%) AngularJS
15 27 (3.56%) Apache Camel
16 26 (3.43%) jQuery
Miscellaneous
1 38 (5.01%) Distributed Systems
2 34 (4.49%) Management Information System
3 32 (4.22%) Data Structures
4 29 (3.83%) Cloud Native
5 24 (3.17%) Product Ownership
6 20 (2.64%) Algorithms
7 18 (2.37%) IoT
8 16 (2.11%) Onboarding
8 16 (2.11%) Virtual Team
9 15 (1.98%) Client/Server
10 12 (1.58%) Greenfield Project
10 12 (1.58%) Self-Motivation
11 11 (1.45%) Foreign Exchange (FX)
12 10 (1.32%) Public Cloud
13 9 (1.19%) Data Centre
14 8 (1.06%) Derivative
14 8 (1.06%) Enterprise Software
14 8 (1.06%) Equities
14 8 (1.06%) Security Operations Centre
15 7 (0.92%) Fixed Income
Operating Systems
1 329 (43.40%) Linux
2 270 (35.62%) Unix
3 82 (10.82%) Windows
4 8 (1.06%) Ubuntu
5 7 (0.92%) CentOS
5 7 (0.92%) Red Hat Enterprise Linux
6 6 (0.79%) Windows Server
7 4 (0.53%) Rocky
8 3 (0.40%) Android
8 3 (0.40%) Apple iOS
9 2 (0.26%) Debian
9 2 (0.26%) Mac OS
10 1 (0.13%) AIX
Processes & Methodologies
1 471 (62.14%) Agile
2 331 (43.67%) DevOps
3 283 (37.34%) Continuous Integration
4 281 (37.07%) Mentoring
5 259 (34.17%) Containerisation
6 244 (32.19%) Roadmaps
7 232 (30.61%) Performance Optimisation
8 228 (30.08%) High Availability
8 228 (30.08%) Product Management
9 226 (29.82%) Infrastructure as Code
10 216 (28.50%) Cost Optimisation
10 216 (28.50%) Task Automation
11 215 (28.36%) Budget Control
11 215 (28.36%) GitOps
11 215 (28.36%) Resource Management
12 166 (21.90%) CI/CD
13 141 (18.60%) Problem-Solving
14 115 (15.17%) Microservices
14 115 (15.17%) Software Engineering
15 104 (13.72%) Computer Science
Programming Languages
1 409 (53.96%) Python
2 358 (47.23%) Java
3 322 (42.48%) JavaScript
4 305 (40.24%) SQL
5 234 (30.87%) Bash
6 231 (30.47%) Go
7 125 (16.49%) C#
8 42 (5.54%) T-SQL
9 41 (5.41%) TypeScript
10 26 (3.43%) C++
11 23 (3.03%) PowerShell
12 22 (2.90%) PHP
13 18 (2.37%) Shell Script
14 17 (2.24%) R
15 14 (1.85%) PL/SQL
16 10 (1.32%) VB.NET
17 8 (1.06%) C
18 6 (0.79%) Data Analysis Expressions
18 6 (0.79%) Kotlin
18 6 (0.79%) Perl
Qualifications
1 221 (29.16%) AWS Certification
2 102 (13.46%) Degree
3 47 (6.20%) Security Cleared
4 40 (5.28%) Computer Science Degree
4 40 (5.28%) SC Cleared
5 31 (4.09%) BPSS Clearance
6 20 (2.64%) Master's Degree
7 9 (1.19%) DV Cleared
8 7 (0.92%) Azure Certification
8 7 (0.92%) Microsoft Certification
9 4 (0.53%) DBS Check
10 3 (0.40%) ISTQB
10 3 (0.40%) OCP
10 3 (0.40%) Oracle Certification
10 3 (0.40%) PhD
11 2 (0.26%) AWS Certified Developer
11 2 (0.26%) ISTQB Foundation Certification
11 2 (0.26%) Postgraduate
12 1 (0.13%) CISSP
12 1 (0.13%) Numerate Degree
Quality Assurance & Compliance
1 42 (5.54%) QA
2 32 (4.22%) Data Quality
3 19 (2.51%) GDPR
4 16 (2.11%) Accessibility
5 14 (1.85%) SLA
6 6 (0.79%) CDISC
7 5 (0.66%) HL7
8 2 (0.26%) Actionable Recommendations
8 2 (0.26%) ISO/IEC 27001
8 2 (0.26%) NCSC
8 2 (0.26%) PCI DSS
9 1 (0.13%) COBIT
9 1 (0.13%) HIPAA
System Software
1 323 (42.61%) Docker
2 9 (1.19%) VMware Infrastructure
3 6 (0.79%) Virtual Machines
4 5 (0.66%) Firmware
5 4 (0.53%) Virtual Servers
5 4 (0.53%) VMware ESXi
5 4 (0.53%) vSphere
Systems Management
1 315 (41.56%) Kubernetes
2 274 (36.15%) Ansible
3 243 (32.06%) Terraform
4 221 (29.16%) Argo
5 220 (29.02%) Prometheus
6 215 (28.36%) Kustomize
7 21 (2.77%) Kibana
8 10 (1.32%) Single Sign-On
9 9 (1.19%) Grafana
10 6 (0.79%) QRadar
11 5 (0.66%) ZABBIX
12 4 (0.53%) Progress Chef
13 3 (0.40%) Istio
14 1 (0.13%) Bugsnag
14 1 (0.13%) Microsoft Intune
14 1 (0.13%) Nagios
14 1 (0.13%) Puppet
Vendors
1 246 (32.45%) Google
2 92 (12.14%) Microsoft
3 64 (8.44%) Oracle
4 47 (6.20%) Atlassian
5 27 (3.56%) Databricks
6 25 (3.30%) Splunk
7 16 (2.11%) Dynatrace
8 15 (1.98%) SAP
8 15 (1.98%) ServiceNow
9 10 (1.32%) Adobe
9 10 (1.32%) MuleSoft
10 9 (1.19%) VMware
11 8 (1.06%) IBM
11 8 (1.06%) Salesforce
11 8 (1.06%) Sybase
11 8 (1.06%) TIBCO
12 7 (0.92%) Guidewire
12 7 (0.92%) Informatica
12 7 (0.92%) SolarWinds
13 6 (0.79%) Siemens