Strategic Thinking Jobs

Strategic Thinking
UK

The table below provides summary statistics for permanent job vacancies requiring Strategic Thinking skills. It includes a benchmarking guide to the annual salaries offered in vacancies that cited Strategic Thinking over the 6 months leading up to 31 May 2025, comparing them to the same period in the previous two years.

6 months to
31 May 2025
Same period 2024 Same period 2023
Rank 130 273 321
Rank change year-on-year +143 +48 0
Permanent jobs citing Strategic Thinking 1,310 1,060 1,005
As % of all permanent jobs advertised in the UK 2.35% 1.02% 1.05%
As % of the Processes & Methodologies category 2.51% 1.22% 1.10%
Number of salaries quoted 419 690 443
10th Percentile £42,500 £38,603 £46,250
25th Percentile £50,967 £48,750 £56,219
Median annual salary (50th Percentile) £65,000 £67,500 £70,000
Median % change year-on-year -3.70% -3.57% +7.69%
75th Percentile £88,125 £84,964 £89,472
90th Percentile £117,500 £109,100 £107,500
UK excluding London median annual salary £56,643 £64,108 £70,000
% change year-on-year -11.65% -8.42% +27.27%

All Process and Methodology Skills
UK

Strategic Thinking falls under the Processes and Methodologies category. For comparison with the information above, the following table provides summary statistics for all permanent job vacancies requiring process or methodology skills.

Permanent vacancies with a requirement for process or methodology skills 52,256 87,133 91,481
As % of all permanent jobs advertised in the UK 93.58% 84.04% 95.51%
Number of salaries quoted 25,854 60,896 54,581
10th Percentile £28,822 £29,250 £34,000
25th Percentile £41,250 £40,000 £45,000
Median annual salary (50th Percentile) £57,000 £55,000 £60,899
Median % change year-on-year +3.64% -9.69% +1.50%
75th Percentile £75,000 £72,500 £81,250
90th Percentile £97,500 £92,500 £100,000
UK excluding London median annual salary £51,564 £50,000 £55,000
% change year-on-year +3.13% -9.09% +4.76%

Strategic Thinking
Job Vacancy Trend

Job postings citing Strategic Thinking as a proportion of all IT jobs advertised.
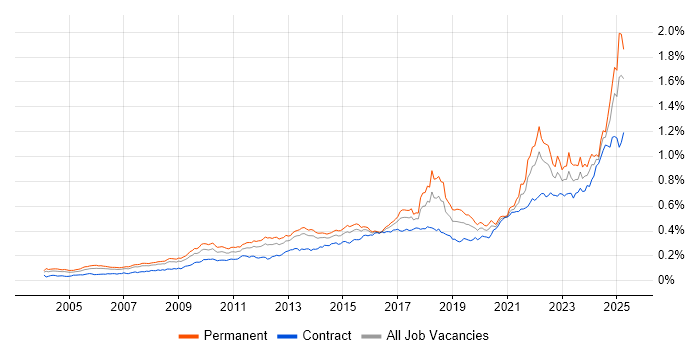
Job vacancy trend for Strategic Thinking in the UK

Strategic Thinking
Salary Trend

3-month moving average salary quoted in jobs citing Strategic Thinking.

Salary trend for Strategic Thinking in the UK

Strategic Thinking
Salary Histogram

Salary distribution for jobs citing Strategic Thinking over the 6 months to 31 May 2025.

Salary histogram for Strategic Thinking in the UK

Strategic Thinking
Top 18 Job Locations

The table below looks at the demand and provides a guide to the median salaries quoted in IT jobs citing Strategic Thinking within the UK over the 6 months to 31 May 2025. The 'Rank Change' column provides an indication of the change in demand within each location based on the same 6 month period last year.

Location Rank Change
on Same Period
Last Year
Matching
Permanent
IT Job Ads
Median Salary
Past 6 Months
Median Salary
% Change
on Same Period
Last Year
Live
Jobs
England +158 1,218 £65,000 -7.14% 1,551
UK excluding London +123 734 £56,643 -11.65% 634
Work from Home +167 653 £65,000 -11.93% 747
London +116 418 £80,000 -3.03% 1,029
South East +204 273 £54,500 +36.25% 134
North of England +32 164 £67,000 -9.22% 208
East of England +129 140 £50,967 +4.01% 45
North West +29 123 £70,000 -3.45% 138
Midlands +43 81 £60,000 +1.87% 97
West Midlands +34 48 £70,000 +10.58% 62
South West +34 44 £62,500 +4.17% 47
East Midlands +43 33 £57,500 +21.05% 34
Yorkshire +32 33 £53,638 -27.32% 50
Scotland +25 22 £83,738 +11.65% 60
North East +35 8 £105,000 +42.27% 22
Channel Islands - 5 £80,000 - 20
Wales +31 4 - - 16
Northern Ireland +33 1 - - 20

Strategic Thinking
Co-occurring Skills and Capabilities by Category

The follow tables expand on the table above by listing co-occurrences grouped by category. The same employment type, locality and period is covered with up to 20 co-occurrences shown in each of the following categories:

Application Platforms
1 13 (0.99%) CMS
2 12 (0.92%) WordPress
3 11 (0.84%) Microsoft Exchange
4 6 (0.46%) Confluence
4 6 (0.46%) Moodle
5 5 (0.38%) SharePoint
6 4 (0.31%) Headless CMS
6 4 (0.31%) IBM Domino
7 3 (0.23%) Apache Airflow
8 2 (0.15%) Apache
8 2 (0.15%) Drupal
9 1 (0.076%) IIS
9 1 (0.076%) nginx
9 1 (0.076%) SAS
9 1 (0.076%) Umbraco
Applications
1 40 (3.05%) Microsoft Excel
2 26 (1.98%) Microsoft Office
3 12 (0.92%) Chatbot
4 9 (0.69%) Maya
4 9 (0.69%) Microsoft Project
5 8 (0.61%) Microsoft PowerPoint
6 7 (0.53%) MS Visio
6 7 (0.53%) Trello
7 3 (0.23%) Adobe Creative Suite
7 3 (0.23%) Adobe Premiere
7 3 (0.23%) Final Cut Pro
7 3 (0.23%) UserZoom
8 2 (0.15%) Adobe Illustrator
8 2 (0.15%) Adobe XD
8 2 (0.15%) Photoshop
8 2 (0.15%) Sketch
Business Applications
1 16 (1.22%) OpenText VIM for SAP
1 16 (1.22%) SAP FI
2 12 (0.92%) NetSuite
3 8 (0.61%) Dynamics CRM
4 5 (0.38%) Salesforce CRM
5 4 (0.31%) Shopify
6 2 (0.15%) SAP S/4HANA
7 1 (0.076%) Lorenzo
7 1 (0.076%) Oracle ERP
7 1 (0.076%) SystmOne
Cloud Services
1 206 (15.73%) Azure
2 159 (12.14%) AWS
3 78 (5.95%) SaaS
4 54 (4.12%) Power Platform
5 38 (2.90%) GCP
6 33 (2.52%) Microsoft 365
7 31 (2.37%) Google Analytics
8 20 (1.53%) Cloud Computing
9 17 (1.30%) Figma
10 15 (1.15%) Azure Monitor
10 15 (1.15%) Vertex AI
11 14 (1.07%) Salsify
12 13 (0.99%) Azure Data Factory
12 13 (0.99%) GitHub
13 12 (0.92%) Azure DevOps
13 12 (0.92%) Azure Synapse Analytics
14 9 (0.69%) Boomi
15 8 (0.61%) Datadog
15 8 (0.61%) Dynamics 365
15 8 (0.61%) Serverless
Communications & Networking
1 215 (16.41%) Broadband
2 21 (1.60%) Firewall
3 12 (0.92%) LTE
4 11 (0.84%) 5G
4 11 (0.84%) Bluetooth
4 11 (0.84%) Wi-Fi
5 7 (0.53%) Intranet
5 7 (0.53%) SSH
6 6 (0.46%) EIGRP
6 6 (0.46%) OSPF
6 6 (0.46%) RIP
6 6 (0.46%) SNMP
6 6 (0.46%) Unified Communications
6 6 (0.46%) WAN
7 5 (0.38%) Internet
7 5 (0.38%) VoIP
8 3 (0.23%) DNS
8 3 (0.23%) Network Security
8 3 (0.23%) TCP/IP
8 3 (0.23%) VPN
Database & Business Intelligence
1 112 (8.55%) SQL Server
2 52 (3.97%) Big Data
3 50 (3.82%) Power BI
4 35 (2.67%) Tableau
5 30 (2.29%) Data Mining
6 20 (1.53%) Metadata
7 12 (0.92%) Relational Database
8 8 (0.61%) NoSQL
9 6 (0.46%) Looker
10 4 (0.31%) Data Warehouse
11 3 (0.23%) PostgreSQL
12 2 (0.15%) Amazon Aurora
12 2 (0.15%) Data Lake
12 2 (0.15%) DynamoDB
12 2 (0.15%) RDBMS
12 2 (0.15%) ThoughtSpot
13 1 (0.076%) Amazon RDS
13 1 (0.076%) Azure SQL Database
13 1 (0.076%) MongoDB
13 1 (0.076%) Power Query
Development Applications
1 327 (24.96%) JIRA
2 92 (7.02%) Selenium
3 91 (6.95%) Maven
4 90 (6.87%) Bitbucket
4 90 (6.87%) Cucumber
4 90 (6.87%) GitLab
4 90 (6.87%) SonarQube
4 90 (6.87%) Sonatype Nexus
5 12 (0.92%) Git
6 3 (0.23%) Jenkins
7 2 (0.15%) Postman
7 2 (0.15%) SQL Server Management Studio (SSMS)
7 2 (0.15%) TeamCity
7 2 (0.15%) Visual Website Optimizer
8 1 (0.076%) MSI
General
1 632 (48.24%) Social Skills
2 390 (29.77%) Analytical Skills
3 374 (28.55%) Finance
4 251 (19.16%) Marketing
5 199 (15.19%) Retail
6 171 (13.05%) Inclusion and Diversity
7 148 (11.30%) Influencing Skills
8 139 (10.61%) Law
9 137 (10.46%) Banking
10 104 (7.94%) Advertising
11 91 (6.95%) Corporate Banking
12 90 (6.87%) Investment Banking
13 62 (4.73%) Legal
14 45 (3.44%) Presentation Skills
15 33 (2.52%) Organisational Skills
16 29 (2.21%) Public Sector
17 25 (1.91%) Games
18 22 (1.68%) Electronics
19 20 (1.53%) Manufacturing
20 19 (1.45%) Financial Institution
Job Titles
1 215 (16.41%) Embedded Engineer
1 215 (16.41%) Release Engineer
2 203 (15.50%) Senior
3 156 (11.91%) Lead
4 148 (11.30%) Analyst
5 99 (7.56%) Senior Manager
6 97 (7.40%) Account Manager
7 92 (7.02%) Software Engineer
8 88 (6.72%) Business Change Analyst
8 88 (6.72%) Change Analyst
9 53 (4.05%) Architect
10 51 (3.89%) Senior Account Manager
11 47 (3.59%) Project Manager
12 36 (2.75%) Product Manager
13 34 (2.60%) Strategic Account Manager
14 25 (1.91%) Senior Analyst
14 25 (1.91%) Solutions Architect
15 24 (1.83%) Consultant
16 22 (1.68%) Developer
17 19 (1.45%) Financial Analyst
Libraries, Frameworks & Software Standards
1 232 (17.71%) Middleware
2 104 (7.94%) HTML
3 103 (7.86%) CSS
4 102 (7.79%) React
4 102 (7.79%) RESTful
5 97 (7.40%) Kafka
6 96 (7.33%) Spring
6 96 (7.33%) Spring Boot
7 94 (7.18%) REST
8 90 (6.87%) CSS3
8 90 (6.87%) HTML5
8 90 (6.87%) Jest
8 90 (6.87%) JPA
8 90 (6.87%) Redux
8 90 (6.87%) Sass
9 20 (1.53%) .NET
10 13 (0.99%) Hugging Face
10 13 (0.99%) LangChain
10 13 (0.99%) PyTorch
10 13 (0.99%) TensorFlow
Miscellaneous
1 215 (16.41%) Embedded Systems
2 170 (12.98%) Product Ownership
3 105 (8.02%) Enterprise Software
4 88 (6.72%) Marketing Technology
5 87 (6.64%) Digital Media
6 32 (2.44%) Algorithms
6 32 (2.44%) Cloud Native
6 32 (2.44%) Management Information System
7 31 (2.37%) Onboarding
8 28 (2.14%) IoT
8 28 (2.14%) Social Media
9 20 (1.53%) Cyberattack
9 20 (1.53%) Taxonomies
10 19 (1.45%) Self-Motivation
11 12 (0.92%) Analytical Mindset
11 12 (0.92%) NB-IoT
12 11 (0.84%) Blockchain
12 11 (0.84%) Data Centre
12 11 (0.84%) Virtual Team
13 10 (0.76%) Security Posture
Operating Systems
1 25 (1.91%) Windows
2 16 (1.22%) Linux
3 13 (0.99%) Windows Server
4 7 (0.53%) Android
4 7 (0.53%) Apple iOS
5 1 (0.076%) Amazon Linux
5 1 (0.076%) Debian
5 1 (0.076%) Red Hat Enterprise Linux
Processes & Methodologies
1 550 (41.98%) Agile
2 447 (34.12%) Artificial Intelligence
3 405 (30.92%) Problem-Solving
4 400 (30.53%) Roadmaps
5 336 (25.65%) CI/CD
6 300 (22.90%) Project Management
7 298 (22.75%) Continuous Improvement
8 238 (18.17%) Mentoring
9 226 (17.25%) Software Delivery
10 218 (16.64%) Continuous Deployment
11 215 (16.41%) Release Automation
12 201 (15.34%) Collaborative Working
13 183 (13.97%) Change Management
14 179 (13.66%) Stakeholder Engagement
15 172 (13.13%) Analytics
16 170 (12.98%) DevOps
17 159 (12.14%) Stakeholder Management
18 156 (11.91%) Decision-Making
19 146 (11.15%) User Experience
20 136 (10.38%) Use Case
Programming Languages
1 151 (11.53%) SQL
2 113 (8.63%) JavaScript
3 105 (8.02%) Java
4 92 (7.02%) TypeScript
5 64 (4.89%) Python
6 18 (1.37%) PowerShell
7 13 (0.99%) Bash
7 13 (0.99%) C#
8 9 (0.69%) R
9 4 (0.31%) Bicep
10 3 (0.23%) C++
11 2 (0.15%) Apex Code
11 2 (0.15%) Go
11 2 (0.15%) Rust
11 2 (0.15%) VB
12 1 (0.076%) C
12 1 (0.076%) PHP
Qualifications
1 143 (10.92%) Degree
2 89 (6.79%) CBAP
3 30 (2.29%) Security Cleared
4 28 (2.14%) Master's Degree
5 26 (1.98%) Computer Science Degree
6 22 (1.68%) DV Cleared
7 20 (1.53%) PMI Certification
8 19 (1.45%) PMP
9 13 (0.99%) CISSP
10 11 (0.84%) CISM
10 11 (0.84%) CompTIA Security+
10 11 (0.84%) Network+ Certification
11 10 (0.76%) DBS Check
12 8 (0.61%) ACCA
12 8 (0.61%) SC Cleared
13 7 (0.53%) AWS Certified Cloud Practitioner
13 7 (0.53%) CIMA
14 5 (0.38%) (ISC)2 CCSP
14 5 (0.38%) CCSP
14 5 (0.38%) Cisco Certification
Quality Assurance & Compliance
1 116 (8.85%) QA
2 111 (8.47%) Accessibility
3 30 (2.29%) GDPR
4 23 (1.76%) Data Quality
5 21 (1.60%) PMBOK
6 16 (1.22%) ISO/IEC 27001
7 14 (1.07%) NIST
8 11 (0.84%) Actionable Recommendations
8 11 (0.84%) PMO
9 7 (0.53%) PCI DSS
10 5 (0.38%) GxP
10 5 (0.38%) HIPAA
10 5 (0.38%) SOC 2
11 4 (0.31%) COBIT
12 3 (0.23%) Cyber Essentials
12 3 (0.23%) Cyber Essentials PLUS
13 2 (0.15%) Good Clinical Practice
14 1 (0.076%) GAAP
14 1 (0.076%) SLA
14 1 (0.076%) WCAG
System Software
1 104 (7.94%) Docker
2 12 (0.92%) VMware Infrastructure
3 11 (0.84%) vSphere
4 5 (0.38%) Active Directory
5 3 (0.23%) Hyper-V
6 1 (0.076%) Virtual Machines
6 1 (0.076%) Virtual Servers
Systems Management
1 108 (8.24%) Kubernetes
2 22 (1.68%) Terraform
3 15 (1.15%) Prometheus
4 13 (0.99%) Grafana
5 12 (0.92%) Ansible
6 11 (0.84%) Puppet
7 9 (0.69%) Single Sign-On
8 4 (0.31%) Matomo
9 3 (0.23%) Failover Clustering
10 2 (0.15%) Systems Management Server (SMS)
11 1 (0.076%) EMC NetWorker
Vendors
1 188 (14.35%) Microsoft
2 90 (6.87%) Solace
3 71 (5.42%) Google
4 35 (2.67%) SAP
5 34 (2.60%) Salesforce
6 29 (2.21%) OpenAI
7 20 (1.53%) Adobe
7 20 (1.53%) Databricks
8 17 (1.30%) TikTok
9 16 (1.22%) Cisco
10 15 (1.15%) VMware
11 12 (0.92%) Facebook
12 11 (0.84%) YouTube
13 9 (0.69%) Instagram
13 9 (0.69%) MuleSoft
14 8 (0.61%) Foundry
14 8 (0.61%) JD Edwards
14 8 (0.61%) ServiceNow
15 6 (0.46%) CheckPoint
15 6 (0.46%) SolarWinds