Analytics Jobs

Analytics
UK

The table below provides summary statistics for permanent job vacancies requiring Analytics skills. It includes a benchmarking guide to the annual salaries offered in vacancies that cited Analytics over the 6 months leading up to 8 June 2025, comparing them to the same period in the previous two years.

6 months to
8 Jun 2025
Same period 2024 Same period 2023
Rank 33 38 25
Rank change year-on-year +5 -13 -3
Permanent jobs citing Analytics 3,819 5,464 8,062
As % of all permanent jobs advertised in the UK 6.77% 5.06% 8.60%
As % of the Processes & Methodologies category 7.26% 6.10% 9.01%
Number of salaries quoted 1,730 3,358 4,236
10th Percentile £32,500 £32,500 £37,500
25th Percentile £45,750 £42,725 £48,750
Median annual salary (50th Percentile) £62,500 £60,000 £65,000
Median % change year-on-year +4.17% -7.69% -
75th Percentile £88,169 £81,250 £86,250
90th Percentile £115,000 £105,000 £112,500
UK excluding London median annual salary £54,441 £54,000 £55,000
% change year-on-year +0.82% -1.82% -

All Process and Methodology Skills
UK

Analytics falls under the Processes and Methodologies category. For comparison with the information above, the following table provides summary statistics for all permanent job vacancies requiring process or methodology skills.

Permanent vacancies with a requirement for process or methodology skills 52,589 89,609 89,464
As % of all permanent jobs advertised in the UK 93.19% 83.05% 95.46%
Number of salaries quoted 26,249 62,082 54,033
10th Percentile £28,500 £29,500 £33,950
25th Percentile £40,584 £40,000 £45,000
Median annual salary (50th Percentile) £56,000 £55,000 £60,800
Median % change year-on-year +1.82% -9.54% +1.33%
75th Percentile £74,445 £72,500 £81,250
90th Percentile £97,236 £92,500 £100,000
UK excluding London median annual salary £51,000 £50,000 £55,000
% change year-on-year +2.00% -9.09% +4.76%

Analytics
Job Vacancy Trend

Job postings citing Analytics as a proportion of all IT jobs advertised.
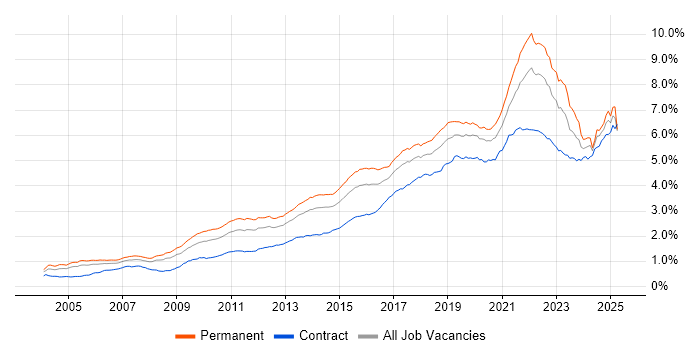
Job vacancy trend for Analytics in the UK

Analytics
Salary Trend

3-month moving average salary quoted in jobs citing Analytics.

Salary trend for Analytics in the UK

Analytics
Salary Histogram

Salary distribution for jobs citing Analytics over the 6 months to 8 June 2025.

Salary histogram for Analytics in the UK

Analytics
Top 19 Job Locations

The table below looks at the demand and provides a guide to the median salaries quoted in IT jobs citing Analytics within the UK over the 6 months to 8 June 2025. The 'Rank Change' column provides an indication of the change in demand within each location based on the same 6 month period last year.

Location Rank Change
on Same Period
Last Year
Matching
Permanent
IT Job Ads
Median Salary
Past 6 Months
Median Salary
% Change
on Same Period
Last Year
Live
Jobs
England +2 3,343 £65,000 +9.61% 7,331
UK excluding London +12 2,201 £54,441 +0.82% 4,131
London +1 1,398 £80,000 +6.67% 4,247
Work from Home -11 1,228 £60,000 +2.56% 4,000
South East +36 761 £60,000 +9.09% 1,882
North of England -41 467 £55,000 +10.00% 971
Midlands -9 328 £52,500 -4.55% 398
North West -52 325 £52,500 - 603
South West +36 258 £57,443 +4.44% 286
West Midlands 0 241 £55,000 - 193
Scotland +15 231 £52,000 -16.80% 258
Yorkshire -1 130 £57,500 +27.08% 240
East of England +22 123 £50,000 +5.26% 207
East Midlands -13 84 £47,500 -5.00% 190
Northern Ireland +21 25 £30,000 -65.71% 42
Wales +5 16 £42,500 -15.00% 92
North East -20 16 £51,000 +2.00% 130
Channel Islands -1 4 £78,750 +23.53% 72
Isle of Man +12 1 - - 3

Analytics
Co-occurring Skills and Capabilities by Category

The follow tables expand on the table above by listing co-occurrences grouped by category. The same employment type, locality and period is covered with up to 20 co-occurrences shown in each of the following categories:

Application Platforms
1 114 (2.99%) CMS
2 87 (2.28%) Apache Spark
3 75 (1.96%) Oracle Application Server
4 68 (1.78%) SharePoint
5 61 (1.60%) WordPress
6 53 (1.39%) Apache
7 51 (1.34%) SAS
8 34 (0.89%) Apache Airflow
9 19 (0.50%) Drupal
10 18 (0.47%) Confluence
11 16 (0.42%) Umbraco
12 10 (0.26%) IBM Domino
13 8 (0.21%) Microsoft Exchange
14 7 (0.18%) ArcGIS
15 6 (0.16%) Adobe Experience Manager
16 5 (0.13%) Headless CMS
16 5 (0.13%) IIS
17 4 (0.10%) Jupyter
17 4 (0.10%) Oracle Workflow
18 3 (0.079%) Luigi
Applications
1 349 (9.14%) Microsoft Excel
2 83 (2.17%) Microsoft Office
3 68 (1.78%) Microsoft PowerPoint
4 25 (0.65%) Photoshop
5 18 (0.47%) Maya
5 18 (0.47%) Microsoft Project
6 15 (0.39%) Adobe Premiere
7 13 (0.34%) Chatbot
7 13 (0.34%) Trello
8 11 (0.29%) Adobe XD
9 10 (0.26%) Adobe Illustrator
9 10 (0.26%) SPSS
10 7 (0.18%) Adobe Creative Suite
11 6 (0.16%) MS Visio
12 4 (0.10%) Oracle Smart View
13 3 (0.079%) Final Cut Pro
13 3 (0.079%) InDesign
13 3 (0.079%) Notion
14 2 (0.052%) Adobe After Effects
14 2 (0.052%) Spreadsheet
Business Applications
1 38 (1.00%) Shopify
2 28 (0.73%) Dynamics CRM
3 27 (0.71%) Aladdin
4 25 (0.65%) Dynamics AX
5 24 (0.63%) NetSuite
6 22 (0.58%) SAP S/4HANA
7 14 (0.37%) Oracle ERP
8 11 (0.29%) SAP IBP
9 10 (0.26%) Payment Gateway
10 9 (0.24%) Magento
11 8 (0.21%) IBM Planning Analytics
11 8 (0.21%) Salesforce CRM
12 7 (0.18%) SAP FI
13 6 (0.16%) Infor M3
14 5 (0.13%) Adaptiv
14 5 (0.13%) Relativity
14 5 (0.13%) SAP CO
14 5 (0.13%) SAP FI/CO
14 5 (0.13%) SAP FSCM
15 4 (0.10%) ResourceLink
Cloud Services
1 924 (24.19%) Azure
2 682 (17.86%) Power Platform
3 574 (15.03%) AWS
4 350 (9.16%) Google Analytics
5 292 (7.65%) GCP
6 187 (4.90%) Snowflake
7 171 (4.48%) SaaS
8 145 (3.80%) Azure Data Factory
9 131 (3.43%) Azure Synapse Analytics
10 113 (2.96%) Google Ads
11 106 (2.78%) Serverless
12 96 (2.51%) Azure DevOps
13 88 (2.30%) Power Automate
14 71 (1.86%) AWS Lambda
15 65 (1.70%) Amazon S3
16 60 (1.57%) Azure Monitor
16 60 (1.57%) Microsoft 365
17 59 (1.54%) PowerApps
18 57 (1.49%) Entra ID
19 55 (1.44%) dbt
Communications & Networking
1 42 (1.10%) Firewall
2 35 (0.92%) VPN
3 32 (0.84%) DNS
4 26 (0.68%) WAN
5 19 (0.50%) SD-WAN
6 18 (0.47%) Internet
7 9 (0.24%) SMS
8 8 (0.21%) SAN
9 7 (0.18%) HTTP
9 7 (0.18%) Network Security
9 7 (0.18%) TCP/IP
10 6 (0.16%) Intranet
10 6 (0.16%) Unified Communications
11 5 (0.13%) 5G
11 5 (0.13%) Intrusion Detection
11 5 (0.13%) Kerberos
11 5 (0.13%) NAS
11 5 (0.13%) Wi-Fi
12 4 (0.10%) 4G
12 4 (0.10%) LAN
Database & Business Intelligence
1 671 (17.57%) Power BI
2 388 (10.16%) Data Warehouse
3 365 (9.56%) Tableau
4 276 (7.23%) Data Lake
5 218 (5.71%) Big Data
6 133 (3.48%) SQL Server
7 102 (2.67%) Metadata
8 93 (2.44%) NoSQL
9 87 (2.28%) Oracle Reports
10 82 (2.15%) Enterprise Data Warehouse
11 71 (1.86%) Relational Database
12 67 (1.75%) SQL Server Integration Services
13 64 (1.68%) MySQL
13 64 (1.68%) SQL Server Reporting Services
14 63 (1.65%) BigQuery
15 60 (1.57%) Amazon Redshift
16 54 (1.41%) Looker
16 54 (1.41%) PostgreSQL
17 52 (1.36%) Hadoop
18 49 (1.28%) Azure SQL Database
Development Applications
1 160 (4.19%) Git
2 104 (2.72%) JIRA
3 65 (1.70%) Jenkins
4 36 (0.94%) GitLab
5 26 (0.68%) Eclipse
5 26 (0.68%) Eclipse RCP
6 23 (0.60%) SQL Server Management Studio (SSMS)
7 16 (0.42%) JUnit
8 15 (0.39%) Maven
9 13 (0.34%) CircleCI
9 13 (0.34%) Cucumber
9 13 (0.34%) IntelliJ
9 13 (0.34%) Mockito
10 12 (0.31%) Selenium
11 10 (0.26%) ERwin
12 9 (0.24%) Bazaar
13 8 (0.21%) Postman
14 7 (0.18%) Cypress.io
14 7 (0.18%) Subversion
14 7 (0.18%) Visual Studio
General
1 1,613 (42.24%) Social Skills
2 1,489 (38.99%) Finance
3 1,088 (28.49%) Analytical Skills
4 667 (17.47%) Marketing
5 590 (15.45%) Law
6 361 (9.45%) Retail
7 349 (9.14%) Banking
8 292 (7.65%) Inclusion and Diversity
9 187 (4.90%) Organisational Skills
10 163 (4.27%) Advertising
11 134 (3.51%) Manufacturing
12 133 (3.48%) Legal
13 126 (3.30%) Public Sector
14 125 (3.27%) Presentation Skills
15 123 (3.22%) Games
16 114 (2.99%) Influencing Skills
17 91 (2.38%) Telecoms
18 83 (2.17%) Front Office
18 83 (2.17%) Military
19 46 (1.20%) Pharmaceutical
Job Titles
1 667 (17.47%) Senior
2 600 (15.71%) Analyst
3 524 (13.72%) Lead
4 252 (6.60%) Data Analyst
5 242 (6.34%) Developer
6 232 (6.07%) Architect
7 226 (5.92%) Systems Manager
8 225 (5.89%) Data Engineer
9 215 (5.63%) Resource Manager
10 133 (3.48%) Software Engineer
11 128 (3.35%) Data Scientist
12 111 (2.91%) Data Manager
13 106 (2.78%) Senior Manager
14 93 (2.44%) Senior Analyst
15 84 (2.20%) Consultant
15 84 (2.20%) Solutions Architect
16 81 (2.12%) Product Manager
17 72 (1.89%) Data Architect
18 63 (1.65%) Business Analyst
19 62 (1.62%) Senior Data Scientist
Libraries, Frameworks & Software Standards
1 127 (3.33%) CSS
2 125 (3.27%) HTML
3 111 (2.91%) Kafka
4 105 (2.75%) React
5 76 (1.99%) PySpark
6 70 (1.83%) RESTful
7 63 (1.65%) Pandas
8 61 (1.60%) NumPy
9 56 (1.47%) Middleware
10 50 (1.31%) PyTorch
11 48 (1.26%) AngularJS
12 41 (1.07%) .NET
13 38 (1.00%) OAuth
14 37 (0.97%) TensorFlow
15 34 (0.89%) Node.js
15 34 (0.89%) Spring
15 34 (0.89%) Vue
16 31 (0.81%) REST
17 30 (0.79%) Redux
18 29 (0.76%) scikit-learn
Miscellaneous
1 211 (5.53%) Management Information System
2 209 (5.47%) Product Ownership
3 203 (5.32%) Algorithms
4 186 (4.87%) Social Media
5 120 (3.14%) Cloud Native
6 112 (2.93%) Analytical Mindset
7 100 (2.62%) Enterprise Software
8 83 (2.17%) Robotics
9 74 (1.94%) FMCG
10 67 (1.75%) Blockchain
11 66 (1.73%) Self-Motivation
12 61 (1.60%) Data Structures
13 50 (1.31%) Hedge funds
14 49 (1.28%) Fixed Income
14 49 (1.28%) Mobile App
15 41 (1.07%) Derivative
16 38 (1.00%) Blog
17 36 (0.94%) Credit Risk
17 36 (0.94%) Foreign Exchange (FX)
17 36 (0.94%) NHS
Operating Systems
1 89 (2.33%) Windows
2 73 (1.91%) Linux
3 31 (0.81%) Windows Server
4 12 (0.31%) Windows 10
5 10 (0.26%) Apple iOS
6 9 (0.24%) Android
7 8 (0.21%) Unix
8 6 (0.16%) Red Hat Enterprise Linux
8 6 (0.16%) Windows Server 2019
9 4 (0.10%) AIX
9 4 (0.10%) Windows Server 2016
10 3 (0.079%) VMS
11 2 (0.052%) Mac OS
12 1 (0.026%) Debian
12 1 (0.026%) zOS
Processes & Methodologies
1 926 (24.25%) Data Analytics
2 897 (23.49%) Agile
3 853 (22.34%) Business Intelligence
4 843 (22.07%) Artificial Intelligence
5 816 (21.37%) Problem-Solving
6 735 (19.25%) Data Management
7 671 (17.57%) Decision-Making
8 605 (15.84%) Data Science
9 589 (15.42%) Continuous Improvement
10 588 (15.40%) Visualisation
11 510 (13.35%) Data Modelling
12 491 (12.86%) Roadmaps
13 488 (12.78%) Machine Learning
14 439 (11.50%) DevOps
15 434 (11.36%) ERP
16 425 (11.13%) Stakeholder Management
17 422 (11.05%) Mentoring
18 418 (10.95%) Data Analysis
19 393 (10.29%) ETL
20 382 (10.00%) Data Engineering
Programming Languages
1 1,045 (27.36%) SQL
2 922 (24.14%) Python
3 224 (5.87%) Java
4 163 (4.27%) JavaScript
5 112 (2.93%) R
6 105 (2.75%) C#
7 92 (2.41%) PowerShell
8 67 (1.75%) Data Analysis Expressions
8 67 (1.75%) T-SQL
9 52 (1.36%) C++
10 48 (1.26%) Scala
10 48 (1.26%) TypeScript
11 33 (0.86%) Rust
12 32 (0.84%) Bicep
13 30 (0.79%) Bash
14 27 (0.71%) PHP
15 23 (0.60%) Ada
16 21 (0.55%) C
16 21 (0.55%) Go
17 17 (0.45%) VBA
Qualifications
1 1,068 (27.97%) Degree
2 238 (6.23%) Master's Degree
3 203 (5.32%) DBS Check
4 151 (3.95%) Security Cleared
5 111 (2.91%) Computer Science Degree
6 104 (2.72%) PhD
7 89 (2.33%) Azure Certification
8 86 (2.25%) SC Cleared
9 63 (1.65%) BPSS Clearance
10 49 (1.28%) Microsoft Certification
11 48 (1.26%) ACCA
11 48 (1.26%) DV Cleared
12 46 (1.20%) CISA
13 45 (1.18%) Numerate Degree
14 44 (1.15%) CIMA
15 41 (1.07%) AWS Certification
16 35 (0.92%) PMI Certification
17 27 (0.71%) MBA
17 27 (0.71%) PMP
18 23 (0.60%) ICAEW
Quality Assurance & Compliance
1 391 (10.24%) Data Quality
2 149 (3.90%) GDPR
3 146 (3.82%) Accessibility
4 100 (2.62%) QA
5 48 (1.26%) ITGC
6 45 (1.18%) Actionable Recommendations
7 33 (0.86%) California Consumer Privacy Act
8 26 (0.68%) ISO/IEC 27001
9 21 (0.55%) SLA
10 20 (0.52%) MiFID
11 19 (0.50%) Sarbanes-Oxley
12 18 (0.47%) EMIR
13 16 (0.42%) HIPAA
13 16 (0.42%) SOC 2
14 13 (0.34%) Cyber Essentials
14 13 (0.34%) IFRS
15 12 (0.31%) WCAG
16 11 (0.29%) NIST
16 11 (0.29%) PCI DSS
17 8 (0.21%) IFRS 9
System Software
1 111 (2.91%) Docker
2 37 (0.97%) Virtual Machines
3 31 (0.81%) Active Directory
4 20 (0.52%) VMware Infrastructure
5 10 (0.26%) Hyper-V
6 5 (0.13%) vSphere
7 4 (0.10%) HDFS
7 4 (0.10%) Virtual Desktop
8 3 (0.079%) VMware ESXi
9 1 (0.026%) BitLocker
9 1 (0.026%) Firmware
9 1 (0.026%) Job Entry Subsystem
9 1 (0.026%) Microsoft App-V
9 1 (0.026%) Time Sharing Option
9 1 (0.026%) Varnish
Systems Management
1 147 (3.85%) Terraform
2 145 (3.80%) Kubernetes
3 39 (1.02%) Ansible
4 37 (0.97%) Single Sign-On
5 32 (0.84%) Prometheus
6 24 (0.63%) Grafana
7 14 (0.37%) Microsoft Intune
8 5 (0.13%) QRadar
8 5 (0.13%) ZABBIX
9 4 (0.10%) FortiGate
9 4 (0.10%) Matomo
9 4 (0.10%) Puppet
10 3 (0.079%) SCCM
11 2 (0.052%) EnCase
11 2 (0.052%) Failover Clustering
11 2 (0.052%) FTK
11 2 (0.052%) Kubeflow
11 2 (0.052%) Nessus
11 2 (0.052%) RSA Security Analytics
11 2 (0.052%) SmoothWall
Vendors
1 676 (17.70%) Microsoft
2 542 (14.19%) Google
3 297 (7.78%) Databricks
4 199 (5.21%) SAP
5 196 (5.13%) Oracle
6 124 (3.25%) Salesforce
7 115 (3.01%) Adobe
8 77 (2.02%) Facebook
9 74 (1.94%) Alteryx
10 71 (1.86%) ServiceNow
11 58 (1.52%) Instagram
12 51 (1.34%) TikTok
13 44 (1.15%) Informatica
14 38 (1.00%) IBM
15 37 (0.97%) Ahrefs
16 34 (0.89%) VMware
17 31 (0.81%) OpenAI
18 27 (0.71%) MuleSoft
18 27 (0.71%) Pinterest
18 27 (0.71%) YouTube