Configuration Management Jobs

Configuration Management
UK

The table below provides summary statistics for permanent job vacancies requiring Configuration Management skills. It includes a benchmarking guide to the annual salaries offered in vacancies that cited Configuration Management over the 6 months leading up to 17 May 2025, comparing them to the same period in the previous two years.

6 months to
17 May 2025
Same period 2024 Same period 2023
Rank 275 263 249
Rank change year-on-year -12 -14 -37
Permanent jobs citing Configuration Management 649 1,093 1,455
As % of all permanent jobs advertised in the UK 1.16% 1.10% 1.46%
As % of the Processes & Methodologies category 1.24% 1.29% 1.53%
Number of salaries quoted 487 627 869
10th Percentile £44,600 £37,500 £41,214
25th Percentile £53,750 £46,199 £52,000
Median annual salary (50th Percentile) £60,000 £60,000 £68,500
Median % change year-on-year - -12.41% +9.60%
75th Percentile £73,000 £77,500 £85,000
90th Percentile £85,000 £87,500 £99,000
UK excluding London median annual salary £60,000 £54,250 £62,500
% change year-on-year +10.60% -13.20% +13.64%

All Process and Methodology Skills
UK

Configuration Management falls under the Processes and Methodologies category. For comparison with the information above, the following table provides summary statistics for all permanent job vacancies requiring process or methodology skills.

Permanent vacancies with a requirement for process or methodology skills 52,380 85,029 95,220
As % of all permanent jobs advertised in the UK 93.83% 85.31% 95.60%
Number of salaries quoted 26,622 59,821 55,996
10th Percentile £29,750 £29,079 £34,000
25th Percentile £41,375 £40,000 £45,000
Median annual salary (50th Percentile) £57,500 £55,000 £61,000
Median % change year-on-year +4.55% -9.84% +1.67%
75th Percentile £75,000 £72,500 £81,250
90th Percentile £97,500 £92,500 £100,000
UK excluding London median annual salary £51,810 £50,000 £55,000
% change year-on-year +3.62% -9.09% +4.76%

Configuration Management
Job Vacancy Trend

Job postings citing Configuration Management as a proportion of all IT jobs advertised.
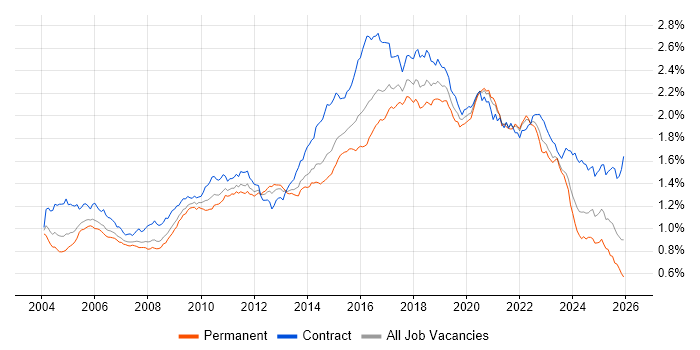
Job vacancy trend for Configuration Management in the UK

Configuration Management
Salary Trend

3-month moving average salary quoted in jobs citing Configuration Management.

Salary trend for Configuration Management in the UK

Configuration Management
Salary Histogram

Salary distribution for jobs citing Configuration Management over the 6 months to 17 May 2025.

Salary histogram for Configuration Management in the UK

Configuration Management
Top 16 Job Locations

The table below looks at the demand and provides a guide to the median salaries quoted in IT jobs citing Configuration Management within the UK over the 6 months to 17 May 2025. The 'Rank Change' column provides an indication of the change in demand within each location based on the same 6 month period last year.

Location Rank Change
on Same Period
Last Year
Matching
Permanent
IT Job Ads
Median Salary
Past 6 Months
Median Salary
% Change
on Same Period
Last Year
Live
Jobs
England -19 544 £64,627 +8.89% 508
UK excluding London +28 530 £60,000 +10.60% 362
South East +70 251 £65,000 +23.69% 110
Work from Home -99 109 £64,627 +1.83% 291
London +13 103 £80,000 +6.67% 181
North of England +20 86 £50,818 -3.20% 60
North West +12 76 £50,818 -9.66% 41
Scotland +85 55 £44,000 -41.33% 30
South West 0 50 £52,500 -4.55% 60
Midlands +6 39 £62,500 +11.11% 49
Wales +52 34 £65,000 +36.84% 5
West Midlands +14 32 £63,750 +10.87% 27
East of England -2 11 £53,750 -6.52% 49
Yorkshire +37 10 £72,500 +61.11% 17
East Midlands +6 7 £60,000 +20.00% 18
Northern Ireland +33 4 - - 8

Configuration Management
Co-occurring Skills and Capabilities by Category

The follow tables expand on the table above by listing co-occurrences grouped by category. The same employment type, locality and period is covered with up to 20 co-occurrences shown in each of the following categories:

Application Platforms
1 33 (5.08%) SharePoint
2 22 (3.39%) Confluence
3 15 (2.31%) IIS
4 10 (1.54%) nginx
5 8 (1.23%) Microsoft Exchange
6 4 (0.62%) Apache
6 4 (0.62%) Tomcat
7 1 (0.15%) CMS
7 1 (0.15%) JBoss
7 1 (0.15%) Jetty
7 1 (0.15%) OpenStack
7 1 (0.15%) Oracle Workflow
7 1 (0.15%) WebSphere
Applications
1 46 (7.09%) Windchill
2 35 (5.39%) Microsoft Office
3 5 (0.77%) Simulink
4 4 (0.62%) Mozilla Thunderbird
5 1 (0.15%) GNU Octave
5 1 (0.15%) Microsoft Excel
5 1 (0.15%) Microsoft PowerPoint
5 1 (0.15%) MS Visio
Business Applications
1 46 (7.09%) Teamcenter
2 5 (0.77%) Dynamics CRM
3 4 (0.62%) Remedy ITSM
4 3 (0.46%) Fidessa
Cloud Services
1 127 (19.57%) AWS
2 105 (16.18%) Azure
3 48 (7.40%) GCP
4 32 (4.93%) Amazon CloudWatch
5 29 (4.47%) Microsoft 365
6 28 (4.31%) SaaS
7 27 (4.16%) PaaS
8 26 (4.01%) IaaS
9 24 (3.70%) Amazon S3
10 23 (3.54%) Amazon EC2
10 23 (3.54%) AWS CloudFormation
11 22 (3.39%) Serverless
12 20 (3.08%) Virtual Private Cloud
13 19 (2.93%) GitHub
14 18 (2.77%) Azure DevOps
15 15 (2.31%) Amazon ECS
15 15 (2.31%) AWS Lambda
16 14 (2.16%) AWS KMS
17 13 (2.00%) Amazon ELB
18 12 (1.85%) Amazon Glacier
Communications & Networking
1 33 (5.08%) Firewall
2 25 (3.85%) DNS
3 17 (2.62%) VoIP
4 15 (2.31%) DHCP
5 13 (2.00%) WAN
6 12 (1.85%) MPLS
7 11 (1.69%) Cisco ISE
7 11 (1.69%) Ethernet
7 11 (1.69%) SAN
7 11 (1.69%) SD-WAN
8 9 (1.39%) VLAN
9 8 (1.23%) 5G
9 8 (1.23%) HTTP
9 8 (1.23%) VPN
10 7 (1.08%) Network Security
10 7 (1.08%) TCP/IP
11 6 (0.92%) NAS
11 6 (0.92%) SSH
11 6 (0.92%) VSAN
12 5 (0.77%) FTP
Database & Business Intelligence
1 29 (4.47%) SQL Server
2 23 (3.54%) Amazon RDS
3 18 (2.77%) PostgreSQL
4 14 (2.16%) NoSQL
5 13 (2.00%) MySQL
6 12 (1.85%) Relational Database
7 9 (1.39%) RDBMS
8 8 (1.23%) Power BI
9 7 (1.08%) OLTP
10 6 (0.92%) Elasticsearch
10 6 (0.92%) SQL Server Reporting Services
11 5 (0.77%) Data Lake
11 5 (0.77%) MariaDB
12 4 (0.62%) Azure SQL Database
12 4 (0.62%) DB2
13 3 (0.46%) MongoDB
14 2 (0.31%) Azure SQL Data Warehouse
14 2 (0.31%) DynamoDB
14 2 (0.31%) HDInsight
14 2 (0.31%) Redis
Development Applications
1 82 (12.63%) Rational DOORS
2 61 (9.40%) JIRA
3 44 (6.78%) Git
4 42 (6.47%) Jenkins
5 25 (3.85%) GitLab
6 18 (2.77%) Bitbucket
7 17 (2.62%) Atlassian Bamboo
8 15 (2.31%) Vagrant
9 13 (2.00%) Visual Studio
10 9 (1.39%) CircleCI
11 8 (1.23%) Sonatype Nexus
12 7 (1.08%) Subversion
13 5 (0.77%) Artifactory
14 3 (0.46%) Bitbucket Server
14 3 (0.46%) JUnit
14 3 (0.46%) Team Foundation Server
14 3 (0.46%) TeamCity
15 2 (0.31%) Selenium
16 1 (0.15%) FitNesse
16 1 (0.15%) Maven
General
1 173 (26.66%) Social Skills
2 62 (9.55%) Finance
3 43 (6.63%) Analytical Skills
4 35 (5.39%) Manufacturing
5 28 (4.31%) Public Sector
6 25 (3.85%) Banking
7 20 (3.08%) Marketing
8 17 (2.62%) Electronics
9 15 (2.31%) Telecoms
10 13 (2.00%) Inclusion and Diversity
11 11 (1.69%) Retail
12 10 (1.54%) Documentation Skills
13 9 (1.39%) Aerospace
14 7 (1.08%) Advertising
14 7 (1.08%) Organisational Skills
14 7 (1.08%) Presentation Skills
14 7 (1.08%) Private Banking
15 6 (0.92%) Legal
16 5 (0.77%) Financial Institution
16 5 (0.77%) Military
Job Titles
1 213 (32.82%) Senior
2 129 (19.88%) Architect
3 96 (14.79%) Software Engineer
4 56 (8.63%) Systems Architect
5 54 (8.32%) Senior Software Engineer
6 51 (7.86%) Test Engineer
7 50 (7.70%) Senior Software Test Engineer
7 50 (7.70%) Senior Test Engineer
7 50 (7.70%) Software Test Engineer
8 49 (7.55%) Lead
9 42 (6.47%) Software Architect
10 39 (6.01%) DevOps Engineer
11 34 (5.24%) Principal Engineer
12 31 (4.78%) Analyst
12 31 (4.78%) Principal Software Engineer
13 29 (4.47%) Developer
14 23 (3.54%) Cloud Engineer
15 22 (3.39%) Configuration Manager
15 22 (3.39%) Infrastructure Engineer
15 22 (3.39%) Project Manager
Libraries, Frameworks & Software Standards
1 57 (8.78%) Middleware
2 22 (3.39%) .NET
3 16 (2.47%) REST
4 15 (2.31%) Elastic Stack
5 14 (2.16%) JSON
6 13 (2.00%) HTML
7 10 (1.54%) ARM Templates
7 10 (1.54%) AWS CDK
8 8 (1.23%) FastAPI
8 8 (1.23%) RESTful
9 7 (1.08%) Flask
9 7 (1.08%) Web Services
10 6 (0.92%) CSS
10 6 (0.92%) Node.js
11 5 (0.77%) Ajax
11 5 (0.77%) LDAP
12 4 (0.62%) Kafka
12 4 (0.62%) Ruby on Rails
12 4 (0.62%) SOAP
13 3 (0.46%) LEMP Stack
Miscellaneous
1 96 (14.79%) Management Information System
2 34 (5.24%) CMDB
3 26 (4.01%) Public Cloud
4 15 (2.31%) Hybrid Cloud
5 13 (2.00%) Client/Server
5 13 (2.00%) Private Cloud
6 12 (1.85%) Replication
7 11 (1.69%) Clustering
7 11 (1.69%) Self-Motivation
8 10 (1.54%) Data Centre
9 8 (1.23%) GNSS
9 8 (1.23%) Self-Driving Car
10 6 (0.92%) Cloud Native
11 4 (0.62%) Onboarding
11 4 (0.62%) Virtual Team
12 3 (0.46%) Algorithms
12 3 (0.46%) Cyber Threat
12 3 (0.46%) Data Structures
12 3 (0.46%) Eurex
12 3 (0.46%) IoT
Operating Systems
1 89 (13.71%) Linux
2 56 (8.63%) Windows
3 22 (3.39%) Red Hat Enterprise Linux
4 21 (3.24%) Windows Server
5 16 (2.47%) Unix
6 15 (2.31%) VMS
7 10 (1.54%) CentOS
8 8 (1.23%) Ubuntu
9 6 (0.92%) Amazon Linux
9 6 (0.92%) Android
10 5 (0.77%) Debian
11 4 (0.62%) Windows 10
12 3 (0.46%) Rocky
13 2 (0.31%) Apple iOS
13 2 (0.31%) Windows Server 2012
13 2 (0.31%) Windows Server 2016
13 2 (0.31%) Windows Server 2019
14 1 (0.15%) FreeRTOS
14 1 (0.15%) Mac OS
14 1 (0.15%) VxWorks
Processes & Methodologies
1 241 (37.13%) Agile
2 184 (28.35%) Computer Science
3 172 (26.50%) DevOps
4 165 (25.42%) Waterfall
5 164 (25.27%) UML
6 127 (19.57%) Mentoring
7 116 (17.87%) Software Engineering
8 103 (15.87%) CI/CD
9 94 (14.48%) Test Automation
10 83 (12.79%) Systems Engineering
11 82 (12.63%) Continuous Improvement
12 76 (11.71%) Requirements Management
13 73 (11.25%) Infrastructure as Code
14 72 (11.09%) Customer Requirements
15 68 (10.48%) Validation
16 67 (10.32%) ITIL
16 67 (10.32%) SDLC
16 67 (10.32%) Software Testing
17 64 (9.86%) Design Patterns
18 59 (9.09%) Problem-Solving
Programming Languages
1 107 (16.49%) Python
2 93 (14.33%) Ada
3 57 (8.78%) Bash
4 56 (8.63%) Java
5 50 (7.70%) PowerShell
6 40 (6.16%) SQL
7 31 (4.78%) C
8 30 (4.62%) C#
9 28 (4.31%) Ada 95
10 25 (3.85%) JavaScript
11 17 (2.62%) C++
11 17 (2.62%) Perl
11 17 (2.62%) VB
12 16 (2.47%) Groovy
13 12 (1.85%) Ruby
14 11 (1.69%) Go
15 9 (1.39%) TypeScript
16 7 (1.08%) Bicep
16 7 (1.08%) PL/SQL
16 7 (1.08%) R
Qualifications
1 353 (54.39%) Degree
2 297 (45.76%) BPSS Clearance
3 165 (25.42%) Chartered Engineer
4 59 (9.09%) Computer Science Degree
5 51 (7.86%) Security Cleared
6 36 (5.55%) SC Cleared
7 22 (3.39%) DV Cleared
8 20 (3.08%) AWS Certification
9 18 (2.77%) ITIL Certification
10 16 (2.47%) Azure Certification
11 7 (1.08%) HNC
11 7 (1.08%) HND
12 6 (0.92%) Cisco Certification
12 6 (0.92%) ITIL Foundation Certificate
12 6 (0.92%) Microsoft Certification
12 6 (0.92%) VMware Certified Professional (VCP)
13 3 (0.46%) AWS Certified DevOps Engineer
13 3 (0.46%) MCSA
14 2 (0.31%) CISSP
14 2 (0.31%) PMP
Quality Assurance & Compliance
1 155 (23.88%) ISO/IEC 12207
2 56 (8.63%) ISO/IEC 15288
3 40 (6.16%) QA
4 35 (5.39%) SLA
5 8 (1.23%) ISO/IEC 27001
5 8 (1.23%) PMO
6 5 (0.77%) Accessibility
7 4 (0.62%) GDPR
8 2 (0.31%) Cyber Essentials
8 2 (0.31%) NIST
8 2 (0.31%) PCI DSS
9 1 (0.15%) COBIT
9 1 (0.15%) DO-254
9 1 (0.15%) GRC
9 1 (0.15%) ISO 9001
9 1 (0.15%) NCSC
9 1 (0.15%) SOC 2
System Software
1 67 (10.32%) Docker
2 35 (5.39%) Active Directory
2 35 (5.39%) VMware Infrastructure
3 10 (1.54%) Hyper-V
4 7 (1.08%) DFS Replication
5 6 (0.92%) VMware ESXi
5 6 (0.92%) vSphere
6 5 (0.77%) Virtual Machines
7 4 (0.62%) Firmware
8 3 (0.46%) Postfix
8 3 (0.46%) Virtual Desktop
8 3 (0.46%) Virtual Servers
9 2 (0.31%) Embedded Firmware
9 2 (0.31%) KVM
9 2 (0.31%) Xen
10 1 (0.15%) Dovecot
10 1 (0.15%) HDFS
10 1 (0.15%) NDS
10 1 (0.15%) NFS
10 1 (0.15%) Squid
Systems Management
1 97 (14.95%) Ansible
2 93 (14.33%) Terraform
3 73 (11.25%) Kubernetes
4 43 (6.63%) Puppet
5 34 (5.24%) Grafana
6 30 (4.62%) Prometheus
7 27 (4.16%) Progress Chef
8 13 (2.00%) Nagios
9 9 (1.39%) Microsoft Intune
10 7 (1.08%) Argo
10 7 (1.08%) Proxmox
10 7 (1.08%) vRealize
11 6 (0.92%) PowerCLI
11 6 (0.92%) vCenter Server
11 6 (0.92%) vMotion
12 5 (0.77%) Consul
12 5 (0.77%) SCCM
13 4 (0.62%) Nessus
13 4 (0.62%) ZABBIX
14 3 (0.46%) SCOM
Vendors
1 82 (12.63%) Microsoft
2 63 (9.71%) IBM
3 45 (6.93%) VMware
4 37 (5.70%) ServiceNow
5 30 (4.62%) SAP
6 28 (4.31%) Red Hat
7 27 (4.16%) Oracle
8 26 (4.01%) Cisco
9 21 (3.24%) Juniper
10 19 (2.93%) Google
11 16 (2.47%) Siemens
12 11 (1.69%) SevOne
12 11 (1.69%) Splunk
13 9 (1.39%) HP
13 9 (1.39%) Veeam
14 8 (1.23%) Citrix
15 7 (1.08%) Avaloq
16 5 (0.77%) Intel
16 5 (0.77%) Sybase
17 4 (0.62%) EMC