Support Engineer
UK

The median Support Engineer salary in the UK is £32,500 per year according to job vacancies posted during the 6 months to 3 May 2024.

The first table below provides salary benchmarking and summary statistics including a comparison to same period in the previous 2 years.

6 months to
3 May 2024
Same period 2023 Same period 2022
Rank 97 153 251
Rank change year-on-year +56 +98 -78
Permanent jobs requiring a Support Engineer 2,697 2,419 2,516
As % of all permanent jobs advertised in the UK 2.73% 2.33% 1.61%
As % of the Job Titles category 2.89% 2.55% 1.67%
Number of salaries quoted 2,381 1,935 2,210
10th Percentile £24,000 £25,250 £24,000
25th Percentile £26,750 £28,000 £27,125
Median annual salary (50th Percentile) £32,500 £33,740 £33,196
Median % change year-on-year -3.68% +1.64% -2.36%
75th Percentile £42,500 £40,500 £43,750
90th Percentile £51,750 £51,050 £57,500
UK excluding London median annual salary £32,000 £32,000 £31,500
% change year-on-year - +1.59% -

All Permanent IT Job Vacancies
UK

The following table is for comparison with the above and includes summary statistics for all permanent IT job vacancies. Most job vacancies include a discernible job title that can be normalized. As such, the figures in the second row provide an indication of the number of permanent jobs in our overall sample.

Permanent vacancies in the UK with a recognized job title 93,314 94,990 150,394
% of permanent jobs with a recognized job title 94.62% 91.53% 96.09%
Number of salaries quoted 66,914 59,752 85,367
10th Percentile £28,500 £32,500 £32,500
25th Percentile £38,500 £45,000 £42,500
Median annual salary (50th Percentile) £52,508 £60,000 £60,000
Median % change year-on-year -12.49% - +9.09%
75th Percentile £71,250 £81,250 £78,750
90th Percentile £90,000 £100,000 £96,250
UK excluding London median annual salary £50,000 £53,000 £50,000
% change year-on-year -5.66% +6.00% +5.26%

Support Engineer
Job Vacancy Trend

Job postings that featured Support Engineer in the job title as a proportion of all IT jobs advertised.
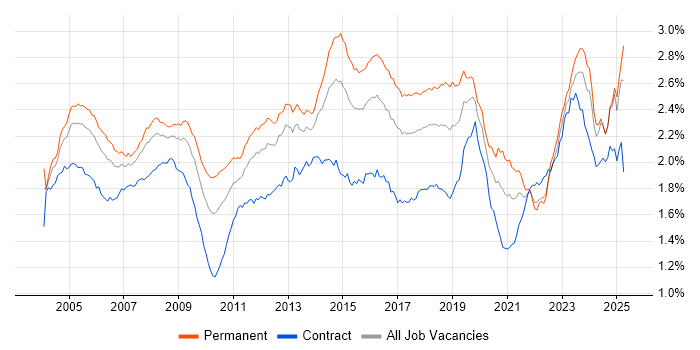
Job vacancy trend for Support Engineer in the UK

Support Engineer
Salary Trend

3-month moving average salary quoted in jobs citing Support Engineer.

Salary trend for Support Engineer in the UK

Support Engineer
Salary Histogram

Salary distribution for jobs citing Support Engineer over the 6 months to 3 May 2024.

Salary histogram for Support Engineer in the UK

Support Engineer
Top 18 Job Locations

The table below looks at the demand and provides a guide to the median salaries quoted in IT jobs citing Support Engineer within the UK over the 6 months to 3 May 2024. The 'Rank Change' column provides an indication of the change in demand within each location based on the same 6 month period last year.

Location Rank Change
on Same Period
Last Year
Matching
Permanent
IT Job Ads
Median Salary
Past 6 Months
Median Salary
% Change
on Same Period
Last Year
Live
Jobs
England +61 2,471 £32,500 -2.99% 625
UK excluding London +45 2,252 £32,000 - 536
South East +26 667 £34,000 +7.94% 138
Work from Home +23 613 £35,000 - 167
London +16 406 £40,000 +5.26% 125
Midlands +70 405 £30,000 - 103
North of England +42 403 £30,000 -4.17% 109
South West +17 367 £33,000 +1.54% 92
West Midlands +76 228 £30,000 -7.69% 54
East of England +32 219 £31,000 -3.88% 62
Yorkshire +68 174 £32,500 +5.69% 32
North West +2 173 £28,000 -8.77% 68
East Midlands +34 172 £30,000 +7.14% 49
Scotland -48 89 £28,000 -15.15% 28
Wales +42 59 £27,895 -12.83% 13
North East +32 56 £32,500 -5.80% 11
Northern Ireland +31 34 £35,000 - 9
Isle of Man - 12 £43,750 -

Support Engineer Skill Set
Top 30 Co-occurring Skills and Capabilities

For the 6 months to 3 May 2024, Support Engineer job roles required the following skills and capabilities in order of popularity. The figures indicate the absolute number co-occurrences and as a proportion of all permanent job ads featuring Support Engineer in the job title.

1 1,424 (52.80%) Windows
2 1,221 (45.27%) Microsoft
3 1,175 (43.57%) Microsoft 365
4 1,051 (38.97%) Active Directory
5 826 (30.63%) Social Skills
6 813 (30.14%) Azure
7 626 (23.21%) Windows Server
8 571 (21.17%) Customer Service
9 539 (19.99%) Problem-Solving
10 478 (17.72%) Firewall
11 464 (17.20%) VMware
12 436 (16.17%) Microsoft Exchange
13 427 (15.83%) Windows 10
14 412 (15.28%) ITIL
15 395 (14.65%) Microsoft Office
16 356 (13.20%) Degree
17 335 (12.42%) SharePoint
18 327 (12.12%) VMware Infrastructure
19 326 (12.09%) Finance
20 318 (11.79%) SQL
21 307 (11.38%) Hyper-V
22 304 (11.27%) Microsoft Intune
23 303 (11.23%) Entra ID
24 302 (11.20%) Linux
25 265 (9.83%) DNS
26 244 (9.05%) Cisco
27 225 (8.34%) Driving Licence
28 220 (8.16%) SQL Server
29 215 (7.97%) SLA
30 206 (7.64%) Analytical Skills

Support Engineer Skill Set
Co-occurring Skills and Capabilities by Category

The follow tables expand on the table above by listing co-occurrences grouped by category. The same employment type, locality and period is covered with up to 20 co-occurrences shown in each of the following categories:

Application Platforms
1 436 (16.17%) Microsoft Exchange
2 335 (12.42%) SharePoint
3 34 (1.26%) Confluence
4 32 (1.19%) IIS
5 28 (1.04%) Skype for Business
6 26 (0.96%) Exchange Server 2013
7 24 (0.89%) Apache
8 22 (0.82%) Exchange Server 2010
9 14 (0.52%) Exchange Server 2007
10 13 (0.48%) Tomcat
11 11 (0.41%) CMS
12 9 (0.33%) SharePoint 2010
12 9 (0.33%) SharePoint 2013
12 9 (0.33%) WebSphere
13 6 (0.22%) Exchange Server 2000
13 6 (0.22%) WordPress
14 4 (0.15%) JBoss
14 4 (0.15%) Jupyter
14 4 (0.15%) SAS
15 2 (0.074%) Exchange Server 2003
Applications
1 395 (14.65%) Microsoft Office
2 99 (3.67%) Microsoft Excel
3 42 (1.56%) Microsoft PowerPoint
4 8 (0.30%) Spreadsheet
5 4 (0.15%) Microsoft Project
6 3 (0.11%) AutoCAD
6 3 (0.11%) InfoPath
6 3 (0.11%) SPSS
6 3 (0.11%) Trello
7 2 (0.074%) Revit
8 1 (0.037%) MS Visio
Business Applications
1 8 (0.30%) Dynamics CRM
2 5 (0.19%) Sage X3
3 4 (0.15%) Salesforce CRM
4 3 (0.11%) Eikon
5 2 (0.074%) Oracle Receivables
5 2 (0.074%) Remedy ITSM
6 1 (0.037%) Carpe Diem
6 1 (0.037%) Dynamics AX
6 1 (0.037%) Dynamics NAV
6 1 (0.037%) Elite 3E
6 1 (0.037%) Endur
6 1 (0.037%) Findur
6 1 (0.037%) JDE EnterpriseOne
6 1 (0.037%) Payment Gateway
6 1 (0.037%) SAP ERP
Cloud Services
1 1,175 (43.57%) Microsoft 365
2 813 (30.14%) Azure
3 303 (11.23%) Entra ID
4 143 (5.30%) AWS
5 131 (4.86%) OneDrive
6 57 (2.11%) GCP
7 56 (2.08%) SaaS
8 44 (1.63%) Mimecast
9 33 (1.22%) Power Platform
10 32 (1.19%) IaaS
11 31 (1.15%) Google Workspace
12 28 (1.04%) Dynamics 365
13 24 (0.89%) WhatsApp
14 21 (0.78%) PaaS
15 17 (0.63%) OpenShift
16 11 (0.41%) Azure Sentinel
17 10 (0.37%) Power Automate
18 9 (0.33%) Azure DevOps
18 9 (0.33%) Azure Monitor
18 9 (0.33%) PowerApps
Communications & Networking
1 478 (17.72%) Firewall
2 265 (9.83%) DNS
3 199 (7.38%) DHCP
4 186 (6.90%) WAN
5 178 (6.60%) Wi-Fi
6 174 (6.45%) LAN
7 173 (6.41%) TCP/IP
8 163 (6.04%) VPN
9 145 (5.38%) Wireless
10 133 (4.93%) VoIP
11 123 (4.56%) VLAN
12 118 (4.38%) SAN
13 77 (2.86%) Remote Desktop
14 68 (2.52%) Internet
15 53 (1.97%) Network Security
16 37 (1.37%) PBX
17 33 (1.22%) Cisco IOS
17 33 (1.22%) Skype
18 25 (0.93%) Ethernet
18 25 (0.93%) NAS
Database & Business Intelligence
1 220 (8.16%) SQL Server
2 78 (2.89%) MySQL
3 58 (2.15%) Amazon RDS
4 41 (1.52%) PostgreSQL
5 30 (1.11%) MongoDB
6 20 (0.74%) Relational Database
7 13 (0.48%) Power BI
8 10 (0.37%) DB2
8 10 (0.37%) MariaDB
9 6 (0.22%) SQL Server Analysis Services
9 6 (0.22%) SQL Server Reporting Services
10 5 (0.19%) Azure SQL Database
10 5 (0.19%) Pentaho
11 4 (0.15%) GIS
11 4 (0.15%) Metabase
11 4 (0.15%) Oracle Database
11 4 (0.15%) SQL Server Integration Services
12 3 (0.11%) Big Data
12 3 (0.11%) Data Lake
12 3 (0.11%) EDRMS
Development Applications
1 83 (3.08%) JIRA
2 23 (0.85%) Bitbucket
3 17 (0.63%) IBM UrbanCode
3 17 (0.63%) Jenkins
4 14 (0.52%) Eclipse
5 10 (0.37%) Git
6 9 (0.33%) Visual Studio
7 4 (0.15%) GitLab
7 4 (0.15%) Visual Studio Code
8 3 (0.11%) MSI
8 3 (0.11%) Octopus Deploy
8 3 (0.11%) TeamCity
9 2 (0.074%) HP UFT
9 2 (0.074%) Hudson
9 2 (0.074%) IntelliJ
9 2 (0.074%) JMeter
9 2 (0.074%) LoadRunner
9 2 (0.074%) MSTest
9 2 (0.074%) Selenium
9 2 (0.074%) Team Foundation Server
General
1 826 (30.63%) Social Skills
2 326 (12.09%) Finance
3 206 (7.64%) Analytical Skills
4 175 (6.49%) Telecoms
5 142 (5.27%) Organisational Skills
6 132 (4.89%) Manufacturing
7 94 (3.49%) Law
8 62 (2.30%) Inclusion and Diversity
9 57 (2.11%) Banking
10 56 (2.08%) Documentation Skills
10 56 (2.08%) Retail
11 54 (2.00%) Public Sector
12 51 (1.89%) Marketing
13 49 (1.82%) Electronics
14 48 (1.78%) Legal
15 40 (1.48%) Automotive
16 33 (1.22%) Pharmaceutical
17 24 (0.89%) Military
18 22 (0.82%) Games
18 22 (0.82%) Presentation Skills
Libraries, Frameworks & Software Standards
1 55 (2.04%) .NET
2 50 (1.85%) REST
3 47 (1.74%) Web Services
4 42 (1.56%) SOAP
5 34 (1.26%) CSS
6 30 (1.11%) HTML
7 25 (0.93%) XML
8 13 (0.48%) Ajax
8 13 (0.48%) AngularJS
8 13 (0.48%) JDBC
8 13 (0.48%) ODBC
8 13 (0.48%) XHTML
9 12 (0.44%) JSON
10 11 (0.41%) Kafka
11 9 (0.33%) .NET Framework
11 9 (0.33%) LAPP Stack
11 9 (0.33%) LDAP
12 8 (0.30%) ADSI
12 8 (0.30%) ASP.NET
13 7 (0.26%) XSLT
Miscellaneous
1 225 (8.34%) Driving Licence
2 87 (3.23%) Self-Motivation
3 59 (2.19%) Management Information System
3 59 (2.19%) Onboarding
4 58 (2.15%) Replication
5 54 (2.00%) Data Centre
6 48 (1.78%) Video Conferencing
7 47 (1.74%) Clustering
8 36 (1.33%) Public Cloud
8 36 (1.33%) Smartphone
9 33 (1.22%) Fat Client
9 33 (1.22%) Thin Client
10 31 (1.15%) CCTV
10 31 (1.15%) EPoS
11 30 (1.11%) Enterprise Storage
12 28 (1.04%) Enterprise Software
13 21 (0.78%) iPad
13 21 (0.78%) iPhone
14 20 (0.74%) Client/Server
15 17 (0.63%) Foreign Exchange (FX)
Operating Systems
1 1,424 (52.80%) Windows
2 626 (23.21%) Windows Server
3 427 (15.83%) Windows 10
4 302 (11.20%) Linux
5 150 (5.56%) Mac OS
6 132 (4.89%) Windows Server 2012
7 96 (3.56%) Windows Server 2016
8 89 (3.30%) Windows 7
9 82 (3.04%) Windows Server 2019
10 79 (2.93%) Android
11 71 (2.63%) Apple iOS
12 44 (1.63%) Unix
12 44 (1.63%) Windows Server 2008
13 35 (1.30%) AIX
14 26 (0.96%) Mac OS X
15 24 (0.89%) CentOS
16 21 (0.78%) Windows 8
17 18 (0.67%) Ubuntu
18 11 (0.41%) VMS
19 9 (0.33%) Debian
Processes & Methodologies
1 571 (21.17%) Customer Service
2 539 (19.99%) Problem-Solving
3 412 (15.28%) ITIL
4 191 (7.08%) Infrastructure Engineering
5 113 (4.19%) Mentoring
6 111 (4.12%) Incident Management
7 109 (4.04%) Cybersecurity
7 109 (4.04%) Service Delivery
8 101 (3.74%) Continuous Improvement
8 101 (3.74%) Service Management
9 99 (3.67%) Customer Experience
10 94 (3.49%) Agile
11 86 (3.19%) Time Management
12 83 (3.08%) Customer Requirements
13 82 (3.04%) Computer Science
14 69 (2.56%) Asset Management
15 68 (2.52%) ITSM
16 67 (2.48%) Change Management
16 67 (2.48%) Migration
16 67 (2.48%) Problem Management
Programming Languages
1 318 (11.79%) SQL
2 201 (7.45%) PowerShell
3 83 (3.08%) Python
4 74 (2.74%) C#
5 72 (2.67%) Java
6 48 (1.78%) Bash
7 39 (1.45%) VB
8 34 (1.26%) JavaScript
9 32 (1.19%) C++
10 28 (1.04%) C
11 17 (0.63%) Groovy
11 17 (0.63%) PL/SQL
12 16 (0.59%) T-SQL
13 14 (0.52%) Perl
14 10 (0.37%) ActionScript
14 10 (0.37%) Shell Script
15 9 (0.33%) PHP
16 7 (0.26%) XPath
17 5 (0.19%) VBA
18 4 (0.15%) VBScript
Qualifications
1 356 (13.20%) Degree
2 192 (7.12%) Microsoft Certification
3 183 (6.79%) Security Cleared
4 118 (4.38%) Cisco Certification
5 114 (4.23%) CCNA
6 90 (3.34%) SC Cleared
7 73 (2.71%) DBS Check
8 67 (2.48%) Computer Science Degree
9 54 (2.00%) A+ Certification
10 53 (1.97%) Azure Certification
11 49 (1.82%) DV Cleared
11 49 (1.82%) Network+ Certification
12 48 (1.78%) ITIL Certification
12 48 (1.78%) MCP
13 36 (1.33%) MCSE
14 34 (1.26%) HNC
14 34 (1.26%) ITIL Foundation Certificate
15 29 (1.08%) Master's Degree
16 23 (0.85%) MCITP
17 22 (0.82%) MBA
Quality Assurance & Compliance
1 215 (7.97%) SLA
2 58 (2.15%) GDPR
3 20 (0.74%) Cyber Essentials
4 19 (0.70%) PCI DSS
5 14 (0.52%) ISO/IEC 27001
6 7 (0.26%) QA
7 5 (0.19%) Accessibility
8 2 (0.074%) ISO 14001
8 2 (0.074%) ISO 9001
8 2 (0.074%) NIST
9 1 (0.037%) Cyber Essentials PLUS
9 1 (0.037%) GxP
System Software
1 1,051 (38.97%) Active Directory
2 327 (12.12%) VMware Infrastructure
3 307 (11.38%) Hyper-V
4 94 (3.49%) VMware ESXi
5 44 (1.63%) vSphere
6 31 (1.15%) Virtual Desktop
7 29 (1.08%) XenApp
8 23 (0.85%) Virtual Machines
9 22 (0.82%) Firmware
10 21 (0.78%) KVM
11 17 (0.63%) Terminal Services
12 16 (0.59%) XenDesktop
13 13 (0.48%) Docker
14 9 (0.33%) OpenSSH
15 8 (0.30%) NFS
15 8 (0.30%) VMware Workstation
16 6 (0.22%) Virtual Servers
16 6 (0.22%) VMware NSX
17 4 (0.15%) Citrix Hypervisor
18 3 (0.11%) GPFS
Systems Management
1 304 (11.27%) Microsoft Intune
2 158 (5.86%) SCCM
3 37 (1.37%) vCenter Server
4 29 (1.08%) Jamf Pro
5 28 (1.04%) Terraform
6 22 (0.82%) Ansible
7 19 (0.70%) Backup Exec
8 18 (0.67%) Progress Chef
9 16 (0.59%) NetBackup
10 15 (0.56%) Cisco CUCM
11 13 (0.48%) ServiceCenter
11 13 (0.48%) WMI
12 11 (0.41%) Autotask
13 10 (0.37%) Failover Clustering
13 10 (0.37%) Grafana
13 10 (0.37%) SCOM
14 9 (0.33%) IBM BigFix
14 9 (0.33%) Kubernetes
14 9 (0.33%) PowerCLI
15 8 (0.30%) Microsoft Data Protection Manager
Vendors
1 1,221 (45.27%) Microsoft
2 464 (17.20%) VMware
3 244 (9.05%) Cisco
4 185 (6.86%) Citrix
5 141 (5.23%) Apple
6 125 (4.63%) Veeam
7 106 (3.93%) HP
8 79 (2.93%) Dell
9 77 (2.86%) Oracle
10 69 (2.56%) Sophos
11 68 (2.52%) Google
12 54 (2.00%) Meraki
13 49 (1.82%) IBM
14 43 (1.59%) ServiceNow
15 39 (1.45%) SAP
16 36 (1.33%) ConnectWise
17 35 (1.30%) Palo Alto
18 33 (1.22%) Draytek
18 33 (1.22%) Fortinet
19 28 (1.04%) SolarWinds