General Data Protection Regulation EU 2016/679 (GDPR)
UK

The table below provides summary statistics for permanent job vacancies requiring GDPR skills. It includes a benchmarking guide to the annual salaries offered in vacancies that cited GDPR over the 6 months leading up to 30 May 2025, comparing them to the same period in the previous two years.

6 months to
30 May 2025
Same period 2024 Same period 2023
Rank 192 172 277
Rank change year-on-year -20 +105 -33
Permanent jobs citing GDPR 942 1,733 1,269
As % of all permanent jobs advertised in the UK 1.70% 1.68% 1.31%
As % of the Quality Assurance & Compliance category 10.31% 12.66% 7.05%
Number of salaries quoted 641 1,057 735
10th Percentile £31,250 £25,750 £28,250
25th Percentile £46,250 £31,250 £42,000
Median annual salary (50th Percentile) £62,500 £47,000 £55,000
Median % change year-on-year +32.98% -14.55% -4.35%
75th Percentile £83,750 £67,500 £75,000
90th Percentile £98,474 £85,000 £92,300
UK excluding London median annual salary £55,000 £42,500 £50,238
% change year-on-year +29.41% -15.40% -8.66%

All Quality Assurance and Compliance Skills
UK

GDPR falls under the Quality Assurance and Compliance category. For comparison with the information above, the following table provides summary statistics for all permanent job vacancies requiring quality assurance or compliance skills.

Permanent vacancies with a requirement for quality assurance or compliance skills 9,140 13,692 17,995
As % of all permanent jobs advertised in the UK 16.50% 13.26% 18.52%
Number of salaries quoted 4,594 9,225 8,512
10th Percentile £31,250 £26,500 £32,000
25th Percentile £45,000 £36,250 £42,500
Median annual salary (50th Percentile) £60,000 £52,500 £57,500
Median % change year-on-year +14.29% -8.70% +4.55%
75th Percentile £73,000 £70,000 £76,250
90th Percentile £90,000 £91,150 £93,750
UK excluding London median annual salary £55,000 £47,500 £50,000
% change year-on-year +15.79% -5.00% +4.90%

GDPR
Job Vacancy Trend

Job postings citing GDPR as a proportion of all IT jobs advertised.
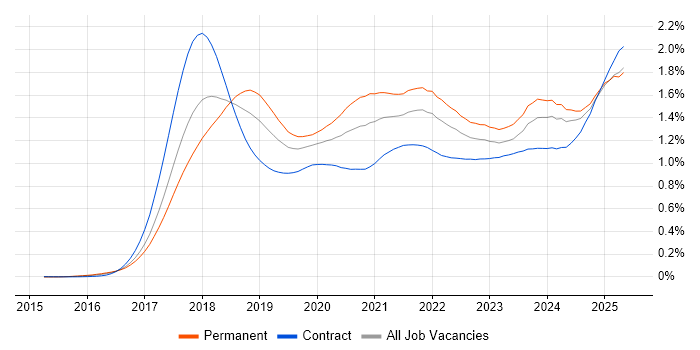
Job vacancy trend for GDPR in the UK

GDPR
Salary Trend

3-month moving average salary quoted in jobs citing GDPR.

Salary trend for GDPR in the UK

GDPR
Salary Histogram

Salary distribution for jobs citing GDPR over the 6 months to 30 May 2025.

Salary histogram for GDPR in the UK

GDPR
Top 19 Job Locations

The table below looks at the demand and provides a guide to the median salaries quoted in IT jobs citing GDPR within the UK over the 6 months to 30 May 2025. The 'Rank Change' column provides an indication of the change in demand within each location based on the same 6 month period last year.

Location Rank Change
on Same Period
Last Year
Matching
Permanent
IT Job Ads
Median Salary
Past 6 Months
Median Salary
% Change
on Same Period
Last Year
Live
Jobs
England -42 816 £62,500 +32.98% 3,072
UK excluding London -63 528 £55,000 +29.41% 3,002
London +84 313 £75,000 +36.36% 459
Work from Home +79 305 £62,500 +25.00% 1,573
South East -31 179 £57,500 +21.05% 959
North of England -100 137 £50,000 +22.91% 638
Midlands -15 99 £51,250 +36.67% 537
North West -83 74 £48,306 +20.77% 321
West Midlands -18 65 £55,000 +25.55% 286
South West +28 49 £70,000 +86.67% 321
Yorkshire -31 44 £50,375 +15.16% 247
East Midlands +4 34 £35,500 +9.23% 211
East of England -11 32 £47,500 +11.76% 432
North East +7 19 £57,500 +42.86% 72
Scotland +71 18 £55,000 +20.22% 117
Northern Ireland +45 6 - - 40
Channel Islands - 5 £80,000 - 2
Wales +21 4 £55,000 +69.23% 76
Isle of Man - 4 £91,000 -

GDPR
Co-occurring Skills and Capabilities by Category

The follow tables expand on the table above by listing co-occurrences grouped by category. The same employment type, locality and period is covered with up to 20 co-occurrences shown in each of the following categories:

Application Platforms
1 37 (3.93%) SharePoint
2 34 (3.61%) CMS
3 28 (2.97%) Microsoft Exchange
4 26 (2.76%) Apache Spark
5 21 (2.23%) Umbraco
6 12 (1.27%) WordPress
7 7 (0.74%) Confluence
8 6 (0.64%) Moodle
9 5 (0.53%) SAS
10 3 (0.32%) Apache
10 3 (0.32%) EPiServer
11 2 (0.21%) Apache Airflow
11 2 (0.21%) ArcGIS
11 2 (0.21%) Drupal
11 2 (0.21%) Oracle Workflow
12 1 (0.11%) IIS
12 1 (0.11%) nginx
12 1 (0.11%) OpenEdge
12 1 (0.11%) SharePoint Server
Applications
1 80 (8.49%) Microsoft Office
2 41 (4.35%) Microsoft Excel
3 7 (0.74%) Acrobat
4 5 (0.53%) Microsoft PowerPoint
5 4 (0.42%) MS Visio
5 4 (0.42%) Spreadsheet
6 3 (0.32%) Adobe Creative Suite
6 3 (0.32%) Chatbot
7 2 (0.21%) Microsoft Project
7 2 (0.21%) Revit
7 2 (0.21%) Trello
8 1 (0.11%) Adobe Illustrator
8 1 (0.11%) InDesign
8 1 (0.11%) Photoshop
Business Applications
1 28 (2.97%) Raiser’s Edge
2 21 (2.23%) SAP S/4HANA
3 15 (1.59%) Dynamics CRM
4 13 (1.38%) SAP HCM
4 13 (1.38%) SAP HR
4 13 (1.38%) SAP Payroll
5 7 (0.74%) Payment Gateway
6 5 (0.53%) Maximo
6 5 (0.53%) Salesforce CRM
6 5 (0.53%) Shopify
7 4 (0.42%) iTrent
8 2 (0.21%) NetSuite
9 1 (0.11%) Dynamics GP
9 1 (0.11%) Exchequer
9 1 (0.11%) Lorenzo
9 1 (0.11%) Magento
9 1 (0.11%) Oracle EBS
9 1 (0.11%) Oracle Payables
9 1 (0.11%) Oracle SCM
9 1 (0.11%) SystmOne
Cloud Services
1 296 (31.42%) Azure
2 132 (14.01%) AWS
3 106 (11.25%) Microsoft 365
4 94 (9.98%) Power Platform
5 88 (9.34%) GCP
6 61 (6.48%) Azure DevOps
7 41 (4.35%) Entra ID
7 41 (4.35%) SaaS
8 31 (3.29%) Azure Cosmos DB
8 31 (3.29%) Snowflake
9 30 (3.18%) Azure Service Bus
9 30 (3.18%) Power Automate
9 30 (3.18%) SonarCloud
10 28 (2.97%) Serverless
11 26 (2.76%) Azure Sentinel
12 21 (2.23%) AWS Lambda
12 21 (2.23%) Microsoft Purview
13 20 (2.12%) Azure Data Factory
13 20 (2.12%) Collibra
13 20 (2.12%) SuccessFactors
Communications & Networking
1 115 (12.21%) Firewall
2 79 (8.39%) Network Security
3 39 (4.14%) VPN
4 29 (3.08%) Intrusion Detection
5 26 (2.76%) Intranet
6 14 (1.49%) DNS
6 14 (1.49%) SAN
7 12 (1.27%) DHCP
8 10 (1.06%) NAS
8 10 (1.06%) WAN
9 9 (0.96%) Wi-Fi
10 7 (0.74%) VLAN
11 6 (0.64%) LAN
11 6 (0.64%) SD-WAN
11 6 (0.64%) TCP/IP
11 6 (0.64%) VoIP
11 6 (0.64%) Wireless
12 4 (0.42%) Broadband
12 4 (0.42%) Internet
13 3 (0.32%) SSL
Database & Business Intelligence
1 85 (9.02%) Power BI
2 67 (7.11%) Data Warehouse
3 49 (5.20%) SQL Server
4 34 (3.61%) Elasticsearch
5 31 (3.29%) NoSQL
6 30 (3.18%) Metadata
7 29 (3.08%) Tableau
8 19 (2.02%) Big Data
8 19 (2.02%) Data Lake
8 19 (2.02%) Relational Database
9 12 (1.27%) Hadoop
9 12 (1.27%) SQL Server Reporting Services
10 10 (1.06%) MySQL
11 9 (0.96%) IBM InfoSphere
11 9 (0.96%) SQL Server Integration Services
12 6 (0.64%) BusinessObjects
12 6 (0.64%) Metadata Repository
12 6 (0.64%) Oracle Reports
12 6 (0.64%) PostgreSQL
12 6 (0.64%) Power Query
Development Applications
1 35 (3.72%) Git
2 31 (3.29%) Octopus Deploy
2 31 (3.29%) Team Foundation Server
3 30 (3.18%) MSBuild
3 30 (3.18%) Visual Studio
4 20 (2.12%) JIRA
5 17 (1.80%) Jenkins
6 5 (0.53%) Postman
6 5 (0.53%) Selenium
7 4 (0.42%) SoapUI
7 4 (0.42%) SQL Server Management Studio (SSMS)
8 3 (0.32%) Cypress.io
8 3 (0.32%) ERwin
8 3 (0.32%) GitLab
8 3 (0.32%) JMeter
8 3 (0.32%) Mocha
8 3 (0.32%) MSTest
8 3 (0.32%) NUnit
8 3 (0.32%) SpecFlow
9 2 (0.21%) Oracle Forms
General
1 386 (40.98%) Social Skills
2 240 (25.48%) Finance
3 170 (18.05%) Analytical Skills
4 134 (14.23%) Legal
5 112 (11.89%) Law
6 97 (10.30%) Marketing
7 79 (8.39%) Retail
8 42 (4.46%) Inclusion and Diversity
9 41 (4.35%) Public Sector
10 39 (4.14%) Manufacturing
11 28 (2.97%) Organisational Skills
12 27 (2.87%) Financial Institution
13 25 (2.65%) Banking
13 25 (2.65%) Telecoms
14 24 (2.55%) Prime Brokerage
15 20 (2.12%) Games
16 19 (2.02%) Electronics
16 19 (2.02%) Influencing Skills
17 18 (1.91%) Documentation Skills
18 16 (1.70%) Presentation Skills
Job Titles
1 144 (15.29%) Architect
2 98 (10.40%) Lead
3 87 (9.24%) Senior
4 86 (9.13%) Analyst
5 54 (5.73%) IT Support
6 45 (4.78%) Security Engineer
6 45 (4.78%) Technical Architect
7 42 (4.46%) IT Manager
8 39 (4.14%) Solutions Architect
9 38 (4.03%) Operations Manager
10 33 (3.50%) Developer
11 32 (3.40%) Risk Manager
11 32 (3.40%) Security Architect
12 29 (3.08%) Lead Architect
13 25 (2.65%) Security Manager
14 24 (2.55%) AWS Architect
15 23 (2.44%) Azure Engineer
15 23 (2.44%) Data Engineer
16 22 (2.34%) Support Analyst
17 21 (2.23%) Support Manager
Libraries, Frameworks & Software Standards
1 67 (7.11%) HTML
2 65 (6.90%) CSS
3 44 (4.67%) .NET
4 40 (4.25%) Kafka
4 40 (4.25%) REST
5 36 (3.82%) JSON
6 33 (3.50%) ASP.NET
7 32 (3.40%) XML
8 31 (3.29%) Bootstrap
8 31 (3.29%) gRPC
9 20 (2.12%) HTML5
9 20 (2.12%) jQuery
10 18 (1.91%) SAP Fiori
11 17 (1.80%) Elastic Stack
12 12 (1.27%) ARM Templates
12 12 (1.27%) Node.js
13 10 (1.06%) PySpark
13 10 (1.06%) RESTful
14 7 (0.74%) EDI
14 7 (0.74%) Laravel
Miscellaneous
1 147 (15.61%) Management Information System
2 68 (7.22%) Security Posture
3 55 (5.84%) Cloud Native
4 37 (3.93%) Data Protection Act
4 37 (3.93%) Self-Motivation
4 37 (3.93%) Social Media
5 28 (2.97%) Hedge funds
6 27 (2.87%) Onboarding
7 24 (2.55%) Blockchain
7 24 (2.55%) Cyber Threat
7 24 (2.55%) Derivative
8 23 (2.44%) NHS
9 22 (2.34%) Algorithms
9 22 (2.34%) Distributed Systems
10 21 (2.23%) Driving Licence
11 19 (2.02%) Analytical Mindset
12 15 (1.59%) Freedom of Information
13 14 (1.49%) Product Ownership
13 14 (1.49%) Team-Oriented Environment
14 12 (1.27%) Legacy Systems
Operating Systems
1 105 (11.15%) Windows
2 33 (3.50%) Windows Server
3 29 (3.08%) Linux
4 15 (1.59%) Apple iOS
5 14 (1.49%) Windows Vista
6 10 (1.06%) Android
7 8 (0.85%) Windows Server 2019
8 7 (0.74%) Mac OS
9 6 (0.64%) Windows 10
9 6 (0.64%) Windows 7
9 6 (0.64%) Windows Server 2016
10 4 (0.42%) Red Hat Enterprise Linux
10 4 (0.42%) VMS
11 3 (0.32%) CentOS
11 3 (0.32%) Ubuntu
12 2 (0.21%) Solaris
13 1 (0.11%) Kali Linux
13 1 (0.11%) Unix
13 1 (0.11%) Windows Server 2008
Processes & Methodologies
1 238 (25.27%) Problem-Solving
2 215 (22.82%) Data Protection
3 202 (21.44%) Cybersecurity
4 161 (17.09%) Information Security
5 159 (16.88%) DevOps
6 147 (15.61%) Data Security
7 142 (15.07%) Analytics
8 141 (14.97%) Risk Management
9 125 (13.27%) CI/CD
10 115 (12.21%) Agile
10 115 (12.21%) Data Privacy
11 114 (12.10%) Incident Response
12 113 (12.00%) Business Intelligence
13 110 (11.68%) Project Management
14 105 (11.15%) Decision-Making
15 104 (11.04%) Data Governance
15 104 (11.04%) Data Management
16 103 (10.93%) Roadmaps
17 100 (10.62%) Computer Science
17 100 (10.62%) CRM
Programming Languages
1 158 (16.77%) SQL
2 124 (13.16%) Python
3 74 (7.86%) PowerShell
4 67 (7.11%) C#
5 56 (5.94%) JavaScript
6 46 (4.88%) Java
7 35 (3.72%) Bash
8 15 (1.59%) PHP
9 13 (1.38%) ABAP
10 11 (1.17%) R
10 11 (1.17%) T-SQL
11 9 (0.96%) Data Analysis Expressions
12 8 (0.85%) Perl
12 8 (0.85%) Scala
13 6 (0.64%) TypeScript
14 4 (0.42%) Kusto Query Language
15 3 (0.32%) C++
16 2 (0.21%) Apex Code
16 2 (0.21%) C
16 2 (0.21%) Ruby
Qualifications
1 189 (20.06%) Degree
2 91 (9.66%) CISSP
3 74 (7.86%) Computer Science Degree
4 70 (7.43%) Azure Certification
5 60 (6.37%) CISM
6 44 (4.67%) AWS Certification
7 43 (4.56%) Security Cleared
8 38 (4.03%) Master's Degree
9 33 (3.50%) DBS Check
10 32 (3.40%) CISA
11 30 (3.18%) CEH
11 30 (3.18%) Cisco Certification
12 28 (2.97%) SC Cleared
13 27 (2.87%) AWS Certified Solutions Architect
14 23 (2.44%) PMI Certification
14 23 (2.44%) PMP
15 21 (2.23%) (ISC)2 CCSP
16 19 (2.02%) Microsoft Certification
17 12 (1.27%) CRISC
18 9 (0.96%) Network+ Certification
Quality Assurance & Compliance
1 219 (23.25%) ISO/IEC 27001
2 161 (17.09%) NIST
3 102 (10.83%) PCI DSS
4 94 (9.98%) Cyber Essentials
5 85 (9.02%) HIPAA
6 80 (8.49%) California Consumer Privacy Act
7 64 (6.79%) Data Quality
8 62 (6.58%) Accessibility
9 45 (4.78%) SOC 2
10 40 (4.25%) Cyber Essentials PLUS
11 37 (3.93%) QA
12 32 (3.40%) Sarbanes-Oxley
13 23 (2.44%) GRC
14 19 (2.02%) SLA
15 17 (1.80%) WCAG
16 16 (1.70%) ISO/IEC 27002 (supersedes ISO/IEC 17799)
17 10 (1.06%) PERC
18 7 (0.74%) COBIT
19 6 (0.64%) Actionable Recommendations
19 6 (0.64%) NIST 800
System Software
1 75 (7.96%) Docker
2 67 (7.11%) Active Directory
3 29 (3.08%) VMware Infrastructure
4 22 (2.34%) Virtual Machines
5 21 (2.23%) Hyper-V
6 11 (1.17%) Virtual Desktop
7 3 (0.32%) Dovecot
7 3 (0.32%) Postfix
7 3 (0.32%) VMware ESXi
7 3 (0.32%) vSphere
8 2 (0.21%) Squid
9 1 (0.11%) Virtual Servers
Systems Management
1 54 (5.73%) Terraform
2 53 (5.63%) Kubernetes
3 31 (3.29%) Microsoft Intune
4 17 (1.80%) Ansible
4 17 (1.80%) Grafana
5 15 (1.59%) Prometheus
6 10 (1.06%) Single Sign-On
7 6 (0.64%) Progress Chef
7 6 (0.64%) Puppet
7 6 (0.64%) Red Hat Satellite
8 5 (0.53%) SCCM
9 4 (0.42%) Kibana
9 4 (0.42%) Nessus
9 4 (0.42%) QRadar
9 4 (0.42%) SCOM
9 4 (0.42%) SCOrch
10 3 (0.32%) Avamar
10 3 (0.32%) CASB
10 3 (0.32%) Computer Emergency Response Teams
10 3 (0.32%) RSA Archer
Vendors
1 268 (28.45%) Microsoft
2 86 (9.13%) Google
3 58 (6.16%) SAP
4 38 (4.03%) VMware
5 27 (2.87%) Salesforce
6 25 (2.65%) Cisco
7 21 (2.23%) Informatica
8 19 (2.02%) ServiceNow
9 18 (1.91%) Adobe
10 17 (1.80%) HP
11 16 (1.70%) Citrix
11 16 (1.70%) OpenAI
12 15 (1.59%) Meraki
13 14 (1.49%) Databricks
14 12 (1.27%) Oracle
14 12 (1.27%) Workday
15 11 (1.17%) Facebook
15 11 (1.17%) Red Hat
16 10 (1.06%) Palo Alto
16 10 (1.06%) Splunk