Root Cause Analysis Jobs

Root Cause Analysis
UK

The table below provides summary statistics for permanent job vacancies requiring Root Cause Analysis skills. It includes a benchmarking guide to the annual salaries offered in vacancies that cited Root Cause Analysis over the 6 months leading up to 16 May 2025, comparing them to the same period in the previous two years.

6 months to
16 May 2025
Same period 2024 Same period 2023
Rank 322 306 326
Rank change year-on-year -16 +20 +24
Permanent jobs citing Root Cause Analysis 483 932 1,053
As % of all permanent jobs advertised in the UK 0.87% 0.94% 1.06%
As % of the Processes & Methodologies category 0.93% 1.10% 1.10%
Number of salaries quoted 318 487 570
10th Percentile £21,250 £29,750 £31,250
25th Percentile £41,250 £37,101 £38,079
Median annual salary (50th Percentile) £52,500 £50,000 £55,000
Median % change year-on-year +5.00% -9.09% +15.79%
75th Percentile £68,694 £65,000 £75,000
90th Percentile £90,300 £82,500 £89,852
UK excluding London median annual salary £45,000 £45,000 £50,000
% change year-on-year - -10.00% +17.65%

All Process and Methodology Skills
UK

Root Cause Analysis falls under the Processes and Methodologies category. For comparison with the information above, the following table provides summary statistics for all permanent job vacancies requiring process or methodology skills.

Permanent vacancies with a requirement for process or methodology skills 52,098 84,818 95,320
As % of all permanent jobs advertised in the UK 93.84% 85.52% 95.60%
Number of salaries quoted 26,512 59,706 56,022
10th Percentile £29,750 £29,000 £34,000
25th Percentile £41,750 £40,000 £45,000
Median annual salary (50th Percentile) £57,500 £55,000 £61,180
Median % change year-on-year +4.55% -10.10% +1.97%
75th Percentile £75,000 £72,500 £81,250
90th Percentile £97,500 £92,500 £100,000
UK excluding London median annual salary £52,000 £50,000 £55,000
% change year-on-year +4.00% -9.09% +4.76%

Root Cause Analysis
Job Vacancy Trend

Job postings citing Root Cause Analysis as a proportion of all IT jobs advertised.
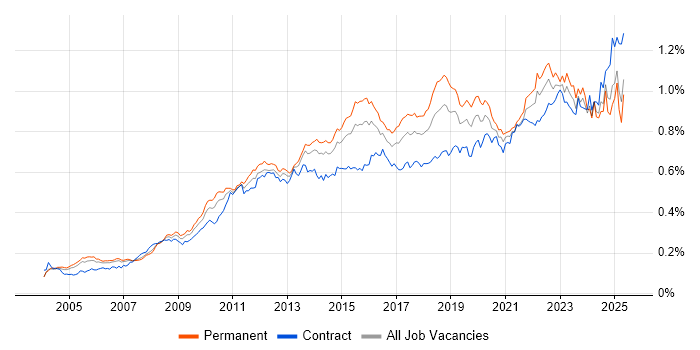
Job vacancy trend for Root Cause Analysis in the UK

Root Cause Analysis
Salary Trend

3-month moving average salary quoted in jobs citing Root Cause Analysis.

Salary trend for Root Cause Analysis in the UK

Root Cause Analysis
Salary Histogram

Salary distribution for jobs citing Root Cause Analysis over the 6 months to 16 May 2025.

Salary histogram for Root Cause Analysis in the UK

Root Cause Analysis
Top 16 Job Locations

The table below looks at the demand and provides a guide to the median salaries quoted in IT jobs citing Root Cause Analysis within the UK over the 6 months to 16 May 2025. The 'Rank Change' column provides an indication of the change in demand within each location based on the same 6 month period last year.

Location Rank Change
on Same Period
Last Year
Matching
Permanent
IT Job Ads
Median Salary
Past 6 Months
Median Salary
% Change
on Same Period
Last Year
Live
Jobs
England -29 457 £52,500 +5.00% 654
UK excluding London -17 252 £45,000 - 435
London +11 214 £65,000 - 304
Work from Home -74 147 £62,500 +19.05% 247
North of England -25 77 £40,000 -11.11% 88
Midlands +2 61 £44,000 -7.37% 68
South East +62 49 £47,500 - 151
North West -54 38 £39,500 -10.23% 51
East Midlands -5 31 £37,500 -25.00% 25
West Midlands +32 30 £47,500 +26.67% 42
East of England +6 28 £52,500 +16.67% 48
Yorkshire +52 22 £42,000 -6.67% 30
South West +70 21 £53,750 -11.77% 46
North East +37 17 £53,750 +19.44% 7
Scotland +105 14 £55,000 +30.33% 27
Northern Ireland +27 3 £30,000 - 15

Root Cause Analysis
Co-occurring Skills and Capabilities by Category

The follow tables expand on the table above by listing co-occurrences grouped by category. The same employment type, locality and period is covered with up to 20 co-occurrences shown in each of the following categories:

Application Platforms
1 35 (7.25%) Confluence
2 28 (5.80%) SharePoint
3 11 (2.28%) Microsoft Exchange
4 6 (1.24%) Apache Spark
5 5 (1.04%) Jupyter
6 4 (0.83%) SharePoint Server
7 3 (0.62%) Alfresco
7 3 (0.62%) Apache
7 3 (0.62%) Documentum
7 3 (0.62%) IIS
7 3 (0.62%) Skype for Business
7 3 (0.62%) Tomcat
8 2 (0.41%) Blackberry Enterprise Server
8 2 (0.41%) Exchange Server 2013
9 1 (0.21%) OpenStack
Applications
1 15 (3.11%) Microsoft Excel
2 13 (2.69%) Microsoft Office
3 4 (0.83%) Microsoft PowerPoint
4 2 (0.41%) Trello
5 1 (0.21%) AutoCAD
5 1 (0.21%) SOLIDWORKS
5 1 (0.21%) Weka
Business Applications
1 7 (1.45%) SAP S/4HANA
2 5 (1.04%) Dynamics AX
3 4 (0.83%) Markit EDM
4 2 (0.41%) Infor M3
5 1 (0.21%) Dynamics CRM
5 1 (0.21%) Q-Pulse
5 1 (0.21%) Sage 200
5 1 (0.21%) SAP HR
5 1 (0.21%) SAP Payroll
Cloud Services
1 164 (33.95%) Azure
2 88 (18.22%) AWS
3 46 (9.52%) Microsoft 365
4 42 (8.70%) GCP
5 25 (5.18%) Entra ID
5 25 (5.18%) Serverless
6 17 (3.52%) Power Platform
7 14 (2.90%) AWS Lambda
8 13 (2.69%) SaaS
9 11 (2.28%) Amazon CloudWatch
10 10 (2.07%) Azure DevOps
11 9 (1.86%) Amazon ECS
12 8 (1.66%) Datadog
13 7 (1.45%) Amazon EKS
13 7 (1.45%) IaaS
13 7 (1.45%) PaaS
14 6 (1.24%) OneDrive
14 6 (1.24%) SAP Commerce Cloud
15 5 (1.04%) AWS CloudFormation
15 5 (1.04%) Boomi
Communications & Networking
1 56 (11.59%) Firewall
2 43 (8.90%) WAN
3 42 (8.70%) LAN
4 36 (7.45%) Network Security
5 35 (7.25%) VPN
6 30 (6.21%) TCP/IP
7 26 (5.38%) DNS
8 17 (3.52%) DHCP
9 15 (3.11%) BGP
9 15 (3.11%) OSPF
10 14 (2.90%) MPLS
10 14 (2.90%) Wireless
11 12 (2.48%) WLAN
12 8 (1.66%) Intrusion Detection
13 7 (1.45%) SD-WAN
13 7 (1.45%) VoIP
14 5 (1.04%) Wi-Fi
15 4 (0.83%) HTTP
16 3 (0.62%) EIGRP
16 3 (0.62%) Internet
Database & Business Intelligence
1 42 (8.70%) Tableau
2 29 (6.00%) SQL Server
3 16 (3.31%) Power BI
3 16 (3.31%) SQL Server Integration Services
3 16 (3.31%) SQL Server Reporting Services
4 12 (2.48%) Azure SQL Database
4 12 (2.48%) Data Lake
5 8 (1.66%) Data Warehouse
6 6 (1.24%) PostgreSQL
7 5 (1.04%) Amazon RDS
7 5 (1.04%) Oracle Reports
8 4 (0.83%) Amazon QuickSight
8 4 (0.83%) Data Vault
8 4 (0.83%) Dremio
8 4 (0.83%) Relational Database
8 4 (0.83%) Semantic Layer
9 3 (0.62%) Big Data
9 3 (0.62%) DynamoDB
9 3 (0.62%) Hadoop
10 2 (0.41%) Apache Hive
Development Applications
1 45 (9.32%) JIRA
2 40 (8.28%) Git
3 16 (3.31%) Jenkins
4 8 (1.66%) GitLab
5 5 (1.04%) Cypress.io
6 4 (0.83%) Selenium
7 3 (0.62%) CircleCI
7 3 (0.62%) Cucumber
7 3 (0.62%) Log4j
8 2 (0.41%) Appium
8 2 (0.41%) Atlassian Bamboo
8 2 (0.41%) SpecFlow
8 2 (0.41%) WebDriver
9 1 (0.21%) Bitbucket
9 1 (0.21%) FitNesse
9 1 (0.21%) Gatling
9 1 (0.21%) JMeter
9 1 (0.21%) Locust
9 1 (0.21%) Newman
9 1 (0.21%) Postman
General
1 224 (46.38%) Social Skills
2 145 (30.02%) Finance
3 129 (26.71%) Analytical Skills
4 73 (15.11%) Retail
5 50 (10.35%) Law
6 37 (7.66%) Manufacturing
7 35 (7.25%) Banking
8 26 (5.38%) Public Sector
9 25 (5.18%) Electronics
10 21 (4.35%) Telecoms
11 20 (4.14%) Legal
12 19 (3.93%) Marketing
12 19 (3.93%) Presentation Skills
13 17 (3.52%) Documentation Skills
14 15 (3.11%) Inclusion and Diversity
15 12 (2.48%) Organisational Skills
16 9 (1.86%) Influencing Skills
16 9 (1.86%) Pharmaceutical
17 6 (1.24%) Automotive
17 6 (1.24%) Back Office
Job Titles
1 111 (22.98%) Analyst
2 88 (18.22%) Senior
3 59 (12.22%) IT Support
4 53 (10.97%) Support Analyst
5 34 (7.04%) IT Analyst
5 34 (7.04%) Senior Analyst
6 33 (6.83%) Lead
7 32 (6.63%) Data Analyst
7 32 (6.63%) Support Engineer
8 31 (6.42%) IT Support Analyst
8 31 (6.42%) Support Manager
9 28 (5.80%) Quality Manager
10 26 (5.38%) Applications Support
10 26 (5.38%) Senior Data Analyst
10 26 (5.38%) SQL Analyst
11 25 (5.18%) SQL Support Analyst
12 24 (4.97%) 3rd Line Engineer
13 22 (4.55%) Infrastructure Engineer
14 21 (4.35%) Administrator
15 20 (4.14%) IT Engineer
Libraries, Frameworks & Software Standards
1 18 (3.73%) .NET
2 11 (2.28%) Spring
3 10 (2.07%) scikit-learn
3 10 (2.07%) TensorFlow
4 9 (1.86%) Pandas
4 9 (1.86%) PySpark
5 7 (1.45%) ARM Templates
5 7 (1.45%) EDI
6 6 (1.24%) Spring Boot
7 5 (1.04%) HTML
7 5 (1.04%) JSON
7 5 (1.04%) Kafka
7 5 (1.04%) OpenTelemetry
7 5 (1.04%) Oracle Fusion
8 4 (0.83%) Elastic Stack
8 4 (0.83%) Playwright
9 3 (0.62%) AngularJS
9 3 (0.62%) Apache Camel
9 3 (0.62%) React
9 3 (0.62%) REST
Miscellaneous
1 44 (9.11%) Management Information System
2 27 (5.59%) Security Posture
3 16 (3.31%) Cloud Native
4 15 (3.11%) Data Centre
5 14 (2.90%) Data Structures
6 13 (2.69%) Cyber Threat
7 11 (2.28%) Algorithms
8 10 (2.07%) Product Ownership
9 9 (1.86%) Credit Risk
10 8 (1.66%) Onboarding
10 8 (1.66%) Robotics
10 8 (1.66%) SCADA
10 8 (1.66%) Social Media
11 6 (1.24%) Public Cloud
12 5 (1.04%) Equities
12 5 (1.04%) Smartphone
13 4 (0.83%) Enterprise Software
13 4 (0.83%) Reference Data
13 4 (0.83%) Security Operations Centre
13 4 (0.83%) Self-Motivation
Operating Systems
1 96 (19.88%) Windows
2 49 (10.14%) Windows Server
3 35 (7.25%) Linux
4 18 (3.73%) Windows 10
5 15 (3.11%) Mac OS
6 14 (2.90%) Apple iOS
6 14 (2.90%) Windows Server 2019
7 13 (2.69%) Windows Server 2016
8 11 (2.28%) Windows Server 2012
9 8 (1.66%) Unix
10 7 (1.45%) Android
10 7 (1.45%) Red Hat Enterprise Linux
11 5 (1.04%) Solaris
12 4 (0.83%) CentOS
13 2 (0.41%) Mac OS X
13 2 (0.41%) VMS
13 2 (0.41%) Windows 7
Processes & Methodologies
1 178 (36.85%) Problem-Solving
2 129 (26.71%) Incident Management
3 105 (21.74%) ITIL
4 101 (20.91%) Agile
5 83 (17.18%) Continuous Improvement
5 83 (17.18%) Incident Response
6 67 (13.87%) Analytics
7 66 (13.66%) Cybersecurity
8 59 (12.22%) ITSM
9 57 (11.80%) DevOps
10 51 (10.56%) Service Delivery
11 47 (9.73%) Artificial Intelligence
11 47 (9.73%) Customer Service
11 47 (9.73%) Mentoring
11 47 (9.73%) Problem Management
11 47 (9.73%) Visualisation
12 42 (8.70%) High Availability
12 42 (8.70%) Service Management
13 38 (7.87%) Data Pipeline
14 37 (7.66%) CI/CD
Programming Languages
1 133 (27.54%) SQL
2 106 (21.95%) Python
3 39 (8.07%) Java
4 29 (6.00%) PowerShell
5 26 (5.38%) Bash
6 14 (2.90%) JavaScript
7 13 (2.69%) T-SQL
8 9 (1.86%) C#
9 6 (1.24%) C
9 6 (1.24%) TypeScript
10 5 (1.04%) R
11 4 (0.83%) Bicep
11 4 (0.83%) Go
11 4 (0.83%) Kusto Query Language
12 3 (0.62%) Ruby
13 2 (0.41%) C++
13 2 (0.41%) Perl
13 2 (0.41%) Search Processing Language
14 1 (0.21%) Data Analysis Expressions
14 1 (0.21%) Kotlin
Qualifications
1 72 (14.91%) Degree
2 49 (10.14%) DBS Check
3 29 (6.00%) Security Cleared
4 27 (5.59%) Cisco Certification
5 25 (5.18%) SC Cleared
6 23 (4.76%) Azure Certification
6 23 (4.76%) CCNA
7 21 (4.35%) CISSP
7 21 (4.35%) Microsoft Certification
8 16 (3.31%) CISA
9 15 (3.11%) CCNP
9 15 (3.11%) Computer Science Degree
10 14 (2.90%) PMI Certification
10 14 (2.90%) PMP
11 13 (2.69%) MCSE
12 12 (2.48%) ITIL Foundation Certificate
12 12 (2.48%) Master's Degree
13 9 (1.86%) VMware Certified Professional (VCP)
14 5 (1.04%) BPSS Clearance
14 5 (1.04%) DV Cleared
Quality Assurance & Compliance
1 67 (13.87%) SLA
2 41 (8.49%) GDPR
3 39 (8.07%) QA
4 35 (7.25%) ISO/IEC 27001
5 25 (5.18%) NIST
6 24 (4.97%) Data Quality
6 24 (4.97%) PCI DSS
7 23 (4.76%) Sarbanes-Oxley
8 17 (3.52%) Cyber Essentials
9 14 (2.90%) Cyber Essentials PLUS
10 11 (2.28%) GMP
11 10 (2.07%) Accessibility
12 5 (1.04%) Automotive SPICE
12 5 (1.04%) ISO 26262
13 4 (0.83%) HIPAA
13 4 (0.83%) ISO 9001
14 3 (0.62%) GLP
14 3 (0.62%) Good Clinical Practice
14 3 (0.62%) GRC
14 3 (0.62%) SOC 2
System Software
1 59 (12.22%) Active Directory
2 22 (4.55%) Docker
3 19 (3.93%) VMware Infrastructure
4 15 (3.11%) Hyper-V
5 4 (0.83%) Firmware
6 3 (0.62%) Virtual Machines
7 2 (0.41%) Virtual Desktop
7 2 (0.41%) vSphere
8 1 (0.21%) BitLocker
8 1 (0.21%) Embedded Firmware
8 1 (0.21%) Microsoft App-V
8 1 (0.21%) Veritas Cluster Server
8 1 (0.21%) Virtual Servers
8 1 (0.21%) VMware ESXi
8 1 (0.21%) VMware NSX
8 1 (0.21%) VMware Workstation
Systems Management
1 40 (8.28%) Kubernetes
2 36 (7.45%) Microsoft Intune
3 35 (7.25%) Terraform
4 23 (4.76%) Prometheus
5 22 (4.55%) Grafana
6 20 (4.14%) Ansible
7 14 (2.90%) SCCM
8 12 (2.48%) SCOM
9 11 (2.28%) Nagios
10 10 (2.07%) NetBackup
11 8 (1.66%) Jamf Pro
12 7 (1.45%) Progress Chef
12 7 (1.45%) Puppet
13 5 (1.04%) Functional Safety
13 5 (1.04%) SmoothWall
14 4 (0.83%) Argo
14 4 (0.83%) Consul
15 3 (0.62%) Active Directory Federation Services
15 3 (0.62%) Istio
16 2 (0.41%) FortiGate
Vendors
1 125 (25.88%) Microsoft
2 42 (8.70%) Databricks
3 36 (7.45%) VMware
4 29 (6.00%) SAP
4 29 (6.00%) ServiceNow
5 28 (5.80%) Cisco
6 24 (4.97%) SolarWinds
7 19 (3.93%) Apple
8 16 (3.31%) Red Hat
9 13 (2.69%) Meraki
10 11 (2.28%) Splunk
11 10 (2.07%) Google
11 10 (2.07%) Veeam
12 9 (1.86%) Oracle
13 8 (1.66%) Citrix
13 8 (1.66%) Dell
14 7 (1.45%) Fortinet
15 6 (1.24%) NetApp
16 4 (0.83%) CheckPoint
16 4 (0.83%) Reuters