Performance Metrics Jobs

Performance Metrics
UK

The table below provides summary statistics for permanent job vacancies requiring Performance Metrics skills. It includes a benchmarking guide to the annual salaries offered in vacancies that cited Performance Metrics over the 6 months leading up to 30 May 2025, comparing them to the same period in the previous two years.

6 months to
30 May 2025
Same period 2024 Same period 2023
Rank 279 449 696
Rank change year-on-year +170 +247 -4
Permanent jobs citing Performance Metrics 613 538 270
As % of all permanent jobs advertised in the UK 1.11% 0.52% 0.28%
As % of the Processes & Methodologies category 1.18% 0.62% 0.29%
Number of salaries quoted 257 238 110
10th Percentile £38,750 £31,775 £41,250
25th Percentile £45,628 £42,500 £45,000
Median annual salary (50th Percentile) £50,818 £56,250 £53,375
Median % change year-on-year -9.66% +5.39% -17.88%
75th Percentile £70,540 £78,750 £72,500
90th Percentile £95,000 £90,750 £78,750
UK excluding London median annual salary £47,500 £47,500 £50,238
% change year-on-year - -5.45% -3.76%

All Process and Methodology Skills
UK

Performance Metrics falls under the Processes and Methodologies category. For comparison with the information above, the following table provides summary statistics for all permanent job vacancies requiring process or methodology skills.

Permanent vacancies with a requirement for process or methodology skills 51,902 86,889 92,846
As % of all permanent jobs advertised in the UK 93.67% 84.13% 95.56%
Number of salaries quoted 25,611 60,763 54,796
10th Percentile £28,822 £29,250 £34,000
25th Percentile £41,250 £40,000 £45,000
Median annual salary (50th Percentile) £57,443 £55,000 £60,899
Median % change year-on-year +4.44% -9.69% +1.50%
75th Percentile £75,000 £72,500 £81,250
90th Percentile £97,500 £92,500 £100,000
UK excluding London median annual salary £51,574 £50,000 £55,000
% change year-on-year +3.15% -9.09% +4.76%

Performance Metrics
Job Vacancy Trend

Job postings citing Performance Metrics as a proportion of all IT jobs advertised.
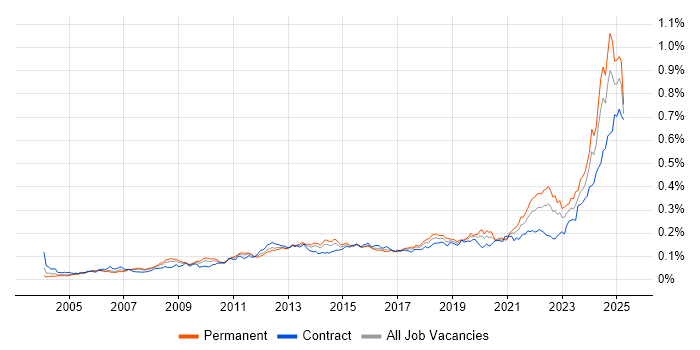
Job vacancy trend for Performance Metrics in the UK

Performance Metrics
Salary Trend

3-month moving average salary quoted in jobs citing Performance Metrics.

Salary trend for Performance Metrics in the UK

Performance Metrics
Salary Histogram

Salary distribution for jobs citing Performance Metrics over the 6 months to 30 May 2025.

Salary histogram for Performance Metrics in the UK

Performance Metrics
Top 18 Job Locations

The table below looks at the demand and provides a guide to the median salaries quoted in IT jobs citing Performance Metrics within the UK over the 6 months to 30 May 2025. The 'Rank Change' column provides an indication of the change in demand within each location based on the same 6 month period last year.

Location Rank Change
on Same Period
Last Year
Matching
Permanent
IT Job Ads
Median Salary
Past 6 Months
Median Salary
% Change
on Same Period
Last Year
Live
Jobs
England +126 574 £50,818 -11.62% 1,771
UK excluding London +117 324 £47,500 - 1,739
Work from Home +280 303 £62,500 +8.70% 539
London +145 166 £76,250 -1.61% 256
North of England +98 114 £45,628 +2.72% 418
North West +61 94 £45,628 -12.25% 189
South East +104 93 £55,000 +29.41% 520
East of England +102 72 £47,500 -5.00% 244
Midlands -78 30 £45,000 -10.00% 318
East Midlands +18 19 £42,500 -26.09% 129
Yorkshire +49 15 £30,825 -2.14% 165
West Midlands -87 11 £46,250 -7.50% 168
South West +99 7 - - 168
Scotland +117 5 £95,326 +202.62% 72
North East +50 5 £52,500 -34.38% 69
Wales +49 3 £60,000 +57.89% 41
Northern Ireland +43 1 - - 18
Channel Islands - 1 - - 4

Performance Metrics
Co-occurring Skills and Capabilities by Category

The follow tables expand on the table above by listing co-occurrences grouped by category. The same employment type, locality and period is covered with up to 20 co-occurrences shown in each of the following categories:

Application Platforms
1 75 (12.23%) SharePoint
2 17 (2.77%) Apache Spark
3 13 (2.12%) CMS
4 7 (1.14%) Confluence
4 7 (1.14%) WordPress
5 3 (0.49%) EPiServer
6 2 (0.33%) Microsoft Exchange
7 1 (0.16%) Apache
Applications
1 43 (7.01%) Microsoft Office
2 23 (3.75%) Microsoft Excel
3 10 (1.63%) Microsoft PowerPoint
4 6 (0.98%) MS Visio
5 4 (0.65%) Microsoft Project
6 3 (0.49%) Chatbot
6 3 (0.49%) Final Cut Pro
7 2 (0.33%) Adobe Premiere
8 1 (0.16%) Adobe Creative Suite
8 1 (0.16%) Camtasia
8 1 (0.16%) Photoshop
Business Applications
1 4 (0.65%) CA PPM
2 3 (0.49%) NetSuite
2 3 (0.49%) Payment Gateway
2 3 (0.49%) Shopify
3 2 (0.33%) Oracle ERP
4 1 (0.16%) Dynamics CRM
4 1 (0.16%) Oracle EBS
Cloud Services
1 259 (42.25%) Azure
2 249 (40.62%) AWS
3 221 (36.05%) AWS Lambda
3 221 (36.05%) GCP
3 221 (36.05%) Serverless
4 51 (8.32%) SaaS
5 27 (4.40%) Microsoft 365
6 22 (3.59%) Google Analytics
7 14 (2.28%) Power Platform
8 10 (1.63%) Entra ID
9 8 (1.31%) Google Ads
9 8 (1.31%) Microsoft Copilot
10 7 (1.14%) Amazon S3
10 7 (1.14%) Smartsheet
11 6 (0.98%) Amazon EC2
12 5 (0.82%) Azure Data Factory
13 4 (0.65%) Google Workspace
14 3 (0.49%) Figma
14 3 (0.49%) Google Data Studio
14 3 (0.49%) Stripe
Communications & Networking
1 221 (36.05%) Broadband
2 20 (3.26%) HTTP
3 11 (1.79%) Firewall
4 7 (1.14%) Network Security
5 4 (0.65%) VPN
6 3 (0.49%) DNS
6 3 (0.49%) NAS
6 3 (0.49%) SAN
6 3 (0.49%) SSL
7 2 (0.33%) DHCP
7 2 (0.33%) NetScaler
7 2 (0.33%) SNMP
7 2 (0.33%) TCP/IP
8 1 (0.16%) 3G
8 1 (0.16%) GPRS
8 1 (0.16%) Modbus
8 1 (0.16%) Remote Desktop
8 1 (0.16%) VLAN
8 1 (0.16%) WAN
8 1 (0.16%) Wireless
Database & Business Intelligence
1 11 (1.79%) Looker
1 11 (1.79%) Power BI
2 8 (1.31%) Amazon RDS
3 7 (1.14%) Data Warehouse
4 5 (0.82%) PostgreSQL
5 4 (0.65%) BigQuery
5 4 (0.65%) MongoDB
5 4 (0.65%) MySQL
5 4 (0.65%) NoSQL
5 4 (0.65%) Relational Database
5 4 (0.65%) Tableau
6 3 (0.49%) Amazon Redshift
6 3 (0.49%) Mixpanel
6 3 (0.49%) Snowflake Schema
6 3 (0.49%) SQL Server
7 2 (0.33%) ClickHouse
7 2 (0.33%) RDBMS
7 2 (0.33%) Redis
7 2 (0.33%) SQL Server Integration Services
8 1 (0.16%) Oracle Reports
Development Applications
1 61 (9.95%) JIRA
2 8 (1.31%) Git
3 7 (1.14%) Jenkins
4 2 (0.33%) Bitbucket
4 2 (0.33%) GitLab
4 2 (0.33%) Selenium
5 1 (0.16%) Crashlytics
5 1 (0.16%) FitNesse
5 1 (0.16%) Octopus Deploy
5 1 (0.16%) SonarQube
5 1 (0.16%) TeamCity
5 1 (0.16%) Xcode
General
1 291 (47.47%) Analytical Skills
2 142 (23.16%) Social Skills
3 132 (21.53%) Finance
4 75 (12.23%) Marketing
5 49 (7.99%) Law
6 34 (5.55%) Manufacturing
7 32 (5.22%) Games
8 28 (4.57%) Inclusion and Diversity
8 28 (4.57%) Organisational Skills
9 26 (4.24%) Legal
9 26 (4.24%) Retail
10 24 (3.92%) Advertising
11 18 (2.94%) Presentation Skills
12 17 (2.77%) Electronics
13 13 (2.12%) Telecoms
14 11 (1.79%) Banking
15 8 (1.31%) Financial Institution
15 8 (1.31%) Pharmaceutical
16 6 (0.98%) Public Sector
17 5 (0.82%) Health Technology
Job Titles
1 298 (48.61%) Senior
2 215 (35.07%) Machine Learning Engineer
3 33 (5.38%) Product Manager
4 29 (4.73%) Analyst
5 28 (4.57%) Lead
6 27 (4.40%) Project Manager
7 24 (3.92%) Architect
8 21 (3.43%) Configuration Manager
9 17 (2.77%) Developer
9 17 (2.77%) Senior Software Engineer
9 17 (2.77%) Software Engineer
10 15 (2.45%) Business Analyst
11 14 (2.28%) Managed Services Architect
11 14 (2.28%) Solutions Architect
11 14 (2.28%) Vendor Manager
12 12 (1.96%) Business Manager
13 11 (1.79%) IT Manager
14 10 (1.63%) E-Commerce Manager
15 9 (1.47%) IT Support
15 9 (1.47%) Service Manager
Libraries, Frameworks & Software Standards
1 16 (2.61%) Kafka
2 13 (2.12%) CSS
2 13 (2.12%) HTML
3 8 (1.31%) RESTful
4 6 (0.98%) React
4 6 (0.98%) WebSockets
5 4 (0.65%) .NET
5 4 (0.65%) FHIR
6 3 (0.49%) XML
7 2 (0.33%) AngularJS
7 2 (0.33%) ASP.NET
7 2 (0.33%) Elastic Stack
7 2 (0.33%) jQuery
7 2 (0.33%) JSON
7 2 (0.33%) OAuth
7 2 (0.33%) REST
7 2 (0.33%) SOAP
8 1 (0.16%) ASP.NET MVC
8 1 (0.16%) LINQ
8 1 (0.16%) Oracle Fusion
Miscellaneous
1 240 (39.15%) Self-Motivation
2 33 (5.38%) Social Media
3 30 (4.89%) Product Ownership
4 23 (3.75%) PMI
5 18 (2.94%) FMCG
6 16 (2.61%) Distributed Systems
7 14 (2.28%) Microsoft Licensing
7 14 (2.28%) Team-Oriented Environment
8 11 (1.79%) Analytical Mindset
9 10 (1.63%) Onboarding
10 7 (1.14%) Management Information System
11 6 (0.98%) Cyber Defence
11 6 (0.98%) Operational Technology
12 5 (0.82%) Clustering
12 5 (0.82%) Cyber Threat
12 5 (0.82%) Mobile App
13 4 (0.65%) CMDB
13 4 (0.65%) Enterprise Software
13 4 (0.65%) Security Operations Centre
14 3 (0.49%) Virtual Team
Operating Systems
1 37 (6.04%) Windows
2 14 (2.28%) Windows Vista
3 5 (0.82%) Windows Server
4 4 (0.65%) Linux
5 3 (0.49%) Android
5 3 (0.49%) Apple iOS
6 2 (0.33%) Mac OS
6 2 (0.33%) Windows 10
7 1 (0.16%) Unix
Processes & Methodologies
1 304 (49.59%) Agile
2 285 (46.49%) Problem-Solving
3 266 (43.39%) Mentoring
4 233 (38.01%) Machine Learning
5 228 (37.19%) Data Science
6 224 (36.54%) CI/CD
7 217 (35.40%) Creative Thinking
8 215 (35.07%) Clean Code
8 215 (35.07%) Personalization
9 118 (19.25%) Continuous Improvement
10 67 (10.93%) Analytics
11 66 (10.77%) Roadmaps
12 63 (10.28%) Decision-Making
13 62 (10.11%) Business Strategy
14 59 (9.62%) Project Management
15 58 (9.46%) Coaching
16 55 (8.97%) Product Management
17 54 (8.81%) Service Delivery
18 47 (7.67%) ITIL
19 46 (7.50%) Customer Service
Programming Languages
1 246 (40.13%) Python
2 221 (36.05%) TypeScript
3 26 (4.24%) SQL
4 17 (2.77%) Scala
5 11 (1.79%) JavaScript
6 8 (1.31%) MATLAB
7 4 (0.65%) T-SQL
8 2 (0.33%) C#
8 2 (0.33%) Java
8 2 (0.33%) PowerShell
9 1 (0.16%) Bash
9 1 (0.16%) Bicep
9 1 (0.16%) C
9 1 (0.16%) C++
9 1 (0.16%) Kotlin
9 1 (0.16%) PHP
9 1 (0.16%) PL/SQL
9 1 (0.16%) Shell Script
9 1 (0.16%) Swift
9 1 (0.16%) VBA
Qualifications
1 360 (58.73%) Degree
2 215 (35.07%) PhD
3 63 (10.28%) BPSS Clearance
4 43 (7.01%) Master's Degree
5 28 (4.57%) PMI Certification
6 17 (2.77%) DBS Check
7 14 (2.28%) AWS Certified Cloud Practitioner
8 12 (1.96%) CISSP
9 9 (1.47%) CISM
9 9 (1.47%) Microsoft Certification
9 9 (1.47%) Security Cleared
10 8 (1.31%) AWS Certification
11 7 (1.14%) CBAP
11 7 (1.14%) MBA
12 6 (0.98%) SC Cleared
13 5 (0.82%) Azure Certification
13 5 (0.82%) GIAC
13 5 (0.82%) ITIL Certification
13 5 (0.82%) PMP
14 4 (0.65%) GCIH
Quality Assurance & Compliance
1 19 (3.10%) SLA
2 14 (2.28%) QA
3 12 (1.96%) ISO/IEC 27001
4 8 (1.31%) Data Quality
5 7 (1.14%) GDPR
5 7 (1.14%) NIST
5 7 (1.14%) PMO
6 4 (0.65%) 21 CFR Part 11
6 4 (0.65%) Good Clinical Practice
6 4 (0.65%) P3O
7 3 (0.49%) Actionable Recommendations
7 3 (0.49%) PCI DSS
8 2 (0.33%) Accessibility
8 2 (0.33%) COBIT
8 2 (0.33%) ISO/IEC 20000
9 1 (0.16%) GRC
9 1 (0.16%) MiFID
System Software
1 10 (1.63%) Active Directory
2 7 (1.14%) Docker
3 4 (0.65%) VMware Infrastructure
4 2 (0.33%) Firmware
4 2 (0.33%) Virtual Desktop
4 2 (0.33%) Virtual Machines
4 2 (0.33%) VMware ESXi
5 1 (0.16%) XenApp
5 1 (0.16%) XenDesktop
Systems Management
1 9 (1.47%) Kubernetes
2 2 (0.33%) EnCase
2 2 (0.33%) FTK
2 2 (0.33%) Graylog
2 2 (0.33%) Microsoft Intune
2 2 (0.33%) RSA Security Analytics
2 2 (0.33%) SCCM
2 2 (0.33%) Terraform
3 1 (0.16%) Ansible
3 1 (0.16%) Control-M
3 1 (0.16%) FortiGate
3 1 (0.16%) NetBackup
3 1 (0.16%) Oracle RMAN
3 1 (0.16%) Progress Chef
3 1 (0.16%) Puppet
3 1 (0.16%) ZABBIX
Vendors
1 149 (24.31%) Microsoft
2 44 (7.18%) Google
3 28 (4.57%) SAP
4 19 (3.10%) YouTube
5 16 (2.61%) Apple
6 11 (1.79%) Commvault
7 9 (1.47%) ServiceNow
8 7 (1.14%) Ahrefs
9 6 (0.98%) Cisco
9 6 (0.98%) HubSpot
9 6 (0.98%) Salesforce
9 6 (0.98%) VMware
10 5 (0.82%) Adobe
11 4 (0.65%) Oracle
11 4 (0.65%) Pegasus
11 4 (0.65%) Planview
11 4 (0.65%) Splunk
12 3 (0.49%) Amplitude
12 3 (0.49%) Instagram
12 3 (0.49%) PayPal