Systems or Software Development Life Cycle (SDLC)
UK

The table below provides summary statistics for permanent job vacancies requiring SDLC skills. It includes a benchmarking guide to the annual salaries offered in vacancies that cited SDLC over the 6 months leading up to 31 May 2025, comparing them to the same period in the previous two years.

6 months to
31 May 2025
Same period 2024 Same period 2023
Rank 86 53 53
Rank change year-on-year -33 0 +12
Permanent jobs citing SDLC 1,809 4,496 5,326
As % of all permanent jobs advertised in the UK 3.24% 4.34% 5.56%
As % of the Processes & Methodologies category 3.46% 5.16% 5.82%
Number of salaries quoted 866 1,537 2,759
10th Percentile £45,000 £40,000 £38,750
25th Percentile £48,869 £46,250 £50,000
Median annual salary (50th Percentile) £60,000 £60,000 £60,800
Median % change year-on-year - -1.32% -2.72%
75th Percentile £75,000 £77,500 £80,000
90th Percentile £97,500 £100,000 £95,000
UK excluding London median annual salary £57,500 £55,000 £57,500
% change year-on-year +4.55% -4.35% +4.55%

All Process and Methodology Skills
UK

SDLC falls under the Processes and Methodologies category. For comparison with the information above, the following table provides summary statistics for all permanent job vacancies requiring process or methodology skills.

Permanent vacancies with a requirement for process or methodology skills 52,256 87,133 91,481
As % of all permanent jobs advertised in the UK 93.58% 84.04% 95.51%
Number of salaries quoted 25,854 60,896 54,581
10th Percentile £28,822 £29,250 £34,000
25th Percentile £41,250 £40,000 £45,000
Median annual salary (50th Percentile) £57,000 £55,000 £60,899
Median % change year-on-year +3.64% -9.69% +1.50%
75th Percentile £75,000 £72,500 £81,250
90th Percentile £97,500 £92,500 £100,000
UK excluding London median annual salary £51,564 £50,000 £55,000
% change year-on-year +3.13% -9.09% +4.76%

SDLC
Job Vacancy Trend

Job postings citing SDLC as a proportion of all IT jobs advertised.
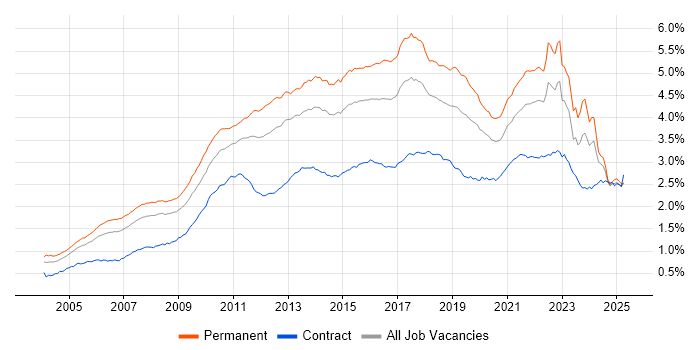
Job vacancy trend for SDLC in the UK

SDLC
Salary Trend

3-month moving average salary quoted in jobs citing SDLC.

Salary trend for SDLC in the UK

SDLC
Salary Histogram

Salary distribution for jobs citing SDLC over the 6 months to 31 May 2025.

Salary histogram for SDLC in the UK

SDLC
Top 17 Job Locations

The table below looks at the demand and provides a guide to the median salaries quoted in IT jobs citing SDLC within the UK over the 6 months to 31 May 2025. The 'Rank Change' column provides an indication of the change in demand within each location based on the same 6 month period last year.

Location Rank Change
on Same Period
Last Year
Matching
Permanent
IT Job Ads
Median Salary
Past 6 Months
Median Salary
% Change
on Same Period
Last Year
Live
Jobs
England +19 1,567 £60,000 - 1,221
UK excluding London -47 1,283 £57,500 +4.55% 756
Work from Home -28 626 £65,000 +8.33% 761
London +43 464 £75,000 -6.25% 612
North of England +9 399 £50,055 -8.99% 194
North West +13 346 £50,055 -16.58% 130
Midlands +44 286 £56,000 +1.82% 114
South East +2 238 £64,000 +11.30% 157
West Midlands +58 167 £55,000 -4.35% 72
Scotland -43 167 £65,000 - 91
East Midlands +29 119 £57,500 +15.00% 40
South West +19 115 £57,500 - 98
East of England -27 55 £52,500 +5.00% 44
Yorkshire -20 34 £70,000 +40.00% 42
Wales -15 25 £69,750 +39.50% 15
North East +23 19 £65,000 +6.12% 25
Northern Ireland +11 2 - - 34

SDLC
Co-occurring Skills and Capabilities by Category

The follow tables expand on the table above by listing co-occurrences grouped by category. The same employment type, locality and period is covered with up to 20 co-occurrences shown in each of the following categories:

Application Platforms
1 190 (10.50%) Confluence
2 42 (2.32%) Apache
3 28 (1.55%) Apache Spark
3 28 (1.55%) CMS
4 22 (1.22%) Apache Airflow
5 15 (0.83%) Appian
5 15 (0.83%) SharePoint
6 9 (0.50%) Drupal
6 9 (0.50%) WordPress
7 8 (0.44%) OpenStack
7 8 (0.44%) Oracle Workflow
8 5 (0.28%) IIS
8 5 (0.28%) Liferay
8 5 (0.28%) Microsoft Exchange
8 5 (0.28%) Tomcat
8 5 (0.28%) WebSphere
9 4 (0.22%) Camunda
9 4 (0.22%) Headless CMS
10 3 (0.17%) EPiServer
10 3 (0.17%) Kentico
Applications
1 11 (0.61%) Microsoft Excel
1 11 (0.61%) Microsoft Office
1 11 (0.61%) MS Visio
2 9 (0.50%) Microsoft Project
3 7 (0.39%) Chatbot
4 5 (0.28%) Blender
4 5 (0.28%) Microsoft PowerPoint
5 4 (0.22%) Trello
6 2 (0.11%) EngageOne
7 1 (0.055%) Adobe XD
7 1 (0.055%) Simulink
Business Applications
1 20 (1.11%) Dynamics CRM
2 13 (0.72%) Shopify
3 10 (0.55%) Magento
4 8 (0.44%) Endur
5 4 (0.22%) Remedy ITSM
6 3 (0.17%) Payment Gateway
6 3 (0.17%) SAP S/4HANA
7 2 (0.11%) Refinitiv Enterprise Platform
7 2 (0.11%) Sage 1000
7 2 (0.11%) SAP PP
7 2 (0.11%) SimCorp Dimension
8 1 (0.055%) Dynamics NAV
8 1 (0.055%) Oracle EBS
8 1 (0.055%) Oracle EBS R12
8 1 (0.055%) Oracle ERP
8 1 (0.055%) Sage 200
8 1 (0.055%) SAP Business One
8 1 (0.055%) SAP GRC
8 1 (0.055%) TrackWise
8 1 (0.055%) Visualfiles
Cloud Services
1 529 (29.24%) Azure
2 503 (27.81%) AWS
3 237 (13.10%) GCP
4 94 (5.20%) Azure DevOps
5 63 (3.48%) Serverless
6 53 (2.93%) SaaS
7 48 (2.65%) GitHub
8 46 (2.54%) Power Platform
9 38 (2.10%) Amazon S3
10 34 (1.88%) Cloud Computing
11 32 (1.77%) Power Automate
12 30 (1.66%) Amazon EKS
12 30 (1.66%) PaaS
13 25 (1.38%) Amazon EC2
14 23 (1.27%) Azure Logic Apps
14 23 (1.27%) Dynamics 365
15 21 (1.16%) PowerApps
16 20 (1.11%) AWS Lambda
16 20 (1.11%) Microsoft 365
17 17 (0.94%) Datadog
Communications & Networking
1 17 (0.94%) 5G
2 15 (0.83%) HTTP
3 14 (0.77%) Network Security
4 13 (0.72%) SD-WAN
4 13 (0.72%) WAN
5 11 (0.61%) VPN
6 9 (0.50%) Firewall
6 9 (0.50%) Multicast
7 6 (0.33%) Internet
7 6 (0.33%) TCP/IP
8 5 (0.28%) DNS
8 5 (0.28%) Wireless
8 5 (0.28%) ZigBee
9 4 (0.22%) 3GPP
9 4 (0.22%) Wi-Fi
10 3 (0.17%) SSL
11 2 (0.11%) Broadband
11 2 (0.11%) DHCP
11 2 (0.11%) Ethernet
11 2 (0.11%) SAN
Database & Business Intelligence
1 348 (19.24%) SQL Server
2 72 (3.98%) NoSQL
3 61 (3.37%) Relational Database
4 42 (2.32%) PostgreSQL
5 30 (1.66%) MongoDB
6 22 (1.22%) MySQL
6 22 (1.22%) Power BI
7 21 (1.16%) Big Data
8 19 (1.05%) Data Warehouse
9 18 (1.00%) Redis
10 16 (0.88%) RDBMS
11 15 (0.83%) Amazon Redshift
11 15 (0.83%) Data Lake
11 15 (0.83%) KDB
11 15 (0.83%) SQL Server Reporting Services
12 14 (0.77%) Apache Hive
13 13 (0.72%) Apache Cassandra
13 13 (0.72%) Elasticsearch
13 13 (0.72%) Oracle Database
14 12 (0.66%) Amazon Athena
Development Applications
1 368 (20.34%) JIRA
2 292 (16.14%) Selenium
3 276 (15.26%) Maven
4 274 (15.15%) GitLab
5 271 (14.98%) Cucumber
6 263 (14.54%) SonarQube
7 250 (13.82%) Bitbucket
8 248 (13.71%) Sonatype Nexus
9 132 (7.30%) Git
10 80 (4.42%) Jenkins
11 53 (2.93%) JUnit
12 29 (1.60%) Eclipse
13 28 (1.55%) Visual Studio
14 27 (1.49%) Cypress.io
14 27 (1.49%) Postman
15 26 (1.44%) Eclipse RCP
15 26 (1.44%) Mockito
16 14 (0.77%) IntelliJ
16 14 (0.77%) JMeter
16 14 (0.77%) SoapUI
General
1 737 (40.74%) Finance
2 529 (29.24%) Inclusion and Diversity
3 471 (26.04%) Banking
4 305 (16.86%) Social Skills
5 288 (15.92%) Law
6 169 (9.34%) Aerospace
7 148 (8.18%) Analytical Skills
8 138 (7.63%) Retail
9 132 (7.30%) Avionics
10 124 (6.85%) Investment Banking
11 113 (6.25%) Marketing
12 90 (4.98%) Corporate Banking
13 73 (4.04%) Public Sector
14 36 (1.99%) Legal
15 29 (1.60%) Organisational Skills
16 23 (1.27%) Front Office
16 23 (1.27%) Games
16 23 (1.27%) Manufacturing
17 20 (1.11%) Telecoms
18 12 (0.66%) Electronics
Job Titles
1 596 (32.95%) Software Engineer
2 409 (22.61%) Senior
3 264 (14.59%) Developer
4 234 (12.94%) Lead
5 139 (7.68%) Systems Engineer
6 134 (7.41%) Java Engineer
7 132 (7.30%) Senior Systems Engineer
8 108 (5.97%) Architect
9 95 (5.25%) Lead Software Engineer
10 91 (5.03%) Java Software Engineer
11 84 (4.64%) Senior Software Engineer
12 81 (4.48%) Analyst
12 81 (4.48%) Senior Developer
13 79 (4.37%) Principal Engineer
14 68 (3.76%) Software Architect
15 61 (3.37%) Java Developer
16 58 (3.21%) Software Developer
17 55 (3.04%) Software Manager
18 52 (2.87%) Senior Java Engineer
19 50 (2.76%) Python Engineer
Libraries, Frameworks & Software Standards
1 402 (22.22%) React
2 384 (21.23%) Spring
3 358 (19.79%) HTML
4 356 (19.68%) CSS
5 348 (19.24%) Kafka
6 328 (18.13%) Spring Boot
7 260 (14.37%) JPA
8 255 (14.10%) Redux
9 176 (9.73%) Hibernate
9 176 (9.73%) REST
10 172 (9.51%) .NET
11 157 (8.68%) RESTful
12 112 (6.19%) Middleware
13 108 (5.97%) Jest
14 103 (5.69%) HTML5
15 98 (5.42%) Sass
16 97 (5.36%) CSS3
17 67 (3.70%) AngularJS
18 56 (3.10%) Node.js
19 48 (2.65%) ASP.NET
Miscellaneous
1 333 (18.41%) Product Ownership
2 282 (15.59%) Enterprise Software
3 120 (6.63%) Cloud Native
4 117 (6.47%) Algorithms
5 65 (3.59%) Distributed Systems
6 53 (2.93%) Mobile App
7 51 (2.82%) Management Information System
8 46 (2.54%) Public Cloud
9 43 (2.38%) Hybrid Cloud
10 29 (1.60%) Security Posture
11 28 (1.55%) Data Structures
11 28 (1.55%) Greenfield Project
12 26 (1.44%) Legacy Systems
13 25 (1.38%) Self-Motivation
14 23 (1.27%) Derivative
15 22 (1.22%) Client/Server
16 20 (1.11%) Reinsurance
17 18 (1.00%) Analytical Mindset
17 18 (1.00%) Equities
17 18 (1.00%) Onboarding
Operating Systems
1 126 (6.97%) Linux
2 55 (3.04%) Windows
3 38 (2.10%) Unix
4 15 (0.83%) Android
5 10 (0.55%) Apple iOS
6 8 (0.44%) Windows Server
7 5 (0.28%) Rocky
8 3 (0.17%) Red Hat Enterprise Linux
8 3 (0.17%) Robot Operating System
9 2 (0.11%) Ubuntu
9 2 (0.11%) Windows Vista
10 1 (0.055%) Debian
10 1 (0.055%) Embedded Linux
10 1 (0.055%) Mac OS
10 1 (0.055%) Solaris
Processes & Methodologies
1 1,106 (61.14%) Agile
2 849 (46.93%) Software Engineering
3 646 (35.71%) CI/CD
4 571 (31.56%) DevOps
5 461 (25.48%) Continuous Improvement
6 438 (24.21%) Test Automation
7 409 (22.61%) Microservices
8 353 (19.51%) Full-Stack Development
9 333 (18.41%) Mentoring
10 311 (17.19%) Containerisation
11 285 (15.75%) Front End Development
12 259 (14.32%) Computer Science
13 257 (14.21%) Performance Optimisation
13 257 (14.21%) Problem-Solving
14 247 (13.65%) Software Testing
15 235 (12.99%) TDD
16 227 (12.55%) Artificial Intelligence
17 219 (12.11%) Waterfall
18 185 (10.23%) Clean Code
19 177 (9.78%) User Experience
Programming Languages
1 676 (37.37%) Java
2 556 (30.74%) SQL
3 439 (24.27%) JavaScript
4 336 (18.57%) Python
5 212 (11.72%) C#
6 173 (9.56%) TypeScript
7 83 (4.59%) C++
8 55 (3.04%) C
9 51 (2.82%) Ada
10 47 (2.60%) PowerShell
11 46 (2.54%) Go
12 33 (1.82%) Rust
13 29 (1.60%) Bash
14 25 (1.38%) PHP
15 24 (1.33%) Kotlin
16 21 (1.16%) Scala
17 17 (0.94%) Shell Script
18 16 (0.88%) PL/SQL
19 13 (0.72%) T-SQL
20 10 (0.55%) Fortran
Qualifications
1 610 (33.72%) Degree
2 369 (20.40%) BPSS Clearance
3 137 (7.57%) Computer Science Degree
4 67 (3.70%) Chartered Engineer
5 63 (3.48%) Security Cleared
6 57 (3.15%) Master's Degree
7 49 (2.71%) SC Cleared
8 22 (1.22%) Azure Certification
9 21 (1.16%) PhD
10 19 (1.05%) DV Cleared
11 17 (0.94%) ISTQB
12 16 (0.88%) AWS Certification
13 11 (0.61%) CISSP
14 10 (0.55%) Microsoft Certification
14 10 (0.55%) PMI Certification
15 9 (0.50%) ISTQB Foundation Certification
16 7 (0.39%) PMP
16 7 (0.39%) TOGAF Certification
17 6 (0.33%) CCSP
17 6 (0.33%) Cisco Certification
Quality Assurance & Compliance
1 351 (19.40%) QA
2 108 (5.97%) Accessibility
3 67 (3.70%) ISO/IEC 12207
4 56 (3.10%) ISO/IEC 27001
5 39 (2.16%) GDPR
6 38 (2.10%) NIST
7 30 (1.66%) NCSC
8 18 (1.00%) SOC 2
9 17 (0.94%) HIPAA
10 15 (0.83%) PMO
11 7 (0.39%) Data Quality
11 7 (0.39%) Software Quality Assurance
12 6 (0.33%) COBIT
12 6 (0.33%) PCI DSS
13 3 (0.17%) GRC
13 3 (0.17%) ISO 9001
13 3 (0.17%) PMBOK
13 3 (0.17%) Sarbanes-Oxley
14 2 (0.11%) Cyber Essentials
14 2 (0.11%) ISO/IEC 27002 (supersedes ISO/IEC 17799)
System Software
1 379 (20.95%) Docker
2 15 (0.83%) Virtual Machines
3 9 (0.50%) Active Directory
4 7 (0.39%) Firmware
5 6 (0.33%) vSphere
6 5 (0.28%) Apache Flume
6 5 (0.28%) VMware Infrastructure
7 3 (0.17%) HDFS
7 3 (0.17%) VMware ESXi
8 2 (0.11%) KVM
8 2 (0.11%) Xen
9 1 (0.055%) Embedded Firmware
Systems Management
1 421 (23.27%) Kubernetes
2 99 (5.47%) Terraform
3 33 (1.82%) Ansible
4 30 (1.66%) Grafana
5 21 (1.16%) Prometheus
6 6 (0.33%) Mesos
6 6 (0.33%) Progress Chef
6 6 (0.33%) Puppet
7 5 (0.28%) HP Fortify
7 5 (0.28%) Oozie
8 3 (0.17%) Argo
8 3 (0.17%) HP Quality Center
8 3 (0.17%) Single Sign-On
9 2 (0.11%) CFEngine
9 2 (0.11%) HAProxy
9 2 (0.11%) ITRS Geneos
9 2 (0.11%) Kibana
9 2 (0.11%) Netcool
9 2 (0.11%) Netcool/OMNIbus
9 2 (0.11%) Tivoli
Vendors
1 252 (13.93%) Solace
2 166 (9.18%) Microsoft
3 112 (6.19%) Oracle
4 89 (4.92%) Siemens
5 53 (2.93%) Google
6 41 (2.27%) IBM
7 24 (1.33%) Splunk
8 22 (1.22%) Databricks
8 22 (1.22%) SAP
9 21 (1.16%) Salesforce
10 20 (1.11%) ServiceNow
11 18 (1.00%) Red Hat
12 16 (0.88%) Dynatrace
13 12 (0.66%) Sybase
14 10 (0.55%) Bloomberg
14 10 (0.55%) OpenAI
15 8 (0.44%) OpenLink
15 8 (0.44%) TIBCO
16 7 (0.39%) Cloudera
16 7 (0.39%) VMware