Self-Motivation Jobs

Self-Motivation
UK

The table below looks at the prevalence of the term Self-Motivation in permanent job vacancies. Included is a benchmarking guide to the salaries offered in vacancies that cited Self-Motivation over the 6 months leading up to 11 May 2025, comparing them to the same period in the previous two years.

6 months to
11 May 2025
Same period 2024 Same period 2023
Rank 138 66 116
Rank change year-on-year -72 +50 -29
Permanent jobs citing Self-Motivation 1,278 3,690 3,038
As % of all permanent jobs advertised in the UK 2.34% 3.72% 3.01%
As % of the Miscellaneous category 6.58% 10.49% 6.91%
Number of salaries quoted 568 2,216 1,645
10th Percentile £26,250 £24,046 £27,500
25th Percentile £32,500 £27,500 £36,250
Median annual salary (50th Percentile) £47,500 £40,000 £52,500
Median % change year-on-year +18.75% -23.81% -
75th Percentile £67,500 £56,250 £72,500
90th Percentile £83,000 £70,000 £87,500
UK excluding London median annual salary £42,500 £36,500 £47,500
% change year-on-year +16.44% -23.16% +5.56%

All Generic Skills
UK

Self-Motivation falls under the General and Transferable Skills category. For comparison with the information above, the following table provides summary statistics for all permanent job vacancies requiring generic IT skills.

Permanent vacancies with a requirement for generic IT skills 19,436 35,193 43,934
As % of all permanent jobs advertised in the UK 35.52% 35.47% 43.49%
Number of salaries quoted 10,068 23,064 23,448
10th Percentile £31,250 £28,000 £35,015
25th Percentile £42,500 £38,000 £46,250
Median annual salary (50th Percentile) £60,000 £55,000 £65,000
Median % change year-on-year +9.09% -15.38% +4.00%
75th Percentile £79,500 £75,000 £86,250
90th Percentile £110,000 £97,500 £108,000
UK excluding London median annual salary £55,000 £50,000 £55,000
% change year-on-year +10.00% -9.09% +4.76%

Self-Motivation
Job Vacancy Trend

Job postings citing Self-Motivation as a proportion of all IT jobs advertised.
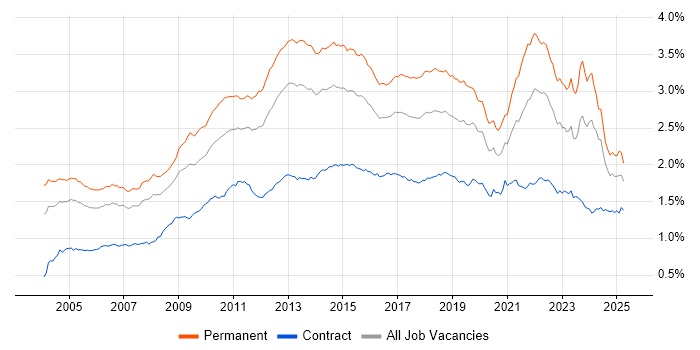
Job vacancy trend for Self-Motivation in the UK

Self-Motivation
Salary Trend

3-month moving average salary quoted in jobs citing Self-Motivation.

Salary trend for Self-Motivation in the UK

Self-Motivation
Salary Histogram

Salary distribution for jobs citing Self-Motivation over the 6 months to 11 May 2025.

Salary histogram for Self-Motivation in the UK

Self-Motivation
Top 17 Job Locations

The table below looks at the demand and provides a guide to the median salaries quoted in IT jobs citing Self-Motivation within the UK over the 6 months to 11 May 2025. The 'Rank Change' column provides an indication of the change in demand within each location based on the same 6 month period last year.

Location Rank Change
on Same Period
Last Year
Matching
Permanent
IT Job Ads
Median Salary
Past 6 Months
Median Salary
% Change
on Same Period
Last Year
Live
Jobs
England -78 1,094 £47,500 +18.75% 2,471
UK excluding London -81 837 £42,500 +16.44% 1,716
Work from Home -9 513 £52,500 +7.14% 1,244
North of England -30 353 £37,500 +7.14% 448
London -74 282 £57,500 +6.48% 1,068
North West -39 263 £47,500 +35.71% 258
South East -123 150 £60,000 +62.16% 499
East of England -31 121 £38,890 +17.85% 164
Midlands -111 101 £42,500 +13.33% 250
Yorkshire +7 77 £26,500 -24.29% 147
South West -53 75 £40,000 -2.94% 191
West Midlands -74 61 £40,000 +14.29% 152
East Midlands -65 39 £42,500 +6.25% 89
Wales -1 19 £70,000 +37.65% 52
Scotland +62 15 £48,961 +63.20% 128
North East +13 13 £45,000 +39.53% 48
Isle of Man - 3 £38,000 -

Self-Motivation
Co-occurring Skills and Capabilities by Category

The follow tables expand on the table above by listing co-occurrences grouped by category. The same employment type, locality and period is covered with up to 20 co-occurrences shown in each of the following categories:

Application Platforms
1 51 (3.99%) SharePoint
2 30 (2.35%) Microsoft Exchange
3 16 (1.25%) IIS
4 10 (0.78%) WordPress
5 7 (0.55%) Tomcat
6 6 (0.47%) Confluence
6 6 (0.47%) Drupal
7 4 (0.31%) Apache
7 4 (0.31%) Liferay
8 2 (0.16%) CMS
8 2 (0.16%) Oracle Workflow
8 2 (0.16%) SAS
8 2 (0.16%) Skype for Business
9 1 (0.078%) Joomla!
9 1 (0.078%) Oracle SOA Suite
9 1 (0.078%) Umbraco
Applications
1 145 (11.35%) Microsoft Office
2 67 (5.24%) Microsoft Excel
3 32 (2.50%) Microsoft PowerPoint
4 7 (0.55%) MS Visio
4 7 (0.55%) Revit
5 5 (0.39%) Microsoft Project
6 4 (0.31%) SOLIDWORKS
7 3 (0.23%) Adobe Premiere
7 3 (0.23%) Final Cut Pro
7 3 (0.23%) Simulink
8 2 (0.16%) Blender
8 2 (0.16%) GNU Octave
9 1 (0.078%) Adobe Illustrator
9 1 (0.078%) AutoCAD
9 1 (0.078%) Chatbot
9 1 (0.078%) OrCAD
9 1 (0.078%) Photoshop
9 1 (0.078%) Spreadsheet
9 1 (0.078%) Trello
Business Applications
1 11 (0.86%) Salesforce CRM
2 10 (0.78%) Teamcenter
3 8 (0.63%) NetSuite
4 6 (0.47%) Dynamics CRM
5 5 (0.39%) CiviCRM
5 5 (0.39%) Remedy ITSM
5 5 (0.39%) Sage 200
5 5 (0.39%) Sage CRM
6 4 (0.31%) SAP GTS
7 3 (0.23%) SAP ERP
7 3 (0.23%) SAP S/4HANA
8 1 (0.078%) Dynamics AX
8 1 (0.078%) LabWindows
8 1 (0.078%) Magento
8 1 (0.078%) Oracle EBS
8 1 (0.078%) Oracle HRMS
8 1 (0.078%) Oracle iRecruitment
8 1 (0.078%) SAP GRC
8 1 (0.078%) Shopify
Cloud Services
1 289 (22.61%) Azure
2 242 (18.94%) AWS
3 193 (15.10%) GCP
4 88 (6.89%) Microsoft 365
5 83 (6.49%) SaaS
6 32 (2.50%) Google Analytics
7 30 (2.35%) Power Platform
8 26 (2.03%) Entra ID
9 25 (1.96%) OneDrive
10 22 (1.72%) Microsoft Copilot
11 14 (1.10%) Adobe Analytics
12 13 (1.02%) Azure DevOps
13 12 (0.94%) Google Ads
14 11 (0.86%) Cloud Computing
14 11 (0.86%) Power Automate
15 10 (0.78%) Google Workspace
16 9 (0.70%) Canva
17 8 (0.63%) Figma
17 8 (0.63%) GitHub
18 7 (0.55%) PowerApps
Communications & Networking
1 80 (6.26%) Firewall
2 37 (2.90%) WAN
3 31 (2.43%) Intrusion Detection
4 30 (2.35%) TCP/IP
5 29 (2.27%) Wi-Fi
6 27 (2.11%) SD-WAN
7 25 (1.96%) DNS
8 20 (1.56%) 5G
9 19 (1.49%) LAN
10 18 (1.41%) Network Security
11 17 (1.33%) DHCP
12 15 (1.17%) VPN
13 14 (1.10%) SSL
13 14 (1.10%) VLAN
13 14 (1.10%) Wireless
14 13 (1.02%) Internet
15 11 (0.86%) HTTP
15 11 (0.86%) IPsec
16 10 (0.78%) DMARC
16 10 (0.78%) WebEx
Database & Business Intelligence
1 54 (4.23%) SQL Server
2 20 (1.56%) PostgreSQL
2 20 (1.56%) Power BI
2 20 (1.56%) Tableau
3 14 (1.10%) Relational Database
4 11 (0.86%) MySQL
5 9 (0.70%) NoSQL
6 7 (0.55%) OLTP
7 6 (0.47%) Metadata
7 6 (0.47%) SQL Server Integration Services
7 6 (0.47%) SQL Server Reporting Services
8 5 (0.39%) Amazon RDS
8 5 (0.39%) Data Warehouse
8 5 (0.39%) MariaDB
8 5 (0.39%) RDBMS
9 4 (0.31%) Azure SQL Database
9 4 (0.31%) MongoDB
10 3 (0.23%) Data Mining
10 3 (0.23%) GIS
10 3 (0.23%) SQL Server Analysis Services
Development Applications
1 30 (2.35%) Git
2 19 (1.49%) JIRA
3 13 (1.02%) Rational DOORS
4 8 (0.63%) Subversion
4 8 (0.63%) Visual Studio
5 6 (0.47%) LabVIEW
6 5 (0.39%) Maven
7 4 (0.31%) Selenium
8 3 (0.23%) Appium
8 3 (0.23%) Cucumber
8 3 (0.23%) GDB
8 3 (0.23%) GitLab
8 3 (0.23%) JMeter
8 3 (0.23%) Postman
9 2 (0.16%) Axure RP
9 2 (0.16%) Babel
9 2 (0.16%) Mocha
9 2 (0.16%) webpack
10 1 (0.078%) Cypress.io
10 1 (0.078%) Team Foundation Server
General
1 632 (49.45%) Social Skills
2 256 (20.03%) Finance
3 245 (19.17%) Inclusion and Diversity
4 228 (17.84%) Analytical Skills
5 163 (12.75%) Marketing
6 130 (10.17%) Organisational Skills
7 115 (9.00%) Electronics
8 98 (7.67%) Presentation Skills
9 64 (5.01%) Advertising
10 61 (4.77%) Legal
11 48 (3.76%) Public Sector
12 42 (3.29%) Law
12 42 (3.29%) Manufacturing
13 38 (2.97%) Banking
13 38 (2.97%) Retail
14 31 (2.43%) Telecoms
15 22 (1.72%) Games
16 20 (1.56%) Local Government
17 14 (1.10%) Documentation Skills
18 11 (0.86%) Influencing Skills
Job Titles
1 283 (22.14%) Senior
2 193 (15.10%) Software Engineer
3 178 (13.93%) Senior Software Engineer
4 129 (10.09%) Business Manager
5 126 (9.86%) Development Manager
6 125 (9.78%) Business Development Manager
7 99 (7.75%) Analyst
8 70 (5.48%) Developer
9 69 (5.40%) IT Support
10 58 (4.54%) Lead
11 54 (4.23%) Support Engineer
12 43 (3.36%) Account Executive
12 43 (3.36%) IT Engineer
13 38 (2.97%) Technical Support
14 36 (2.82%) IT Manager
15 35 (2.74%) IT Support Engineer
15 35 (2.74%) Senior Developer
16 34 (2.66%) Architect
16 34 (2.66%) Consultant
17 32 (2.50%) Sales Executive
Libraries, Frameworks & Software Standards
1 201 (15.73%) .NET
2 183 (14.32%) Node.js
3 36 (2.82%) HTML
4 16 (1.25%) JSON
5 14 (1.10%) CSS
6 13 (1.02%) Blazor
6 13 (1.02%) React
7 11 (0.86%) REST
8 10 (0.78%) XML
9 9 (0.70%) Bootstrap
9 9 (0.70%) HTML5
9 9 (0.70%) RESTful
9 9 (0.70%) SOAP
10 6 (0.47%) WinForms
11 5 (0.39%) AngularJS
12 4 (0.31%) EDI
12 4 (0.31%) FIX Protocol
12 4 (0.31%) pytest
12 4 (0.31%) Web Services
12 4 (0.31%) WPF
Miscellaneous
1 183 (14.32%) Linux Command Line
2 178 (13.93%) Cyberattack
3 89 (6.96%) Social Media
4 63 (4.93%) Management Information System
5 49 (3.83%) Onboarding
6 45 (3.52%) Team-Oriented Environment
7 34 (2.66%) Mobile App
8 29 (2.27%) Driving Licence
9 26 (2.03%) Data Centre
10 24 (1.88%) Security Posture
11 22 (1.72%) Virtual Team
12 18 (1.41%) Enterprise Software
12 18 (1.41%) Self-Driving Car
13 17 (1.33%) Blog
14 16 (1.25%) Algorithms
15 14 (1.10%) Product Ownership
15 14 (1.10%) Video Conferencing
16 11 (0.86%) CCTV
16 11 (0.86%) FMCG
17 10 (0.78%) FPGA
Operating Systems
1 247 (19.33%) Linux
2 189 (14.79%) Windows
3 51 (3.99%) Windows Server
4 35 (2.74%) Windows Vista
5 24 (1.88%) Android
6 23 (1.80%) Unix
7 20 (1.56%) Mac OS
8 19 (1.49%) Windows 10
9 13 (1.02%) Apple iOS
10 10 (0.78%) Windows Server 2019
11 6 (0.47%) Windows 7
11 6 (0.47%) zOS
12 3 (0.23%) Embedded Linux
12 3 (0.23%) Mac OS X
13 2 (0.16%) Red Hat Enterprise Linux
13 2 (0.16%) Windows Server 2003
13 2 (0.16%) Windows Server 2012
14 1 (0.078%) Debian
14 1 (0.078%) VMS
Processes & Methodologies
1 428 (33.49%) Problem-Solving
2 299 (23.40%) Agile
3 249 (19.48%) Mentoring
4 239 (18.70%) Business Development
5 231 (18.08%) Customer Service
6 229 (17.92%) Software Engineering
7 209 (16.35%) Cloud Security
8 202 (15.81%) User Experience
9 191 (14.95%) Machine Learning
10 184 (14.40%) Scrum
11 182 (14.24%) Microservices
12 181 (14.16%) Site Reliability Engineering
13 180 (14.08%) Data Engineering
14 171 (13.38%) Decision-Making
15 153 (11.97%) B2B
16 121 (9.47%) Project Management
17 118 (9.23%) Business Enablement
18 113 (8.84%) Computer Science
18 113 (8.84%) CRM
19 101 (7.90%) Continuous Improvement
Programming Languages
1 253 (19.80%) Python
2 233 (18.23%) Java
3 225 (17.61%) JavaScript
4 212 (16.59%) C++
5 180 (14.08%) Rust
6 178 (13.93%) Go
7 132 (10.33%) SQL
8 33 (2.58%) C#
9 31 (2.43%) C
10 23 (1.80%) PowerShell
11 19 (1.49%) MATLAB
12 13 (1.02%) PL/SQL
12 13 (1.02%) TypeScript
13 12 (0.94%) T-SQL
14 11 (0.86%) VBA
15 10 (0.78%) Bash
16 9 (0.70%) R
17 7 (0.55%) PHP
18 5 (0.39%) Clojure
18 5 (0.39%) Embedded C
Qualifications
1 292 (22.85%) Degree
2 222 (17.37%) Security Cleared
3 186 (14.55%) DV Cleared
4 183 (14.32%) AWS Certification
5 181 (14.16%) AWS Certified Solutions Architect
6 178 (13.93%) AWS Certified Developer
7 88 (6.89%) Master's Degree
8 65 (5.09%) DBS Check
9 44 (3.44%) Cisco Certification
10 43 (3.36%) Computer Science Degree
11 34 (2.66%) CISSP
12 31 (2.43%) CISM
13 26 (2.03%) CISA
14 25 (1.96%) Microsoft Certification
15 24 (1.88%) SC Cleared
16 23 (1.80%) (ISC)2 CCSP
17 21 (1.64%) CEH
18 17 (1.33%) PhD
19 15 (1.17%) MCSA
20 14 (1.10%) BPSS Clearance
Quality Assurance & Compliance
1 48 (3.76%) ISO/IEC 27001
2 38 (2.97%) GDPR
3 24 (1.88%) Accessibility
3 24 (1.88%) NIST
4 23 (1.80%) SLA
5 16 (1.25%) QA
6 13 (1.02%) PMO
7 12 (0.94%) Data Quality
8 11 (0.86%) Cyber Essentials
9 9 (0.70%) Cyber Essentials PLUS
10 7 (0.55%) ISO 9001
10 7 (0.55%) ISO/IEC 27002 (supersedes ISO/IEC 17799)
11 6 (0.47%) Sarbanes-Oxley
12 5 (0.39%) NCSC
13 4 (0.31%) Software Quality Assurance
14 3 (0.23%) GRC
14 3 (0.23%) IEC 61508
14 3 (0.23%) JTAG
14 3 (0.23%) PCI DSS
15 2 (0.16%) ISO 26262
System Software
1 63 (4.93%) Active Directory
2 17 (1.33%) Hyper-V
2 17 (1.33%) VMware Infrastructure
3 13 (1.02%) Docker
4 12 (0.94%) Firmware
5 7 (0.55%) Citrix Hypervisor
5 7 (0.55%) Virtual Servers
6 6 (0.47%) Embedded Firmware
7 3 (0.23%) Virtual Desktop
7 3 (0.23%) vSphere
8 2 (0.16%) VMware ESXi
9 1 (0.078%) HDFS
9 1 (0.078%) Veritas Cluster Server
9 1 (0.078%) Virtual Machines
9 1 (0.078%) VMware NSX
Systems Management
1 24 (1.88%) Microsoft Intune
2 15 (1.17%) Terraform
3 10 (0.78%) Single Sign-On
4 9 (0.70%) Ansible
4 9 (0.70%) SCCM
5 8 (0.63%) Kubernetes
6 7 (0.55%) PaperCut
7 4 (0.31%) FortiGate
8 3 (0.23%) Functional Safety
9 2 (0.16%) Grafana
9 2 (0.16%) RSA Archer
9 2 (0.16%) SCOM
9 2 (0.16%) SCOrch
9 2 (0.16%) SCSM
10 1 (0.078%) CSIRT
10 1 (0.078%) EMC NetWorker
10 1 (0.078%) Nessus
10 1 (0.078%) NetBackup
10 1 (0.078%) Tivoli Storage Manager
10 1 (0.078%) WSUS
Vendors
1 264 (20.66%) Microsoft
2 60 (4.69%) Google
3 54 (4.23%) Salesforce
4 44 (3.44%) YouTube
5 35 (2.74%) Oracle
6 31 (2.43%) Citrix
7 26 (2.03%) Intel
8 24 (1.88%) Adobe
8 24 (1.88%) VMware
9 22 (1.72%) Cisco
10 19 (1.49%) ServiceNow
11 18 (1.41%) SAP
12 17 (1.33%) Pure Storage
13 16 (1.25%) Zoho
14 14 (1.10%) Apple
14 14 (1.10%) Marketo
14 14 (1.10%) Salesforce Marketing Cloud
15 13 (1.02%) Epicor
16 12 (0.94%) HP
17 11 (0.86%) IBM