Computer Science Degree Jobs

Computer Science Degree
UK

The table below provides summary statistics for permanent job vacancies with a requirement for Computer Science Degree qualifications. It includes a benchmarking guide to the salaries offered over the 6 months leading up to 28 May 2025, comparing them to the same period in the previous two years.

6 months to
28 May 2025
Same period 2024 Same period 2023
Rank 75 107 154
Rank change year-on-year +32 +47 -35
Permanent jobs citing Computer Science Degree 1,941 2,491 2,277
As % of all permanent jobs advertised in the UK 3.55% 2.44% 2.33%
As % of the Qualifications category 7.22% 9.02% 7.00%
Number of salaries quoted 707 1,864 1,444
10th Percentile £31,750 £32,500 £36,250
25th Percentile £44,250 £41,250 £47,500
Median annual salary (50th Percentile) £65,000 £60,000 £60,899
Median % change year-on-year +8.33% -1.48% +1.50%
75th Percentile £80,000 £80,000 £85,000
90th Percentile £99,850 £92,500 £105,000
UK excluding London median annual salary £55,000 £52,500 £60,800
% change year-on-year +4.76% -13.65% +21.60%

All Academic and Professional Certifications
UK

Computer Science Degree falls under the Academic Qualifications and Professional Certifications category. For comparison with the information above, the following table provides summary statistics for all permanent job vacancies requiring academic qualifications or professional certifications.

Permanent vacancies requiring academic qualifications or professional certifications 26,899 27,630 32,541
As % of all permanent jobs advertised in the UK 49.19% 27.05% 33.23%
Number of salaries quoted 10,865 17,234 14,697
10th Percentile £31,750 £28,500 £31,973
25th Percentile £43,750 £38,501 £42,250
Median annual salary (50th Percentile) £55,000 £54,000 £60,000
Median % change year-on-year +1.85% -10.00% +9.09%
75th Percentile £68,568 £71,000 £77,500
90th Percentile £82,500 £87,500 £95,000
UK excluding London median annual salary £52,500 £50,000 £52,500
% change year-on-year +5.00% -4.76% +5.00%

Computer Science Degree
Job Vacancy Trend

Job postings citing Computer Science Degree as a proportion of all IT jobs advertised.
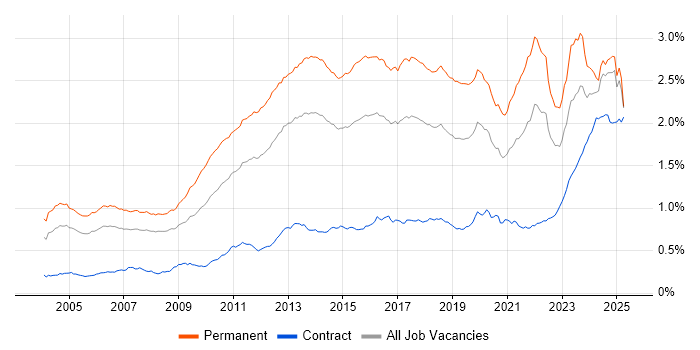
Job vacancy trend for Computer Science Degree in the UK

Computer Science Degree
Salary Trend

3-month moving average salary quoted in jobs citing Computer Science Degree.

Salary trend for Computer Science Degree in the UK

Computer Science Degree
Salary Histogram

Salary distribution for jobs citing Computer Science Degree over the 6 months to 28 May 2025.

Salary histogram for Computer Science Degree in the UK

Computer Science Degree
Top 17 Job Locations

The table below looks at the demand and provides a guide to the median salaries quoted in IT jobs citing Computer Science Degree within the UK over the 6 months to 28 May 2025. The 'Rank Change' column provides an indication of the change in demand within each location based on the same 6 month period last year.

Location Rank Change
on Same Period
Last Year
Matching
Permanent
IT Job Ads
Median Salary
Past 6 Months
Median Salary
% Change
on Same Period
Last Year
Live
Jobs
England +35 1,831 £65,000 +8.33% 4,914
Work from Home +82 1,063 £60,000 - 2,256
UK excluding London +11 1,020 £55,000 +4.76% 4,439
London +22 597 £75,000 - 1,125
South East +10 362 £70,000 +16.67% 1,343
North of England -36 221 £57,500 +15.00% 926
Midlands +40 196 £35,000 -30.00% 788
West Midlands +62 141 £35,000 -36.36% 440
East of England +43 125 £52,000 +30.00% 651
Yorkshire +17 105 £60,000 +30.43% 351
North West -86 95 £58,500 +17.00% 440
South West +40 67 £55,000 +15.79% 452
East Midlands +21 52 £35,000 -26.32% 301
North East +48 21 £56,500 +7.62% 139
Scotland +20 20 £51,914 -9.71% 237
Northern Ireland +39 15 £110,000 +171.60% 80
Wales +39 14 £73,000 +114.71% 121

Computer Science Degree
Co-occurring Skills and Capabilities by Category

The follow tables expand on the table above by listing co-occurrences grouped by category. The same employment type, locality and period is covered with up to 20 co-occurrences shown in each of the following categories:

Application Platforms
1 27 (1.39%) SharePoint
2 23 (1.18%) Jupyter
3 22 (1.13%) Apache Spark
4 18 (0.93%) Apache Airflow
5 17 (0.88%) CMS
6 14 (0.72%) Apache
6 14 (0.72%) Microsoft Exchange
6 14 (0.72%) WordPress
7 9 (0.46%) IIS
8 6 (0.31%) SAS
9 5 (0.26%) Luigi
10 4 (0.21%) Confluence
11 2 (0.10%) NServiceBus
11 2 (0.10%) SharePoint Server
11 2 (0.10%) ThingWorx
11 2 (0.10%) Umbraco
12 1 (0.052%) Adobe Experience Manager
Applications
1 28 (1.44%) Microsoft Office
2 18 (0.93%) Microsoft Excel
3 7 (0.36%) Microsoft Project
3 7 (0.36%) Revit
4 6 (0.31%) Chatbot
4 6 (0.31%) MS Visio
5 2 (0.10%) Blender
5 2 (0.10%) Maya
6 1 (0.052%) Adobe XD
6 1 (0.052%) AutoCAD
6 1 (0.052%) Microsoft PowerPoint
6 1 (0.052%) Sketch
Business Applications
1 15 (0.77%) Remedy ITSM
2 12 (0.62%) SAP S/4HANA
2 12 (0.62%) Shopify
3 8 (0.41%) Dynamics NAV
3 8 (0.41%) SAP Business One
4 6 (0.31%) Dynamics CRM
5 5 (0.26%) Oracle EBS
6 3 (0.15%) SAP ERP
7 2 (0.10%) NetSuite
7 2 (0.10%) Oracle Applications
7 2 (0.10%) Oracle EBS R12
7 2 (0.10%) Oracle ERP
7 2 (0.10%) SAP GRC
7 2 (0.10%) SAP MM
8 1 (0.052%) Adaptiv
8 1 (0.052%) Endur
8 1 (0.052%) Magento
8 1 (0.052%) Sage 200
8 1 (0.052%) SAP EWM
8 1 (0.052%) SAP WM
Cloud Services
1 339 (17.47%) Azure
2 240 (12.36%) AWS
3 105 (5.41%) GCP
4 64 (3.30%) SaaS
5 63 (3.25%) Power Platform
6 54 (2.78%) Microsoft 365
7 52 (2.68%) Azure DevOps
7 52 (2.68%) Serverless
8 40 (2.06%) GitHub
9 35 (1.80%) AWS Lambda
10 27 (1.39%) Entra ID
11 26 (1.34%) Cloud Computing
11 26 (1.34%) Dynamics 365
12 25 (1.29%) Azure Data Factory
13 24 (1.24%) Salesforce Sales Cloud
14 23 (1.18%) PaaS
15 21 (1.08%) Amazon S3
16 20 (1.03%) Azure Monitor
16 20 (1.03%) Microsoft Copilot
16 20 (1.03%) Snowflake
Communications & Networking
1 636 (32.77%) Broadband
2 96 (4.95%) Firewall
3 81 (4.17%) Network Security
4 42 (2.16%) WLAN
5 40 (2.06%) DNS
6 39 (2.01%) Internet
7 37 (1.91%) TCP/IP
8 25 (1.29%) VLAN
9 24 (1.24%) SAN
10 23 (1.18%) DHCP
11 20 (1.03%) VPN
12 18 (0.93%) BGP
13 17 (0.88%) OSPF
13 17 (0.88%) WAN
14 15 (0.77%) Intrusion Detection
15 14 (0.72%) Wi-Fi
16 12 (0.62%) LAN
17 11 (0.57%) HTTP
17 11 (0.57%) VoIP
18 9 (0.46%) NAS
Database & Business Intelligence
1 99 (5.10%) SQL Server
2 62 (3.19%) MySQL
3 48 (2.47%) NoSQL
4 47 (2.42%) Big Data
4 47 (2.42%) Data Warehouse
5 45 (2.32%) Power BI
6 39 (2.01%) Data Lake
7 38 (1.96%) Relational Database
8 27 (1.39%) PostgreSQL
9 22 (1.13%) Hadoop
10 18 (0.93%) MongoDB
11 17 (0.88%) Azure SQL Database
12 16 (0.82%) Amazon Redshift
13 15 (0.77%) BigQuery
14 13 (0.67%) Amazon RDS
14 13 (0.67%) SQL Server Integration Services
15 12 (0.62%) Azure SQL Data Warehouse
15 12 (0.62%) Tableau
16 11 (0.57%) Oracle Database
17 9 (0.46%) SQL Server Reporting Services
Development Applications
1 95 (4.89%) Git
2 41 (2.11%) JIRA
3 23 (1.18%) Jenkins
4 14 (0.72%) Gradle
5 11 (0.57%) Moq
5 11 (0.57%) SpecFlow
6 8 (0.41%) Maven
6 8 (0.41%) SonarQube
7 7 (0.36%) Burp Suite
8 6 (0.31%) GitLab
8 6 (0.31%) Sonatype Nexus
8 6 (0.31%) Visual Studio
9 5 (0.26%) Metasploit
9 5 (0.26%) Vite
10 4 (0.21%) CircleCI
10 4 (0.21%) Cypress.io
10 4 (0.21%) Octopus Deploy
10 4 (0.21%) webpack
11 3 (0.15%) MLflow
11 3 (0.15%) Visual Studio Code
General
1 1,145 (58.99%) Social Skills
2 244 (12.57%) Finance
3 179 (9.22%) Analytical Skills
4 146 (7.52%) Law
5 106 (5.46%) Games
6 83 (4.28%) Multimedia
7 64 (3.30%) Retail
8 59 (3.04%) Inclusion and Diversity
9 48 (2.47%) Manufacturing
10 46 (2.37%) Marketing
11 43 (2.22%) Legal
12 24 (1.24%) Electronics
13 19 (0.98%) Telecoms
14 18 (0.93%) Advertising
14 18 (0.93%) Automotive
15 17 (0.88%) Banking
15 17 (0.88%) Front Office
16 16 (0.82%) Pharmaceutical
17 14 (0.72%) Organisational Skills
17 14 (0.72%) Public Sector
Job Titles
1 366 (18.86%) Lead
2 257 (13.24%) Senior
3 223 (11.49%) Developer
4 215 (11.08%) Architect
5 177 (9.12%) Systems Engineer
6 173 (8.91%) Engineering Manager
7 157 (8.09%) IT Manager
8 99 (5.10%) Senior Manager
9 93 (4.79%) Software Engineer
10 88 (4.53%) Team Leader
11 79 (4.07%) ServiceNow Manager
12 78 (4.02%) Senior Service Manager
13 71 (3.66%) Analyst
14 66 (3.40%) Solutions Architect
15 61 (3.14%) Graduate
16 56 (2.89%) Software Architect
17 51 (2.63%) IT Engineer
18 46 (2.37%) Graduate Developer
19 44 (2.27%) Support Engineer
20 42 (2.16%) Data Engineer
Libraries, Frameworks & Software Standards
1 129 (6.65%) .NET
2 126 (6.49%) HTML
3 104 (5.36%) CSS
4 85 (4.38%) Middleware
5 65 (3.35%) React
6 59 (3.04%) REST
7 46 (2.37%) ASP.NET
7 46 (2.37%) Kafka
8 44 (2.27%) jQuery
9 36 (1.85%) RESTful
10 31 (1.60%) AngularJS
11 29 (1.49%) Node.js
11 29 (1.49%) SOAP
12 26 (1.34%) .NET Framework
12 26 (1.34%) Elastic Stack
13 25 (1.29%) Lightning Web Components
14 24 (1.24%) .NET Core
15 19 (0.98%) HTML5
16 18 (0.93%) JSON
16 18 (0.93%) Web Services
Miscellaneous
1 207 (10.66%) Management Information System
2 105 (5.41%) Product Ownership
3 80 (4.12%) Video\Live Streaming
4 60 (3.09%) Algorithms
5 52 (2.68%) Enterprise Software
6 49 (2.52%) Security Posture
7 47 (2.42%) Cloud Native
8 32 (1.65%) Self-Motivation
9 31 (1.60%) Mobile App
10 29 (1.49%) Driving Licence
11 26 (1.34%) Hedge funds
12 24 (1.24%) Cyberattack
13 21 (1.08%) Legacy Systems
13 21 (1.08%) Virtual Team
14 20 (1.03%) Mobile Games
15 16 (0.82%) Data Centre
15 16 (0.82%) Onboarding
15 16 (0.82%) Team-Oriented Environment
16 15 (0.77%) Robotics
16 15 (0.77%) Social Media
Operating Systems
1 151 (7.78%) Windows
2 126 (6.49%) Linux
3 37 (1.91%) Windows Server
4 20 (1.03%) Windows Server 2016
5 19 (0.98%) Android
5 19 (0.98%) Ubuntu
6 17 (0.88%) Apple iOS
6 17 (0.88%) Windows 10
6 17 (0.88%) Windows Server 2019
7 14 (0.72%) Windows Vista
8 12 (0.62%) Mac OS X
9 9 (0.46%) Mac OS
9 9 (0.46%) Red Hat Enterprise Linux
9 9 (0.46%) Unix
10 4 (0.21%) Rocky
11 3 (0.15%) Kali Linux
11 3 (0.15%) VMS
12 2 (0.10%) CentOS
12 2 (0.10%) Windows Server 2012
13 1 (0.052%) Debian
Processes & Methodologies
1 1,915 (98.66%) Computer Science
2 1,011 (52.09%) Problem-Solving
3 799 (41.16%) Mentoring
4 754 (38.85%) Roadmaps
5 616 (31.74%) High Availability
6 612 (31.53%) Product Management
7 557 (28.70%) Broadcast Engineering
8 342 (17.62%) Agile
9 315 (16.23%) Software Engineering
10 299 (15.40%) DevOps
11 242 (12.47%) Continuous Improvement
12 210 (10.82%) Artificial Intelligence
13 185 (9.53%) CI/CD
14 144 (7.42%) Machine Learning
15 138 (7.11%) ITSM
16 135 (6.96%) Service Delivery
17 134 (6.90%) Customer-Centricity
18 128 (6.59%) Design Patterns
19 126 (6.49%) Cybersecurity
19 126 (6.49%) Data Science
Programming Languages
1 313 (16.13%) Python
2 288 (14.84%) SQL
3 259 (13.34%) Java
4 202 (10.41%) C#
5 198 (10.20%) JavaScript
6 131 (6.75%) C++
7 123 (6.34%) TypeScript
8 110 (5.67%) PHP
9 95 (4.89%) PowerShell
10 74 (3.81%) C
11 57 (2.94%) R
12 52 (2.68%) Rust
13 50 (2.58%) Ruby
14 49 (2.52%) Dart
14 49 (2.52%) MATLAB
15 26 (1.34%) Apex Code
16 25 (1.29%) Bash
17 20 (1.03%) Scala
18 19 (0.98%) Kotlin
19 18 (0.93%) PL/SQL
Qualifications
1 1,941 (100.00%) Degree
2 182 (9.38%) Master's Degree
3 97 (5.00%) Security Cleared
4 87 (4.48%) Microsoft Certification
5 77 (3.97%) BPSS Clearance
6 70 (3.61%) Chartered Engineer
7 68 (3.50%) Azure Certification
8 63 (3.25%) CISSP
8 63 (3.25%) SC Cleared
9 60 (3.09%) Cisco Certification
10 48 (2.47%) MCSE
11 43 (2.22%) AWS Certification
12 40 (2.06%) CCNA
12 40 (2.06%) CCNP
13 36 (1.85%) PMI Certification
14 35 (1.80%) PMP
15 29 (1.49%) LPIC
15 29 (1.49%) MCP
16 28 (1.44%) CEH
17 27 (1.39%) DV Cleared
Quality Assurance & Compliance
1 74 (3.81%) GDPR
2 60 (3.09%) QA
3 59 (3.04%) Data Quality
3 59 (3.04%) ISO/IEC 27001
4 56 (2.89%) ISO/IEC 12207
5 51 (2.63%) NIST
6 28 (1.44%) HIPAA
7 21 (1.08%) California Consumer Privacy Act
8 17 (0.88%) NCSC
9 14 (0.72%) Accessibility
10 7 (0.36%) Cyber Essentials
10 7 (0.36%) SLA
11 6 (0.31%) CDISC
11 6 (0.31%) Cyber Essentials PLUS
12 5 (0.26%) 21 CFR Part 11
12 5 (0.26%) Def Stans
13 4 (0.21%) Actionable Recommendations
13 4 (0.21%) GRC
13 4 (0.21%) PCI DSS
14 3 (0.15%) SOC 2
System Software
1 109 (5.62%) Docker
2 52 (2.68%) Active Directory
3 24 (1.24%) VMware Infrastructure
4 11 (0.57%) Hyper-V
5 7 (0.36%) HDFS
6 6 (0.31%) Virtual Machines
6 6 (0.31%) vSphere
7 5 (0.26%) VMware ESXi
7 5 (0.26%) VMware NSX
8 3 (0.15%) Virtual Desktop
9 2 (0.10%) Firmware
10 1 (0.052%) BitLocker
10 1 (0.052%) Embedded Firmware
10 1 (0.052%) GPFS
10 1 (0.052%) KVM
10 1 (0.052%) Lustre
10 1 (0.052%) NFS
10 1 (0.052%) Varnish
10 1 (0.052%) XenApp
Systems Management
1 117 (6.03%) Kubernetes
2 74 (3.81%) Terraform
3 51 (2.63%) Grafana
3 51 (2.63%) Prometheus
4 18 (0.93%) Ansible
5 13 (0.67%) Microsoft Intune
6 6 (0.31%) ArcSight ESM
6 6 (0.31%) Argo
6 6 (0.31%) QRadar
7 5 (0.26%) CSIRT
7 5 (0.26%) Kibana
8 4 (0.21%) Failover Clustering
8 4 (0.21%) SCCM
8 4 (0.21%) Single Sign-On
9 3 (0.15%) Nessus
10 2 (0.10%) logstash
10 2 (0.10%) Nmap
10 2 (0.10%) Packer
10 2 (0.10%) Puppet
10 2 (0.10%) Systems Management Server (SMS)
Vendors
1 252 (12.98%) Microsoft
2 128 (6.59%) ServiceNow
3 92 (4.74%) Google
4 68 (3.50%) Cisco
5 50 (2.58%) SAP
6 45 (2.32%) Salesforce
7 33 (1.70%) VMware
8 31 (1.60%) Oracle
9 26 (1.34%) Databricks
10 23 (1.18%) Salesforce Marketing Cloud
11 22 (1.13%) OpenAI
12 16 (0.82%) Dell
12 16 (0.82%) Remedy
13 13 (0.67%) Fortinet
13 13 (0.67%) Workday
14 12 (0.62%) Apple
14 12 (0.62%) New Relic
14 12 (0.62%) Ubiquiti
15 11 (0.57%) BMC
15 11 (0.57%) WooCommerce