JavaScript Jobs

JavaScript (including ECMAScript)
UK

The table below provides summary statistics for permanent job vacancies requiring JavaScript skills. It includes a benchmarking guide to the annual salaries offered in vacancies that cited JavaScript over the 6 months leading up to 18 May 2025, comparing them to the same period in the previous two years.

6 months to
18 May 2025
Same period 2024 Same period 2023
Rank 35 18 15
Rank change year-on-year -17 -3 -7
Permanent jobs citing JavaScript 3,618 8,266 11,815
As % of all permanent jobs advertised in the UK 6.46% 8.28% 11.91%
As % of the Programming Languages category 21.58% 24.90% 27.50%
Number of salaries quoted 2,336 6,503 7,187
10th Percentile £37,500 £35,000 £38,750
25th Percentile £47,500 £43,750 £48,000
Median annual salary (50th Percentile) £65,000 £60,000 £62,500
Median % change year-on-year +8.33% -4.00% +4.17%
75th Percentile £85,000 £76,250 £82,500
90th Percentile £110,000 £100,000 £100,000
UK excluding London median annual salary £60,000 £55,000 £55,000
% change year-on-year +9.09% - +3.18%

All Programming Languages
UK

JavaScript falls under the Programming Languages category. For comparison with the information above, the following table provides summary statistics for all permanent job vacancies requiring coding skills.

Permanent vacancies with a requirement for coding skills 16,767 33,193 42,967
As % of all permanent jobs advertised in the UK 29.94% 33.26% 43.30%
Number of salaries quoted 11,325 24,893 27,483
10th Percentile £37,500 £35,000 £38,750
25th Percentile £47,683 £45,000 £49,100
Median annual salary (50th Percentile) £60,000 £60,000 £65,000
Median % change year-on-year - -7.69% +4.00%
75th Percentile £80,750 £77,500 £86,250
90th Percentile £105,000 £100,000 £107,500
UK excluding London median annual salary £55,000 £54,000 £55,000
% change year-on-year +1.85% -1.82% +4.76%

JavaScript
Job Vacancy Trend

Job postings citing JavaScript as a proportion of all IT jobs advertised.
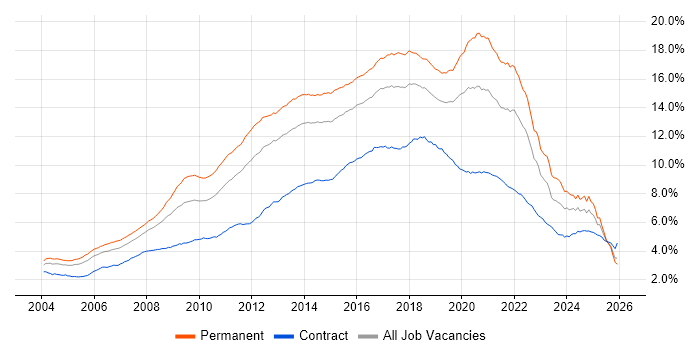
Job vacancy trend for JavaScript in the UK

JavaScript
Salary Trend

3-month moving average salary quoted in jobs citing JavaScript.

Salary trend for JavaScript in the UK

JavaScript
Salary Histogram

Salary distribution for jobs citing JavaScript over the 6 months to 18 May 2025.

Salary histogram for JavaScript in the UK

JavaScript
Top 17 Job Locations

The table below looks at the demand and provides a guide to the median salaries quoted in IT jobs citing JavaScript within the UK over the 6 months to 18 May 2025. The 'Rank Change' column provides an indication of the change in demand within each location based on the same 6 month period last year.

Location Rank Change
on Same Period
Last Year
Matching
Permanent
IT Job Ads
Median Salary
Past 6 Months
Median Salary
% Change
on Same Period
Last Year
Live
Jobs
England -14 3,271 £66,206 +10.34% 2,904
UK excluding London -19 2,286 £60,000 +9.09% 2,038
Work from Home -5 2,191 £66,340 +10.57% 2,143
London -7 1,093 £81,975 -0.64% 1,303
North of England -21 740 £57,500 +4.55% 587
North West -27 547 £57,500 +4.55% 356
South East -25 506 £56,250 +2.27% 674
Midlands -35 298 £55,000 +10.00% 255
East of England -15 286 £66,212 +26.12% 200
South West -14 228 £60,000 +14.29% 191
Scotland -6 197 £60,000 +9.09% 96
Yorkshire -18 160 £57,500 +4.55% 173
West Midlands -40 157 £53,000 +0.95% 139
East Midlands -38 141 £55,000 +10.00% 105
North East -23 33 £52,500 -4.55% 66
Wales -32 33 £50,000 - 51
Northern Ireland -9 9 £50,000 +11.11% 41

JavaScript
Co-occurring Skills and Capabilities by Category

The follow tables expand on the table above by listing co-occurrences grouped by category. The same employment type, locality and period is covered with up to 20 co-occurrences shown in each of the following categories:

Application Platforms
1 223 (6.16%) Confluence
2 141 (3.90%) Apache Airflow
3 120 (3.32%) CMS
4 93 (2.57%) Apache
5 81 (2.24%) SharePoint
6 68 (1.88%) WordPress
7 29 (0.80%) IIS
7 29 (0.80%) Umbraco
8 23 (0.64%) Headless CMS
8 23 (0.64%) Jupyter
8 23 (0.64%) nginx
9 20 (0.55%) Drupal
10 12 (0.33%) Tomcat
11 8 (0.22%) Microsoft Exchange
12 7 (0.19%) OpenEdge
13 6 (0.17%) Apache Solr
13 6 (0.17%) OpenStack
14 5 (0.14%) Liferay
15 4 (0.11%) Oracle SOA Suite
15 4 (0.11%) Sitecore CMS
Applications
1 145 (4.01%) Chatbot
2 38 (1.05%) Adobe XD
3 37 (1.02%) Microsoft Office
4 24 (0.66%) Sketch
5 15 (0.41%) Photoshop
6 14 (0.39%) Microsoft Excel
7 9 (0.25%) InVision
8 7 (0.19%) Trello
9 6 (0.17%) Adobe Creative Suite
9 6 (0.17%) Adobe Illustrator
10 2 (0.055%) MS Visio
10 2 (0.055%) Notion
11 1 (0.028%) Adobe After Effects
11 1 (0.028%) Moqups
11 1 (0.028%) S-PLUS
11 1 (0.028%) Zeplin
Business Applications
1 88 (2.43%) Dynamics CRM
2 51 (1.41%) NetSuite
3 20 (0.55%) Magento
3 20 (0.55%) Shopify
4 15 (0.41%) Sage 200
4 15 (0.41%) Sage 50
5 12 (0.33%) Payment Gateway
6 11 (0.30%) JDE OneWorld
7 9 (0.25%) Oracle EBS
8 5 (0.14%) Adobe Campaign
9 4 (0.11%) Infor CloudSuite
9 4 (0.11%) Infor CloudSuite Industrial (formerly SyteLine)
10 3 (0.083%) Oracle ERP
11 2 (0.055%) Elite 3E
11 2 (0.055%) Odoo
11 2 (0.055%) Oracle EBS R12
12 1 (0.028%) Sage 1000
12 1 (0.028%) Salesforce CRM
12 1 (0.028%) SAP Hybris
12 1 (0.028%) SAP S/4HANA
Cloud Services
1 1,573 (43.48%) AWS
2 1,242 (34.33%) Azure
3 708 (19.57%) GCP
4 216 (5.97%) Pulumi
5 215 (5.94%) Serverless
6 208 (5.75%) Azure DevOps
7 179 (4.95%) SaaS
8 172 (4.75%) Power Platform
9 152 (4.20%) GitHub
10 140 (3.87%) Power Automate
11 133 (3.68%) dbt
12 121 (3.34%) Dynamics 365
13 114 (3.15%) PowerApps
14 109 (3.01%) Amazon EKS
15 91 (2.52%) Amazon EC2
16 87 (2.40%) AWS CloudFormation
17 75 (2.07%) Azure Service Bus
18 74 (2.05%) Amazon ECS
18 74 (2.05%) Figma
19 73 (2.02%) Azure Logic Apps
Communications & Networking
1 220 (6.08%) Broadband
2 76 (2.10%) TCP/IP
3 72 (1.99%) VPN
4 32 (0.88%) Internet
5 28 (0.77%) HTTP
6 18 (0.50%) Firewall
7 10 (0.28%) DNS
7 10 (0.28%) SSL
8 9 (0.25%) Network Security
8 9 (0.25%) Wi-Fi
9 8 (0.22%) DMARC
9 8 (0.22%) SMS
10 7 (0.19%) Intranet
11 6 (0.17%) Bluetooth
11 6 (0.17%) MQTT
12 4 (0.11%) FTP
12 4 (0.11%) LoRaWAN
12 4 (0.11%) Multicast
13 3 (0.083%) LAN
13 3 (0.083%) WAN
Database & Business Intelligence
1 554 (15.31%) SQL Server
2 366 (10.12%) NoSQL
3 323 (8.93%) Relational Database
4 282 (7.79%) MySQL
5 257 (7.10%) PostgreSQL
6 244 (6.74%) RDBMS
7 177 (4.89%) MongoDB
8 143 (3.95%) Elasticsearch
9 133 (3.68%) Amazon Athena
10 132 (3.65%) Apache Iceberg
10 132 (3.65%) Dremio
11 130 (3.59%) Apache Arrow
12 82 (2.27%) Apache Ignite
13 73 (2.02%) Data Lake
14 60 (1.66%) Power BI
15 43 (1.19%) Azure SQL Database
15 43 (1.19%) SQL Server Reporting Services
16 36 (1.00%) Big Data
17 35 (0.97%) Amazon RDS
18 25 (0.69%) Redis
Development Applications
1 582 (16.09%) Git
2 426 (11.77%) JIRA
3 333 (9.20%) Selenium
4 331 (9.15%) Cucumber
5 303 (8.37%) GitLab
6 293 (8.10%) Maven
7 284 (7.85%) Sonatype Nexus
8 282 (7.79%) SonarQube
9 269 (7.44%) Bitbucket
10 215 (5.94%) Jaeger
11 150 (4.15%) Jenkins
12 98 (2.71%) webpack
13 88 (2.43%) Visual Studio
14 81 (2.24%) Cypress.io
15 69 (1.91%) Robot Framework
16 55 (1.52%) JUnit
17 54 (1.49%) TeamCity
18 48 (1.33%) Octopus Deploy
19 43 (1.19%) JMeter
20 42 (1.16%) Postman
General
1 887 (24.52%) Finance
2 878 (24.27%) Inclusion and Diversity
3 705 (19.49%) Social Skills
4 483 (13.35%) Banking
5 258 (7.13%) Analytical Skills
6 240 (6.63%) Retail
7 207 (5.72%) Front Office
8 176 (4.86%) Investment Banking
9 124 (3.43%) Games
9 124 (3.43%) Marketing
10 90 (2.49%) Corporate Banking
11 87 (2.40%) Public Sector
12 83 (2.29%) Law
13 72 (1.99%) Telecoms
14 54 (1.49%) Manufacturing
15 46 (1.27%) Legal
16 41 (1.13%) Advertising
17 37 (1.02%) Organisational Skills
17 37 (1.02%) Presentation Skills
18 29 (0.80%) Tech for Good
Job Titles
1 1,522 (42.07%) Developer
2 950 (26.26%) Software Engineer
3 828 (22.89%) Senior
4 536 (14.81%) Lead
5 337 (9.31%) Senior Software Engineer
6 335 (9.26%) Senior Developer
7 244 (6.74%) Team Leader
8 237 (6.55%) Full-Stack Developer
9 188 (5.20%) Front-End Developer (Client-Side Developer)
10 164 (4.53%) AWS Engineer
11 157 (4.34%) Software Developer
12 149 (4.12%) .NET Developer
13 135 (3.73%) AWS Software Engineer
14 130 (3.59%) React Developer
15 126 (3.48%) PHP Developer
16 121 (3.34%) Python Engineer
17 120 (3.32%) Architect
18 117 (3.23%) Developer/Software Engineer
19 113 (3.12%) Trainer
20 109 (3.01%) Lead Developer
Libraries, Frameworks & Software Standards
1 1,455 (40.22%) HTML
2 1,273 (35.19%) React
3 1,216 (33.61%) CSS
4 867 (23.96%) .NET
5 760 (21.01%) Node.js
6 481 (13.29%) AngularJS
7 388 (10.72%) Redux
8 372 (10.28%) RESTful
9 366 (10.12%) REST
10 350 (9.67%) Spring Boot
11 339 (9.37%) Spring
12 326 (9.01%) HTML5
13 317 (8.76%) Kafka
14 288 (7.96%) Vue
15 250 (6.91%) JPA
16 239 (6.61%) Elastic Stack
17 232 (6.41%) CSS3
18 218 (6.03%) OpenTelemetry
19 207 (5.72%) ASP.NET
20 203 (5.61%) Hibernate
Miscellaneous
1 367 (10.14%) Product Ownership
2 294 (8.13%) Enterprise Software
3 253 (6.99%) Linux Command Line
4 251 (6.94%) Cyberattack
5 228 (6.30%) Self-Motivation
6 188 (5.20%) Mobile App
7 182 (5.03%) Fixed Income
8 138 (3.81%) Foreign Exchange (FX)
9 127 (3.51%) Equities
10 98 (2.71%) Cloud Native
11 84 (2.32%) Hedge funds
12 70 (1.93%) Algorithms
13 68 (1.88%) Derivative
14 60 (1.66%) Greenfield Project
15 58 (1.60%) Distributed Systems
16 49 (1.35%) Virtual Team
17 43 (1.19%) Legacy Systems
18 38 (1.05%) Pricing Data
19 36 (1.00%) Data Structures
20 34 (0.94%) Onboarding
Operating Systems
1 707 (19.54%) Linux
2 256 (7.08%) Unix
3 147 (4.06%) Windows
4 111 (3.07%) Android
5 44 (1.22%) Apple iOS
6 13 (0.36%) Windows Server
7 10 (0.28%) Rocky
8 8 (0.22%) Ubuntu
9 5 (0.14%) CentOS
10 2 (0.055%) VMS
11 1 (0.028%) Debian
11 1 (0.028%) Embedded Linux
11 1 (0.028%) Fedora
11 1 (0.028%) Red Hat Enterprise Linux
11 1 (0.028%) Solaris
11 1 (0.028%) Windows 10
11 1 (0.028%) Windows Server 2012
Processes & Methodologies
1 1,799 (49.72%) Agile
2 1,346 (37.20%) Software Engineering
3 1,107 (30.60%) DevOps
4 905 (25.01%) Mentoring
5 814 (22.50%) CI/CD
6 812 (22.44%) Microservices
7 751 (20.76%) Full-Stack Development
8 688 (19.02%) User Experience
9 673 (18.60%) Problem-Solving
10 641 (17.72%) Containerisation
11 602 (16.64%) Test Automation
12 579 (16.00%) Front End Development
13 572 (15.81%) Performance Optimisation
14 425 (11.75%) SDLC
15 386 (10.67%) Scrum
16 377 (10.42%) Artificial Intelligence
17 376 (10.39%) Roadmaps
18 369 (10.20%) Continuous Integration
19 365 (10.09%) TDD
20 337 (9.31%) Machine Learning
Programming Languages
1 1,333 (36.84%) Python
2 1,276 (35.27%) Java
3 1,109 (30.65%) SQL
4 1,010 (27.92%) TypeScript
5 895 (24.74%) C#
6 489 (13.52%) Go
7 433 (11.97%) C++
8 381 (10.53%) PHP
9 311 (8.60%) Bash
10 294 (8.13%) Rust
11 136 (3.76%) PowerShell
12 86 (2.38%) C
13 79 (2.18%) Ruby
14 60 (1.66%) R
15 53 (1.46%) MATLAB
16 50 (1.38%) Dart
17 33 (0.91%) Kotlin
18 31 (0.86%) PL/SQL
18 31 (0.86%) T-SQL
19 24 (0.66%) Shell Script
Qualifications
1 630 (17.41%) Degree
2 422 (11.66%) Security Cleared
3 401 (11.08%) AWS Certification
4 285 (7.88%) DV Cleared
5 215 (5.94%) Computer Science Degree
6 179 (4.95%) AWS Certified Developer
7 178 (4.92%) AWS Certified Solutions Architect
8 119 (3.29%) SC Cleared
9 40 (1.11%) Microsoft Certification
10 32 (0.88%) Master's Degree
11 30 (0.83%) ISTQB
12 14 (0.39%) PhD
13 12 (0.33%) Numerate Degree
14 10 (0.28%) Azure Certification
15 9 (0.25%) ISTQB Foundation Certification
16 7 (0.19%) DBS Check
17 6 (0.17%) BPSS Clearance
18 4 (0.11%) Cisco Certification
18 4 (0.11%) CISSP
18 4 (0.11%) HND
Quality Assurance & Compliance
1 496 (13.71%) QA
2 234 (6.47%) Accessibility
3 59 (1.63%) GDPR
4 47 (1.30%) WCAG
5 27 (0.75%) ISO/IEC 27001
6 21 (0.58%) Data Quality
7 13 (0.36%) HL7
8 9 (0.25%) Software Quality Assurance
9 4 (0.11%) GRC
10 3 (0.083%) PCI DSS
11 2 (0.055%) ISO 9001
11 2 (0.055%) NCSC
11 2 (0.055%) NIST
11 2 (0.055%) Sarbanes-Oxley
11 2 (0.055%) SLA
11 2 (0.055%) WAI
12 1 (0.028%) COBIT
12 1 (0.028%) Cyber Essentials
12 1 (0.028%) PMO
12 1 (0.028%) SOC 2
System Software
1 949 (26.23%) Docker
2 22 (0.61%) Active Directory
3 5 (0.14%) VMware Infrastructure
4 4 (0.11%) Hyper-V
5 3 (0.083%) Samba
6 2 (0.055%) Virtual Machines
7 1 (0.028%) Embedded Firmware
7 1 (0.028%) Firmware
7 1 (0.028%) KVM
7 1 (0.028%) NDS
7 1 (0.028%) Xen
Systems Management
1 835 (23.08%) Kubernetes
2 381 (10.53%) Terraform
3 292 (8.07%) Ansible
4 236 (6.52%) Prometheus
5 222 (6.14%) Kustomize
6 217 (6.00%) Argo
7 35 (0.97%) Single Sign-On
8 23 (0.64%) Kibana
9 21 (0.58%) Grafana
10 12 (0.33%) Istio
11 11 (0.30%) Microsoft Intune
12 5 (0.14%) HP Quality Center
13 4 (0.11%) Failover Clustering
13 4 (0.11%) Rundeck
14 3 (0.083%) CA Endevor
14 3 (0.083%) Marathon
14 3 (0.083%) Nagios
14 3 (0.083%) Puppet
14 3 (0.083%) Red Hat Satellite
15 2 (0.055%) Control-M
Vendors
1 432 (11.94%) Microsoft
2 315 (8.71%) Google
3 247 (6.83%) Solace
4 123 (3.40%) PayPal
5 83 (2.29%) Adobe
6 82 (2.27%) ServiceNow
7 80 (2.21%) Oracle
8 48 (1.33%) Salesforce
9 23 (0.64%) Dynatrace
9 23 (0.64%) Splunk
10 20 (0.55%) Cisco
10 20 (0.55%) IBM
11 19 (0.53%) Twitter
12 16 (0.44%) Sage
13 14 (0.39%) Atlassian
13 14 (0.39%) Dell
13 14 (0.39%) MuleSoft
14 11 (0.30%) HubSpot
14 11 (0.30%) Red Hat
14 11 (0.30%) VMware