User Experience Job Trends

UX
UK

The table below provides summary statistics and salary benchmarking for jobs requiring User Experience skills. It covers permanent job vacancies from the 3 months leading up to 28 November 2025, with comparisons to the same periods in the previous two years.

3 months to
28 Nov 2025
Same period 2024 Same period 2023
Rank 17 62 77
Rank change year-on-year +45 +15 -17
Permanent jobs citing User Experience 2,420 1,276 822
As % of all permanent jobs in the UK 8.24% 4.26% 3.58%
As % of the Processes & Methodologies category 9.81% 4.64% 3.83%
Number of salaries quoted 528 561 679
10th Percentile £30,500 £32,500 £37,500
25th Percentile £42,500 £42,500 £46,250
Median annual salary (50th Percentile) £55,000 £60,000 £60,000
Median % change year-on-year -8.33% - -4.00%
75th Percentile £80,000 £78,750 £81,875
90th Percentile £98,250 £100,000 £92,500
UK excluding London median annual salary £52,500 £50,000 £50,750
% change year-on-year +5.00% -1.48% -11.74%

All Process and Methodology Skills
UK

User Experience falls under the Processes and Methodologies category. For comparison with the information above, the following table provides summary statistics for all permanent job vacancies requiring process or methodology skills.

Permanent vacancies with a requirement for process or methodology skills 24,670 27,484 21,483
As % of all permanent jobs advertised in the UK 83.97% 91.78% 93.44%
Number of salaries quoted 14,639 13,063 16,811
10th Percentile £28,250 £35,000 £31,500
25th Percentile £35,000 £45,000 £42,500
Median annual salary (50th Percentile) £54,793 £60,000 £60,000
Median % change year-on-year -8.68% - -4.00%
75th Percentile £75,000 £80,000 £80,000
90th Percentile £95,000 £100,000 £100,000
UK excluding London median annual salary £47,500 £55,000 £52,500
% change year-on-year -13.64% +4.76% -4.55%

User Experience
Job Vacancy Trend

Historical trend showing the proportion of permanent IT job postings citing User Experience relative to all permanent IT jobs advertised.
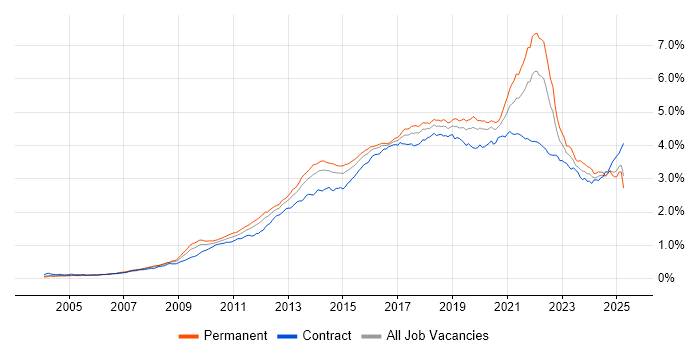
User Experience job vacancy trend in the UK

User Experience
Salary Trend

Salary distribution trend for jobs in the UK citing User Experience.

Salary distribution trend for jobs in the UK citing User Experience

User Experience
Salary Histogram

Salary distribution for jobs citing User Experience over the 3 months to 28 November 2025.

Salary histogram for User Experience in the UK

User Experience
Top 18 Job Locations

The table below looks at the demand and provides a guide to the median salaries quoted in IT jobs citing User Experience within the UK over the 3 months to 28 November 2025. The 'Rank Change' column provides an indication of the change in demand within each location based on the same 3 month period last year.

Location Rank Change
on Same Period
Last Year
Matching
Permanent
IT Job Ads
Median Salary
Past 3 Months
Median Salary
% Change
on Same Period
Last Year
Live
Jobs
England +48 2,287 £55,000 -8.33% 802
UK excluding London +57 1,742 £52,500 +5.00% 636
North of England +48 743 £52,500 -4.55% 127
North West +45 637 £57,500 +4.55% 64
London +30 581 £70,000 -7.21% 355
South East +40 493 £52,500 +2.44% 310
Work from Home -22 316 £55,000 -18.22% 426
East of England +50 274 £55,000 +10.00% 25
Midlands +52 115 £40,000 +14.29% 75
Yorkshire +36 95 £49,750 +10.56% 41
East Midlands +21 72 £35,000 - 24
South West +3 59 £55,000 +10.00% 65
West Midlands +36 43 £42,039 -15.92% 51
Wales +22 30 £51,250 +86.36% 10
Scotland -36 21 £51,000 -5.56% 25
Northern Ireland -5 11 £95,000 - 4
North East -15 11 £50,000 +17.65% 23
Channel Islands +2 7 £90,000 +260.00%

User Experience
Co-Occurring Skills & Capabilities by Category

The following tables expand on the one above by listing co-occurrences grouped by category. They cover the same employment type, locality and period, with up to 20 co-occurrences shown in each category:

Application Platforms
1 89 (2.82%) CMS
2 61 (1.93%) SharePoint
3 59 (1.87%) Confluence
4 53 (1.68%) WordPress
5 24 (0.76%) Drupal
6 14 (0.44%) Microsoft Exchange
7 13 (0.41%) Umbraco
8 11 (0.35%) Headless CMS
9 4 (0.13%) Adobe Experience Manager
9 4 (0.13%) Apache
9 4 (0.13%) Appian
9 4 (0.13%) Sitecore CMS
10 3 (0.095%) Joomla!
10 3 (0.095%) nginx
10 3 (0.095%) Oracle SOA Suite
11 2 (0.063%) CICS
11 2 (0.063%) EPiServer
11 2 (0.063%) IIS
12 1 (0.032%) ArcGIS
12 1 (0.032%) SugarCRM
Applications
1 64 (2.03%) Adobe XD
2 47 (1.49%) Microsoft Excel
3 45 (1.42%) Adobe Creative Suite
4 36 (1.14%) Microsoft Office
4 36 (1.14%) Sketch
5 34 (1.08%) Photoshop
6 26 (0.82%) Adobe Illustrator
7 24 (0.76%) MS Visio
8 21 (0.66%) InDesign
8 21 (0.66%) Microsoft PowerPoint
9 7 (0.22%) Chatbot
10 5 (0.16%) InVision
10 5 (0.16%) Spreadsheet
11 4 (0.13%) Adobe After Effects
11 4 (0.13%) Adobe Premiere
11 4 (0.13%) Elementor
12 3 (0.095%) Adobe Captivate
12 3 (0.095%) AutoCAD
13 2 (0.063%) Microsoft Project
13 2 (0.063%) Trello
Business Applications
1 41 (1.30%) Shopify
2 30 (0.95%) Dynamics CRM
3 25 (0.79%) SAP S/4HANA
4 6 (0.19%) NetSuite
5 5 (0.16%) Dynamics GP
5 5 (0.16%) Payment Gateway
5 5 (0.16%) Workday HCM
6 4 (0.13%) Magento
6 4 (0.13%) Salesforce CRM
6 4 (0.13%) SAP BPC
7 3 (0.095%) Infor SunSystems
7 3 (0.095%) SAP Business One
8 2 (0.063%) Adobe Campaign
8 2 (0.063%) Integrated Workplace Management System
8 2 (0.063%) OpenCart
8 2 (0.063%) Oracle ERP
8 2 (0.063%) Sage X3
9 1 (0.032%) Oracle Payables
9 1 (0.032%) Oracle Receivables
9 1 (0.032%) TRIRIGA
Cloud Services
1 1,599 (50.60%) Cloud Computing
2 309 (9.78%) Azure
3 235 (7.44%) AWS
4 185 (5.85%) Figma
5 144 (4.56%) Microsoft 365
6 103 (3.26%) Google Analytics
7 99 (3.13%) SaaS
8 82 (2.59%) Power Platform
9 76 (2.41%) GCP
10 71 (2.25%) Azure DevOps
11 61 (1.93%) GitHub
12 60 (1.90%) Serverless
13 41 (1.30%) Entra ID
14 39 (1.23%) PowerApps
15 34 (1.08%) AWS Lambda
16 33 (1.04%) Miro
17 30 (0.95%) Azure Logic Apps
17 30 (0.95%) Power Automate
18 25 (0.79%) Dynamics 365
19 23 (0.73%) Google Tag Manager
Communications & Networking
1 1,604 (50.76%) Internet
2 19 (0.60%) DNS
2 19 (0.60%) Firewall
3 15 (0.47%) TCP/IP
4 14 (0.44%) DHCP
5 11 (0.35%) HTTP
5 11 (0.35%) VLAN
6 8 (0.25%) Intranet
7 7 (0.22%) VPN
8 6 (0.19%) Broadband
8 6 (0.19%) LAN
9 5 (0.16%) WAN
10 4 (0.13%) Bluetooth
10 4 (0.13%) Intrusion Detection
10 4 (0.13%) Modbus
10 4 (0.13%) Network Security
10 4 (0.13%) Wi-Fi
10 4 (0.13%) Wireshark
10 4 (0.13%) ZigBee
11 3 (0.095%) WebEx
Database & Business Intelligence
1 63 (1.99%) SQL Server
2 54 (1.71%) Power BI
3 46 (1.46%) MySQL
4 45 (1.42%) NoSQL
5 39 (1.23%) PostgreSQL
6 30 (0.95%) Relational Database
7 21 (0.66%) MongoDB
8 14 (0.44%) DynamoDB
8 14 (0.44%) Looker
9 12 (0.38%) Tableau
10 11 (0.35%) Metadata
11 9 (0.28%) DB2
11 9 (0.28%) Oracle Reports
12 8 (0.25%) BigQuery
13 7 (0.22%) Amazon Aurora
13 7 (0.22%) Redis
14 6 (0.19%) MariaDB
14 6 (0.19%) Mixpanel
15 5 (0.16%) SQL Server Integration Services
16 4 (0.13%) Elasticsearch
Development Applications
1 136 (4.30%) Git
2 124 (3.92%) JIRA
3 33 (1.04%) Axure RP
4 32 (1.01%) Cypress.io
5 30 (0.95%) webpack
6 29 (0.92%) Jenkins
7 27 (0.85%) Balsamiq
8 17 (0.54%) Vite
9 16 (0.51%) Bitbucket
9 16 (0.51%) Storybook
10 14 (0.44%) NeoLoad
10 14 (0.44%) Selenium
11 12 (0.38%) eCATT
11 12 (0.38%) GitLab
11 12 (0.38%) TeamCity
12 11 (0.35%) Babel
13 10 (0.32%) gulp
13 10 (0.32%) Postman
14 8 (0.25%) Cucumber
14 8 (0.25%) Xcode
General
1 2,189 (69.27%) Social Skills
2 1,716 (54.30%) Inclusion and Diversity
3 1,679 (53.13%) Banking
4 324 (10.25%) Finance
5 289 (9.15%) Marketing
6 206 (6.52%) Analytical Skills
7 187 (5.92%) Law
8 109 (3.45%) Legal
9 98 (3.10%) Public Sector
10 86 (2.72%) Retail
11 52 (1.65%) Organisational Skills
12 47 (1.49%) Influencing Skills
13 46 (1.46%) Manufacturing
13 46 (1.46%) Presentation Skills
14 36 (1.14%) Telecoms
15 24 (0.76%) Advertising
16 19 (0.60%) Electronics
17 15 (0.47%) Pharmaceutical
17 15 (0.47%) Publishing
18 13 (0.41%) Games
Job Titles
1 1,292 (40.89%) Lecturer
2 364 (11.52%) Developer
3 289 (9.15%) Senior
4 152 (4.81%) Analyst
5 151 (4.78%) Designer
6 141 (4.46%) Lead
7 119 (3.77%) Senior Developer
8 101 (3.20%) Full-Stack Developer
9 74 (2.34%) Front-End Developer (Client-Side Developer)
10 65 (2.06%) Product Manager
11 63 (1.99%) Software Engineer
12 61 (1.93%) IT Support
13 60 (1.90%) UX Designer
14 53 (1.68%) Business Analyst
15 46 (1.46%) Full-Stack Engineer
16 43 (1.36%) Senior Full-Stack Developer
16 43 (1.36%) Senior Manager
17 37 (1.17%) Architect
17 37 (1.17%) React Developer
18 36 (1.14%) Front-End Engineer (Client-Side Engineer)
Libraries, Frameworks & Software Standards
1 324 (10.25%) React
2 303 (9.59%) HTML
3 286 (9.05%) CSS
4 155 (4.91%) .NET
5 125 (3.96%) Node.js
6 118 (3.73%) RESTful
7 74 (2.34%) AngularJS
8 73 (2.31%) REST
9 72 (2.28%) HTML5
10 67 (2.12%) Next.js
11 58 (1.84%) Vue
12 52 (1.65%) CSS3
13 46 (1.46%) Jest
14 45 (1.42%) Spring
15 40 (1.27%) ASP.NET
15 40 (1.27%) Spring Boot
16 38 (1.20%) .NET Framework
16 38 (1.20%) GraphQL
17 31 (0.98%) Tailwind CSS
18 30 (0.95%) JSON
Miscellaneous
1 1,610 (50.95%) IoT
2 128 (4.05%) Product Ownership
3 97 (3.07%) Onboarding
4 70 (2.22%) Self-Motivation
5 69 (2.18%) Cloud Native
6 61 (1.93%) Mobile App
7 51 (1.61%) Social Media
8 45 (1.42%) Management Information System
9 35 (1.11%) Analytical Mindset
10 33 (1.04%) AI Agents
11 29 (0.92%) Driving Licence
12 24 (0.76%) e-Learning
13 22 (0.70%) Greenfield Project
14 21 (0.66%) Data Structures
14 21 (0.66%) Graphic Design
15 18 (0.57%) Algorithms
16 17 (0.54%) Legacy Systems
17 15 (0.47%) Animation
17 15 (0.47%) Blog
17 15 (0.47%) Virtual Team
Operating Systems
1 71 (2.25%) Windows
2 70 (2.22%) Apple iOS
3 57 (1.80%) Android
4 41 (1.30%) Windows 10
5 24 (0.76%) Windows Server
6 16 (0.51%) Linux
7 7 (0.22%) Mac OS
8 6 (0.19%) Ubuntu
9 5 (0.16%) Unix
9 5 (0.16%) Windows Server 2019
10 4 (0.13%) Kali Linux
11 3 (0.095%) Windows Server 2016
12 2 (0.063%) zOS
Processes & Methodologies
1 1,871 (59.21%) AI
2 1,693 (53.58%) Machine Learning
3 1,679 (53.13%) Web Development
4 1,663 (52.63%) Cybersecurity
5 625 (19.78%) Agile
6 446 (14.11%) UX Design
7 400 (12.66%) Problem-Solving
8 335 (10.60%) Continuous Improvement
9 309 (9.78%) Analytics
10 237 (7.50%) Roadmaps
11 227 (7.18%) DevOps
12 224 (7.09%) CI/CD
13 210 (6.65%) Full-Stack Development
14 162 (5.13%) Front End Development
15 161 (5.09%) Mentoring
16 154 (4.87%) Stakeholder Management
17 152 (4.81%) E-Commerce
18 151 (4.78%) User Research
19 150 (4.75%) SEO
20 148 (4.68%) Prototyping
Programming Languages
1 353 (11.17%) JavaScript
2 208 (6.58%) TypeScript
3 155 (4.91%) SQL
4 135 (4.27%) C#
4 135 (4.27%) Python
5 129 (4.08%) Java
6 54 (1.71%) PowerShell
7 34 (1.08%) PHP
8 17 (0.54%) Bash
8 17 (0.54%) Swift
9 16 (0.51%) Go
9 16 (0.51%) Kotlin
10 13 (0.41%) Bicep
10 13 (0.41%) C++
11 10 (0.32%) VBScript
12 8 (0.25%) R
12 8 (0.25%) Ruby
12 8 (0.25%) Rust
13 7 (0.22%) XAML
14 6 (0.19%) VBA
Qualifications
1 1,842 (58.29%) Degree
2 1,629 (51.55%) Master's Degree
3 1,601 (50.66%) PhD
3 1,601 (50.66%) Postgraduate
4 139 (4.40%) Security Cleared
5 103 (3.26%) SC Cleared
6 59 (1.87%) Computer Science Degree
7 26 (0.82%) Microsoft Certification
8 25 (0.79%) DV Cleared
9 23 (0.73%) DBS Check
10 19 (0.60%) ITIL Foundation Certificate
11 17 (0.54%) BPSS Clearance
12 13 (0.41%) AWS Certification
13 12 (0.38%) MCSA
14 8 (0.25%) Cisco Certification
15 7 (0.22%) A+ Certification
15 7 (0.22%) Azure Certification
15 7 (0.22%) SAP Certification
16 6 (0.19%) AWS Certified Developer
16 6 (0.19%) PMI Certification
Quality Assurance & Compliance
1 319 (10.09%) Accessibility
2 124 (3.92%) QA
3 76 (2.41%) WCAG
4 48 (1.52%) GDPR
5 25 (0.79%) SLA
6 17 (0.54%) Data Quality
7 11 (0.35%) ISO/IEC 27001
8 10 (0.32%) ISO/IEC 19770
9 9 (0.28%) PERC
10 8 (0.25%) Sarbanes-Oxley
11 7 (0.22%) Cyber Essentials
12 6 (0.19%) Actionable Recommendations
13 5 (0.16%) 21 CFR Part 11
13 5 (0.16%) GxP
13 5 (0.16%) PCI DSS
14 3 (0.095%) ISO 9001
14 3 (0.095%) Section 508
15 2 (0.063%) Cyber Essentials PLUS
15 2 (0.063%) HL7
15 2 (0.063%) NIST
System Software
1 84 (2.66%) Docker
2 77 (2.44%) Active Directory
3 20 (0.63%) Virtual Machines
4 17 (0.54%) Virtual Desktop
5 6 (0.19%) Firmware
6 4 (0.13%) VMware Infrastructure
7 3 (0.095%) vSphere
8 2 (0.063%) RACF
8 2 (0.063%) VMware ESXi
8 2 (0.063%) XenDesktop
9 1 (0.032%) BitLocker
9 1 (0.032%) Hyper-V
9 1 (0.032%) VMware NSX
Systems Management
1 84 (2.66%) Kubernetes
2 47 (1.49%) Microsoft Intune
3 44 (1.39%) Terraform
4 12 (0.38%) HP ALM
5 7 (0.22%) Single Sign-On
6 6 (0.19%) Grafana
7 5 (0.16%) SCCM
8 4 (0.13%) Ansible
8 4 (0.13%) Jamf Pro
8 4 (0.13%) Nessus
8 4 (0.13%) Nmap
9 2 (0.063%) Microsoft Data Protection Manager
9 2 (0.063%) Prometheus
9 2 (0.063%) SmoothWall
9 2 (0.063%) Systems Management Server (SMS)
9 2 (0.063%) vCenter Server
10 1 (0.032%) AppManager
10 1 (0.032%) Backup Exec
10 1 (0.032%) BMC PATROL
10 1 (0.032%) Progress Chef
Vendors
1 242 (7.66%) Microsoft
2 153 (4.84%) Google
3 144 (4.56%) Adobe
4 58 (1.84%) SAP
5 44 (1.39%) Salesforce
6 41 (1.30%) ServiceNow
7 32 (1.01%) Oracle
8 26 (0.82%) Cisco
9 25 (0.79%) Hotjar
9 25 (0.79%) HubSpot
10 23 (0.73%) Apple
11 21 (0.66%) Qualtrics
12 16 (0.51%) Atlassian
13 15 (0.47%) Foundry
13 15 (0.47%) HP
13 15 (0.47%) Screaming Frog
14 10 (0.32%) Ahrefs
14 10 (0.32%) Citrix
14 10 (0.32%) Databricks
14 10 (0.32%) Splunk