DevOps
UK

The following table provides summary statistics for permanent job vacancies with a requirement for DevOps skills. Included is a benchmarking guide to the salaries offered in vacancies that have cited DevOps over the 6 months to 30 November 2023 with a comparison to the same period in the previous 2 years.

6 months to
30 Nov 2023
Same period 2022 Same period 2021
Rank 13 11 10
Rank change year-on-year -2 -1 -1
Permanent jobs citing DevOps 6,740 19,058 19,923
As % of all permanent jobs advertised in the UK 12.52% 15.08% 15.39%
As % of the Processes & Methodologies category 13.30% 15.75% 16.12%
Number of salaries quoted 4,990 10,935 13,419
10th Percentile £45,430 £43,750 £41,250
25th Percentile £55,000 £53,750 £51,250
Median annual salary (50th Percentile) £70,000 £70,000 £67,500
Median % change year-on-year - +3.70% +12.50%
75th Percentile £88,750 £90,000 £85,000
90th Percentile £110,000 £106,987 £100,000
UK excluding London median annual salary £62,500 £62,000 £60,000
% change year-on-year +0.81% +3.33% +9.59%

All Process and Methodology Skills
UK

DevOps is in the Processes and Methodologies category. The following table is for comparison with the above and provides summary statistics for all permanent job vacancies with a requirement for process or methodology skills.

Permanent vacancies with a requirement for process or methodology skills 50,664 120,987 123,563
As % of all permanent jobs advertised in the UK 94.08% 95.74% 95.44%
Number of salaries quoted 36,731 73,454 82,144
10th Percentile £32,500 £34,347 £32,500
25th Percentile £43,750 £45,000 £42,500
Median annual salary (50th Percentile) £60,000 £60,000 £59,500
Median % change year-on-year - +0.84% +8.18%
75th Percentile £80,000 £81,250 £77,500
90th Percentile £98,750 £100,000 £95,000
UK excluding London median annual salary £52,500 £53,000 £50,000
% change year-on-year -0.94% +6.00% +4.17%

DevOps
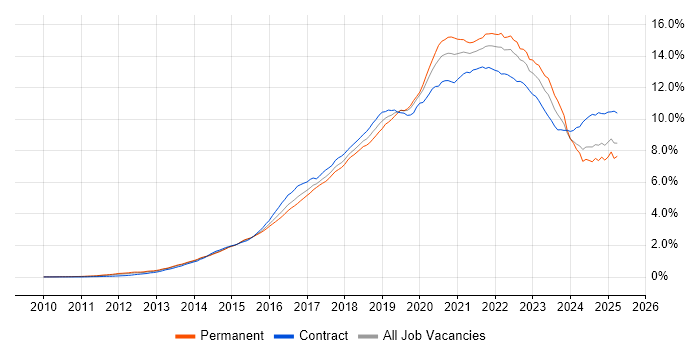
Job Vacancy Trend

Job postings citing DevOps as a proportion of all IT jobs advertised.

Job vacancy trend for DevOps in the UK

DevOps
Salary Trend

3-month moving average salary quoted in jobs citing DevOps.

Salary trend for DevOps in the UK

DevOps
Salary Histogram

Salary distribution for jobs citing DevOps over the 6 months to 30 November 2023.

Salary histogram for DevOps in the UK

DevOps
Top 18 Job Locations

The table below looks at the demand and provides a guide to the median salaries quoted in IT jobs citing DevOps within the UK over the 6 months to 30 November 2023. The 'Rank Change' column provides an indication of the change in demand within each location based on the same 6 month period last year.

Location Rank Change
on Same Period
Last Year
Matching
Permanent
IT Job Ads
Median Salary
Past 6 Months
Median Salary
% Change
on Same Period
Last Year
Live
Jobs
England -1 5,862 £70,000 - 1,947
UK excluding London +1 3,864 £62,500 +0.81% 1,302
Work from Home +1 3,462 £67,500 -3.57% 1,152
London -4 2,425 £82,500 +3.13% 860
North of England -1 1,076 £65,000 - 329
South West +5 739 £62,500 +8.70% 187
South East -1 735 £65,000 - 393
North West -1 581 £67,500 +12.50% 196
Midlands +2 559 £60,000 -4.00% 169
Yorkshire -5 431 £65,000 -3.70% 97
Scotland -4 355 £68,474 +13.01% 80
West Midlands -4 306 £60,000 -4.00% 125
East Midlands +8 255 £62,500 - 43
Wales 0 176 £57,750 -3.75% 60
East of England +4 174 £65,000 -3.70% 99
Northern Ireland +5 73 £68,750 +14.58% 14
North East +9 64 £57,500 -11.54% 38
Channel Islands +5 1 £110,000 +46.67%

DevOps
Co-occurring Skills and Capabilities by Category

The follow tables expand on the table above by listing co-occurrences grouped by category. The same employment type, locality and period is covered with up to 20 co-occurrences shown in each of the following categories:

Application Platforms
1 251 (3.72%) Confluence
2 158 (2.34%) SharePoint
3 86 (1.28%) CMS
4 82 (1.22%) Apache
5 63 (0.93%) Apache Spark
6 58 (0.86%) nginx
7 56 (0.83%) WebSphere
8 51 (0.76%) IIS
9 48 (0.71%) MS Exchange
9 48 (0.71%) Tomcat
10 44 (0.65%) Apache Airflow
11 27 (0.40%) Jupyter
12 24 (0.36%) Jetty
13 23 (0.34%) Drupal
14 21 (0.31%) Captiva
14 21 (0.31%) FileNet
14 21 (0.31%) WebSphere Application Server
15 20 (0.30%) OpenStack
15 20 (0.30%) WordPress
16 17 (0.25%) NServiceBus
Applications
1 57 (0.85%) Microsoft Excel
2 52 (0.77%) Microsoft Office
3 29 (0.43%) MS Visio
4 22 (0.33%) Microsoft Project
5 18 (0.27%) Microsoft PowerPoint
6 12 (0.18%) Adobe Illustrator
6 12 (0.18%) Photoshop
7 10 (0.15%) Chatbot
8 9 (0.13%) AutoCAD
8 9 (0.13%) PTC Creo
8 9 (0.13%) SOLIDWORKS
9 6 (0.089%) Trello
10 4 (0.059%) Spreadsheet
11 3 (0.045%) Simulink
12 1 (0.015%) CANalyzer
12 1 (0.015%) PrintSoft PReS
12 1 (0.015%) UserZoom
Business Applications
1 171 (2.54%) Dynamics CRM
2 37 (0.55%) Unit4 Business World
3 17 (0.25%) Sparx Enterprise Architect
4 12 (0.18%) Dynamics GP
5 10 (0.15%) Maximo
6 8 (0.12%) Dynamics AX
7 5 (0.074%) Dynamics NAV
7 5 (0.074%) Endur
8 4 (0.059%) SAP S/4HANA
9 3 (0.045%) Infor M3
9 3 (0.045%) Magento
9 3 (0.045%) NetSuite
9 3 (0.045%) ReMetrica
9 3 (0.045%) Salesforce CRM
10 2 (0.030%) iTrent
10 2 (0.030%) Oracle Cash Management
10 2 (0.030%) SAP FI-GL
10 2 (0.030%) Shopify
10 2 (0.030%) Visualfiles
11 1 (0.015%) Elite 3E
Cloud Services
1 4,002 (59.38%) Azure
2 2,332 (34.60%) AWS
3 2,081 (30.88%) Azure DevOps
4 984 (14.60%) GCP
5 714 (10.59%) Power Platform
6 660 (9.79%) Serverless
7 525 (7.79%) GitHub
8 502 (7.45%) PaaS
9 455 (6.75%) Dynamics 365
10 433 (6.42%) SaaS
11 352 (5.22%) IaaS
12 311 (4.61%) Microsoft 365
13 290 (4.30%) OpenShift
14 272 (4.04%) AWS CloudFormation
15 194 (2.88%) Cloud Computing
16 176 (2.61%) AWS Lambda
17 172 (2.55%) Azure Service Bus
18 169 (2.51%) Entra ID
19 166 (2.46%) Azure Data Factory
20 164 (2.43%) Amazon S3
Communications & Networking
1 177 (2.63%) DNS
2 168 (2.49%) Firewall
3 133 (1.97%) TCP/IP
4 108 (1.60%) VPN
5 91 (1.35%) Internet
6 79 (1.17%) HTTP
7 67 (0.99%) Network Security
8 62 (0.92%) DHCP
9 44 (0.65%) WAN
10 31 (0.46%) SSL
11 28 (0.42%) F5 BIG-IP GTM
11 28 (0.42%) F5 BIG-IP LTM
12 24 (0.36%) LAN
12 24 (0.36%) NGFW
13 21 (0.31%) OSPF
13 21 (0.31%) SAN
13 21 (0.31%) VLAN
14 20 (0.30%) IPv4
15 18 (0.27%) AMQP
16 16 (0.24%) Intrusion Detection
Database & Business Intelligence
1 754 (11.19%) SQL Server
2 381 (5.65%) Power BI
3 258 (3.83%) NoSQL
4 248 (3.68%) Relational Database
5 208 (3.09%) MongoDB
6 201 (2.98%) Big Data
7 189 (2.80%) PostgreSQL
8 182 (2.70%) Azure SQL Database
9 168 (2.49%) Data Warehouse
10 144 (2.14%) Data Lake
11 141 (2.09%) Elasticsearch
12 126 (1.87%) MySQL
12 126 (1.87%) Oracle Database
13 125 (1.85%) SQL Server Integration Services
14 124 (1.84%) RDBMS
15 112 (1.66%) Amazon RDS
16 92 (1.36%) SQL Server Reporting Services
17 87 (1.29%) Redis
18 74 (1.10%) Hadoop
19 69 (1.02%) BigQuery
Development Applications
1 1,020 (15.13%) Jenkins
2 977 (14.50%) Git
3 550 (8.16%) JIRA
4 324 (4.81%) GitLab
5 250 (3.71%) Selenium
6 190 (2.82%) Cucumber
7 147 (2.18%) Bitbucket
8 145 (2.15%) Maven
9 128 (1.90%) Artifactory
10 127 (1.88%) SonarQube
11 124 (1.84%) Team Foundation Server
12 117 (1.74%) Atlassian Bamboo
13 114 (1.69%) Visual Studio
14 110 (1.63%) Postman
15 105 (1.56%) TeamCity
16 99 (1.47%) Sonatype Nexus
17 91 (1.35%) Cypress.io
18 78 (1.16%) JUnit
19 71 (1.05%) CircleCI
20 70 (1.04%) Octopus Deploy
General
1 1,885 (27.97%) Finance
2 1,350 (20.03%) Social Skills
3 666 (9.88%) Banking
4 451 (6.69%) Analytical Skills
5 381 (5.65%) Inclusion and Diversity
6 314 (4.66%) Retail
7 216 (3.20%) Public Sector
8 167 (2.48%) Front Office
9 165 (2.45%) Telecoms
10 133 (1.97%) Presentation Skills
11 128 (1.90%) Law
12 113 (1.68%) Marketing
13 103 (1.53%) Influencing Skills
14 102 (1.51%) Legal
15 93 (1.38%) Manufacturing
16 82 (1.22%) Investment Banking
17 73 (1.08%) Financial Institution
18 71 (1.05%) Retail Banking
19 65 (0.96%) Aerospace
20 63 (0.93%) Electronics
Job Titles
1 1,506 (22.34%) Developer
2 1,424 (21.13%) DevOps Engineer
3 1,243 (18.44%) Senior
4 769 (11.41%) Architect
4 769 (11.41%) Lead
5 588 (8.72%) Software Engineer
6 466 (6.91%) Solutions Architect
7 387 (5.74%) Azure Engineer
8 379 (5.62%) .NET Developer
9 376 (5.58%) Senior DevOps
10 342 (5.07%) Senior Developer
11 337 (5.00%) Senior DevOps Engineer
12 325 (4.82%) Cloud Engineer
13 298 (4.42%) Analyst
14 293 (4.35%) AWS Engineer
15 249 (3.69%) AWS DevOps
16 248 (3.68%) Data Engineer
17 229 (3.40%) AWS DevOps Engineer
18 219 (3.25%) Azure DevOps Engineer
19 185 (2.74%) Dynamics 365 Architect
Libraries, Frameworks & Software Standards
1 1,262 (18.72%) .NET
2 682 (10.12%) React
3 613 (9.09%) AngularJS
4 556 (8.25%) HTML
5 517 (7.67%) CSS
6 412 (6.11%) Node.js
7 385 (5.71%) REST
8 349 (5.18%) .NET Core
8 349 (5.18%) ASP.NET
9 317 (4.70%) JSON
10 315 (4.67%) .NET Framework
11 260 (3.86%) Spring
12 257 (3.81%) RESTful
13 248 (3.68%) Kafka
14 216 (3.20%) Vue
15 203 (3.01%) YAML
16 193 (2.86%) Web Services
17 169 (2.51%) Spring Boot
18 164 (2.43%) ARM Templates
19 156 (2.31%) Elastic Stack
Miscellaneous
1 431 (6.39%) Public Cloud
2 346 (5.13%) Cloud Native
3 322 (4.78%) Product Ownership
4 197 (2.92%) Private Cloud
5 180 (2.67%) Greenfield Project
6 167 (2.48%) Data Centre
7 141 (2.09%) Enterprise Software
8 135 (2.00%) Management Information System
9 133 (1.97%) Distributed Systems
10 119 (1.77%) Derivative
11 103 (1.53%) Hybrid Cloud
12 96 (1.42%) Hedge funds
13 93 (1.38%) Foreign Exchange (FX)
14 92 (1.36%) Virtual Team
15 91 (1.35%) Self-Motivation
16 82 (1.22%) Mobile App
16 82 (1.22%) Onboarding
17 79 (1.17%) Fixed Income
17 79 (1.17%) Low-Code
18 74 (1.10%) Linux Command Line
Operating Systems
1 1,065 (15.80%) Linux
2 595 (8.83%) Windows
3 277 (4.11%) Unix
4 237 (3.52%) Windows Server
5 123 (1.82%) Red Hat Enterprise Linux
6 50 (0.74%) Android
7 41 (0.61%) Apple iOS
7 41 (0.61%) Windows Server 2016
8 38 (0.56%) Ubuntu
9 35 (0.52%) Solaris
10 29 (0.43%) Windows Server 2019
11 28 (0.42%) Windows 10
12 27 (0.40%) CentOS
12 27 (0.40%) HPUX
13 26 (0.39%) Windows Server 2012
14 25 (0.37%) Debian
15 23 (0.34%) VMS
16 14 (0.21%) Mac OS
17 12 (0.18%) AIX
18 11 (0.16%) Fedora
Processes & Methodologies
1 3,489 (51.77%) Agile
2 2,392 (35.49%) CI/CD
3 1,307 (19.39%) Software Engineering
4 1,280 (18.99%) Infrastructure as Code
5 1,096 (16.26%) Problem-Solving
6 974 (14.45%) Mentoring
7 972 (14.42%) Microservices
8 810 (12.02%) Containerisation
9 788 (11.69%) Scrum
10 785 (11.65%) Actionable Insight
11 773 (11.47%) Test Automation
12 689 (10.22%) Continuous Integration
13 572 (8.49%) TDD
14 550 (8.16%) Full Stack Development
14 550 (8.16%) Roadmaps
15 517 (7.67%) Analytics
16 507 (7.52%) SDLC
17 480 (7.12%) Computer Science
18 434 (6.44%) Business Intelligence
18 434 (6.44%) Migration
Programming Languages
1 1,899 (28.18%) Python
2 1,446 (21.45%) SQL
3 1,327 (19.69%) C#
4 1,307 (19.39%) JavaScript
5 1,293 (19.18%) Java
6 890 (13.20%) PowerShell
7 802 (11.90%) Bash
8 476 (7.06%) TypeScript
9 317 (4.70%) Go
10 257 (3.81%) Ruby
11 208 (3.09%) T-SQL
12 181 (2.69%) Perl
13 178 (2.64%) C++
14 153 (2.27%) PHP
15 137 (2.03%) Bicep
16 126 (1.87%) Shell Script
17 106 (1.57%) Groovy
18 76 (1.13%) C
19 74 (1.10%) Kotlin
20 64 (0.95%) PL/SQL
Qualifications
1 914 (13.56%) Security Cleared
2 885 (13.13%) Degree
3 614 (9.11%) SC Cleared
4 369 (5.47%) Computer Science Degree
5 206 (3.06%) Azure Certification
6 156 (2.31%) AWS Certification
7 141 (2.09%) DV Cleared
8 128 (1.90%) TOGAF Certification
9 116 (1.72%) Microsoft Certification
10 84 (1.25%) BPSS Clearance
11 68 (1.01%) Master's Degree
12 54 (0.80%) ISTQB
13 51 (0.76%) Cisco Certification
14 40 (0.59%) AWS Certified DevOps Engineer
14 40 (0.59%) AWS Certified Solutions Architect
15 33 (0.49%) ISEB
16 29 (0.43%) CISSP
16 29 (0.43%) ITIL Certification
17 27 (0.40%) CCNA
18 23 (0.34%) MCSA
Quality Assurance & Compliance
1 585 (8.68%) QA
2 118 (1.75%) Data Quality
3 89 (1.32%) Accessibility
4 82 (1.22%) ISO/IEC 27001
5 77 (1.14%) GDPR
6 54 (0.80%) SLA
7 48 (0.71%) PMO
8 28 (0.42%) NIST
9 24 (0.36%) PCI DSS
10 18 (0.27%) NCSC
11 16 (0.24%) COBIT
12 10 (0.15%) Cyber Essentials
13 9 (0.13%) SOC 2
13 9 (0.13%) WCAG
14 7 (0.10%) Software Quality Assurance
15 6 (0.089%) GAAP
15 6 (0.089%) ISO 9000
15 6 (0.089%) ISO 9001
16 5 (0.074%) DO-178B
16 5 (0.074%) IEC 61508
System Software
1 1,584 (23.50%) Docker
2 363 (5.39%) Active Directory
3 188 (2.79%) VMware Infrastructure
4 116 (1.72%) Virtual Machines
5 74 (1.10%) Hyper-V
6 57 (0.85%) Virtual Desktop
7 38 (0.56%) vSphere
8 33 (0.49%) VMware ESXi
9 28 (0.42%) Firmware
10 12 (0.18%) LXC
11 9 (0.13%) KVM
12 7 (0.10%) Ceph
12 7 (0.10%) Virtual Servers
13 5 (0.074%) Apache ZooKeeper
14 4 (0.059%) DFS Replication
14 4 (0.059%) FreeRADIUS
14 4 (0.059%) IAG
14 4 (0.059%) NFS
15 3 (0.045%) Oracle RAC
15 3 (0.045%) VMware Server
Systems Management
1 1,879 (27.88%) Kubernetes
2 1,715 (25.45%) Terraform
3 909 (13.49%) Ansible
4 267 (3.96%) Puppet
5 198 (2.94%) Grafana
6 170 (2.52%) Prometheus
7 149 (2.21%) Progress Chef
8 62 (0.92%) Packer
9 60 (0.89%) Istio
10 58 (0.86%) Microsoft Intune
11 56 (0.83%) Argo
12 55 (0.82%) Nagios
13 53 (0.79%) Rancher
14 50 (0.74%) SCCM
15 43 (0.64%) Active Directory Federation Services
16 39 (0.58%) Single Sign-On
17 36 (0.53%) Kibana
18 25 (0.37%) SCOM
19 24 (0.36%) HP Quality Center
20 23 (0.34%) Docker Swarm
Vendors
1 1,509 (22.39%) Microsoft
2 340 (5.04%) Oracle
3 327 (4.85%) Google
4 263 (3.90%) VMware
5 155 (2.30%) Databricks
6 152 (2.26%) Splunk
7 149 (2.21%) ServiceNow
8 139 (2.06%) IBM
9 115 (1.71%) Red Hat
10 98 (1.45%) SAP
11 89 (1.32%) Cisco
12 86 (1.28%) Atlassian
13 77 (1.14%) Citrix
14 64 (0.95%) HP
15 57 (0.85%) New Relic
16 50 (0.74%) Salesforce
17 49 (0.73%) Remedy
18 48 (0.71%) TOWER Software
19 39 (0.58%) Fortinet
20 37 (0.55%) Dynatrace